Common Mistakes Ruining Web Vitals

Under the PageSpeed.ONE project, I've completed dozens of speed audits and smaller analyses for variously sized websites. I decided to review all the analyses to identify the most common mistakes that repeatedly appear in our audits and spoil the Core Web Vitals metrics.
You can watch the recording of the talk on the Frontendisti YouTube channel. If you prefer the written form, dive into today's article below.
Contents
- Web Vitals in a Nutshell
- How to Measure Your Website's Speed?
- FID - A JavaScript Metric That's Barely Needed for Optimization
- LCP - Probably the Most Important and My Favorite Metric
- CLS - A Metric Full of Misunderstandings
Web Vitals in a Nutshell
Website speed is an increasingly complex topic where it's easy to get lost. And then there are these Web Vitals. What are they, and why should we care?
Web Vitals are metrics from Google set to become one of the ranking criteria for search results. More details on Google Page Experience deserve a separate article, so if you want to read more about this update, I refer you to the blog post on Google Page Experience by Martin Michálek.
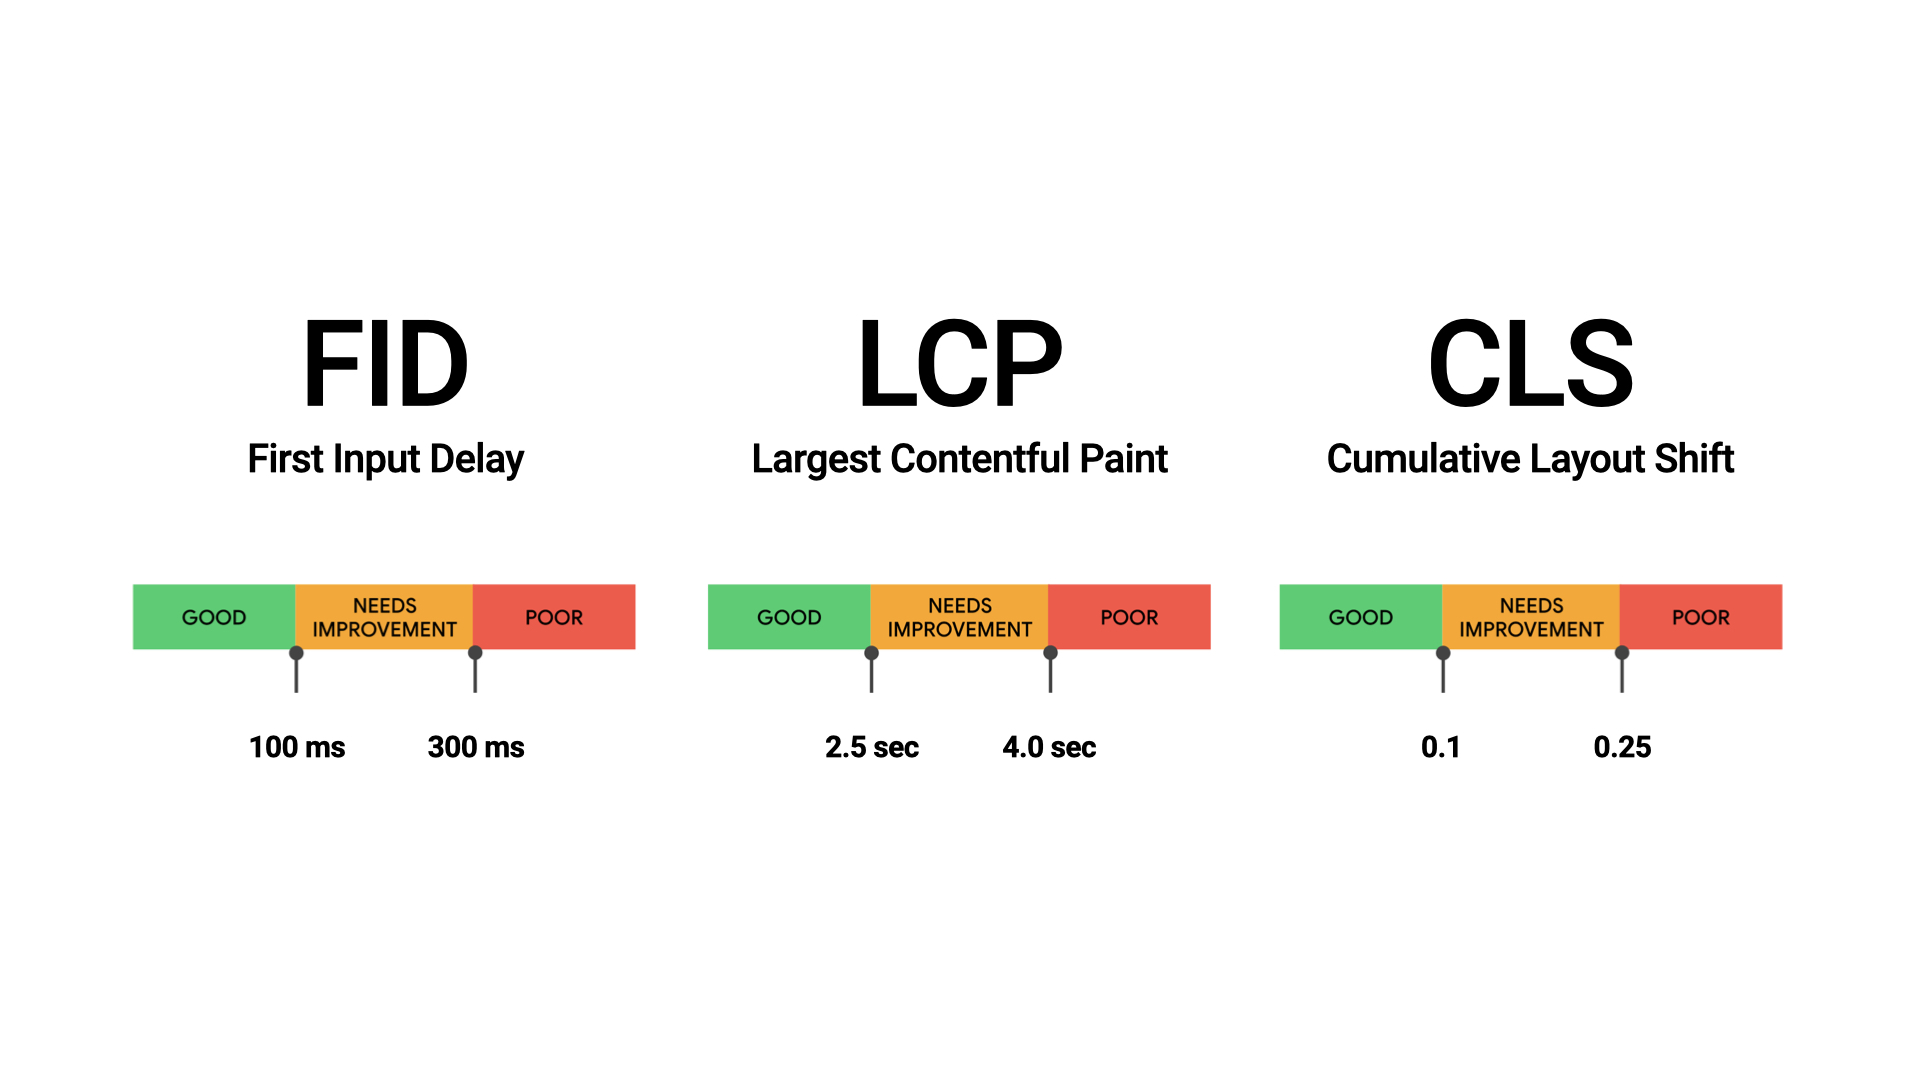
Now, a quick look at Web Vitals. There are three core metrics: First Input Delay (FID), Largest Contentful Paint (LCP), and Cumulative Layout Shift (CLS). Each metric has recommended values, as seen in the image.
But we still don’t know how to measure Web Vitals.
How to Measure Your Website's Speed?
There are many options. One tool is Google Data Studio, where you can create reports with the results of individual metrics. Unfortunately, working with Data Studio is often complex and time-consuming.
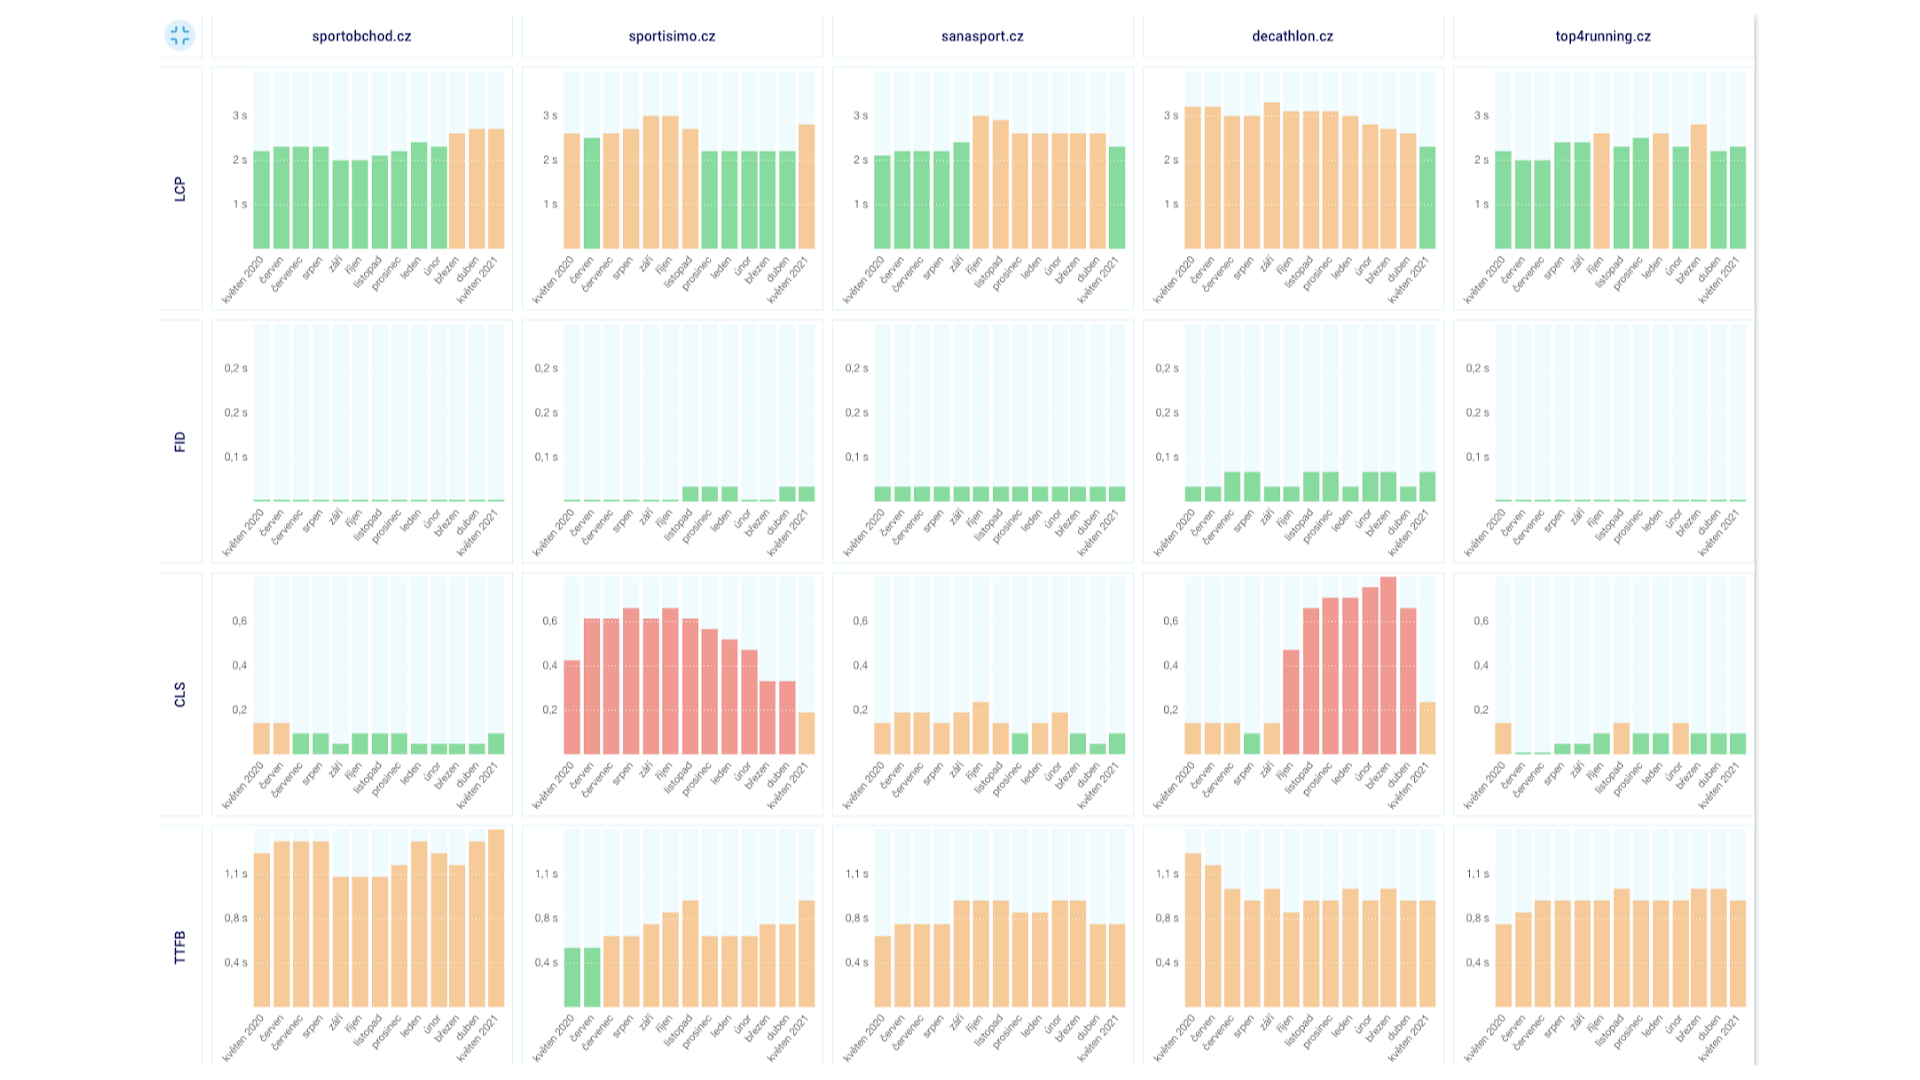
Web Vitals can also be displayed by PageSpeed Insights, but the data there is quite limited and simplified. Therefore, at PageSpeed.ONE, we came up with tester update 2.0, which (among other things) addresses this issue. The result is a complete overview of user data simply and clearly upon entering a specific address.
If you just entered the addresses of your websites into the tester and the results aren't to your liking, I have good news. Many errors recur on almost every website, so let's take a look at what you should be seeking.
FID - First Input Delay
Let's start with the First Input Delay metric. As the name subtly suggests, it's a JavaScript affair that measures the time from the user's first interaction with the page until the browser processes the interaction.
We haven't had to focus much on FID, as it appears to be a lenient metric. Its threshold for a good rating is 100 ms, which websites manage to meet.
A very similar JS metric is Total Blocking Time (TBT), which Google suggests is related to FID. However, in practice, a poor TBT score has not been shown to mean a poor FID score. But if you optimize TBT, you often also improve the FID metric.
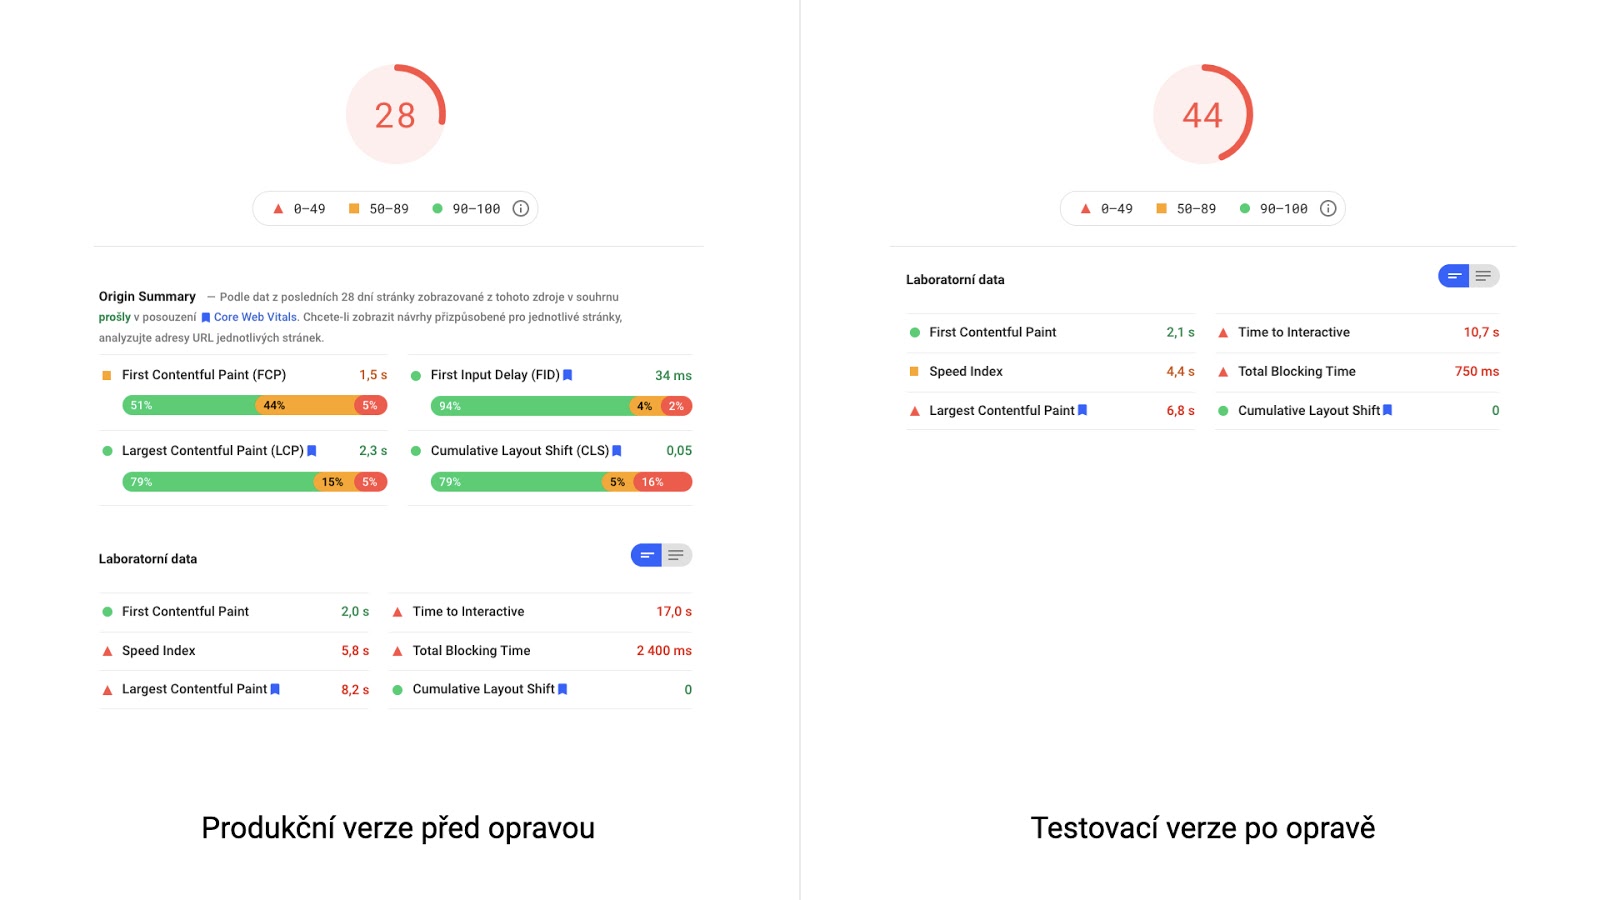
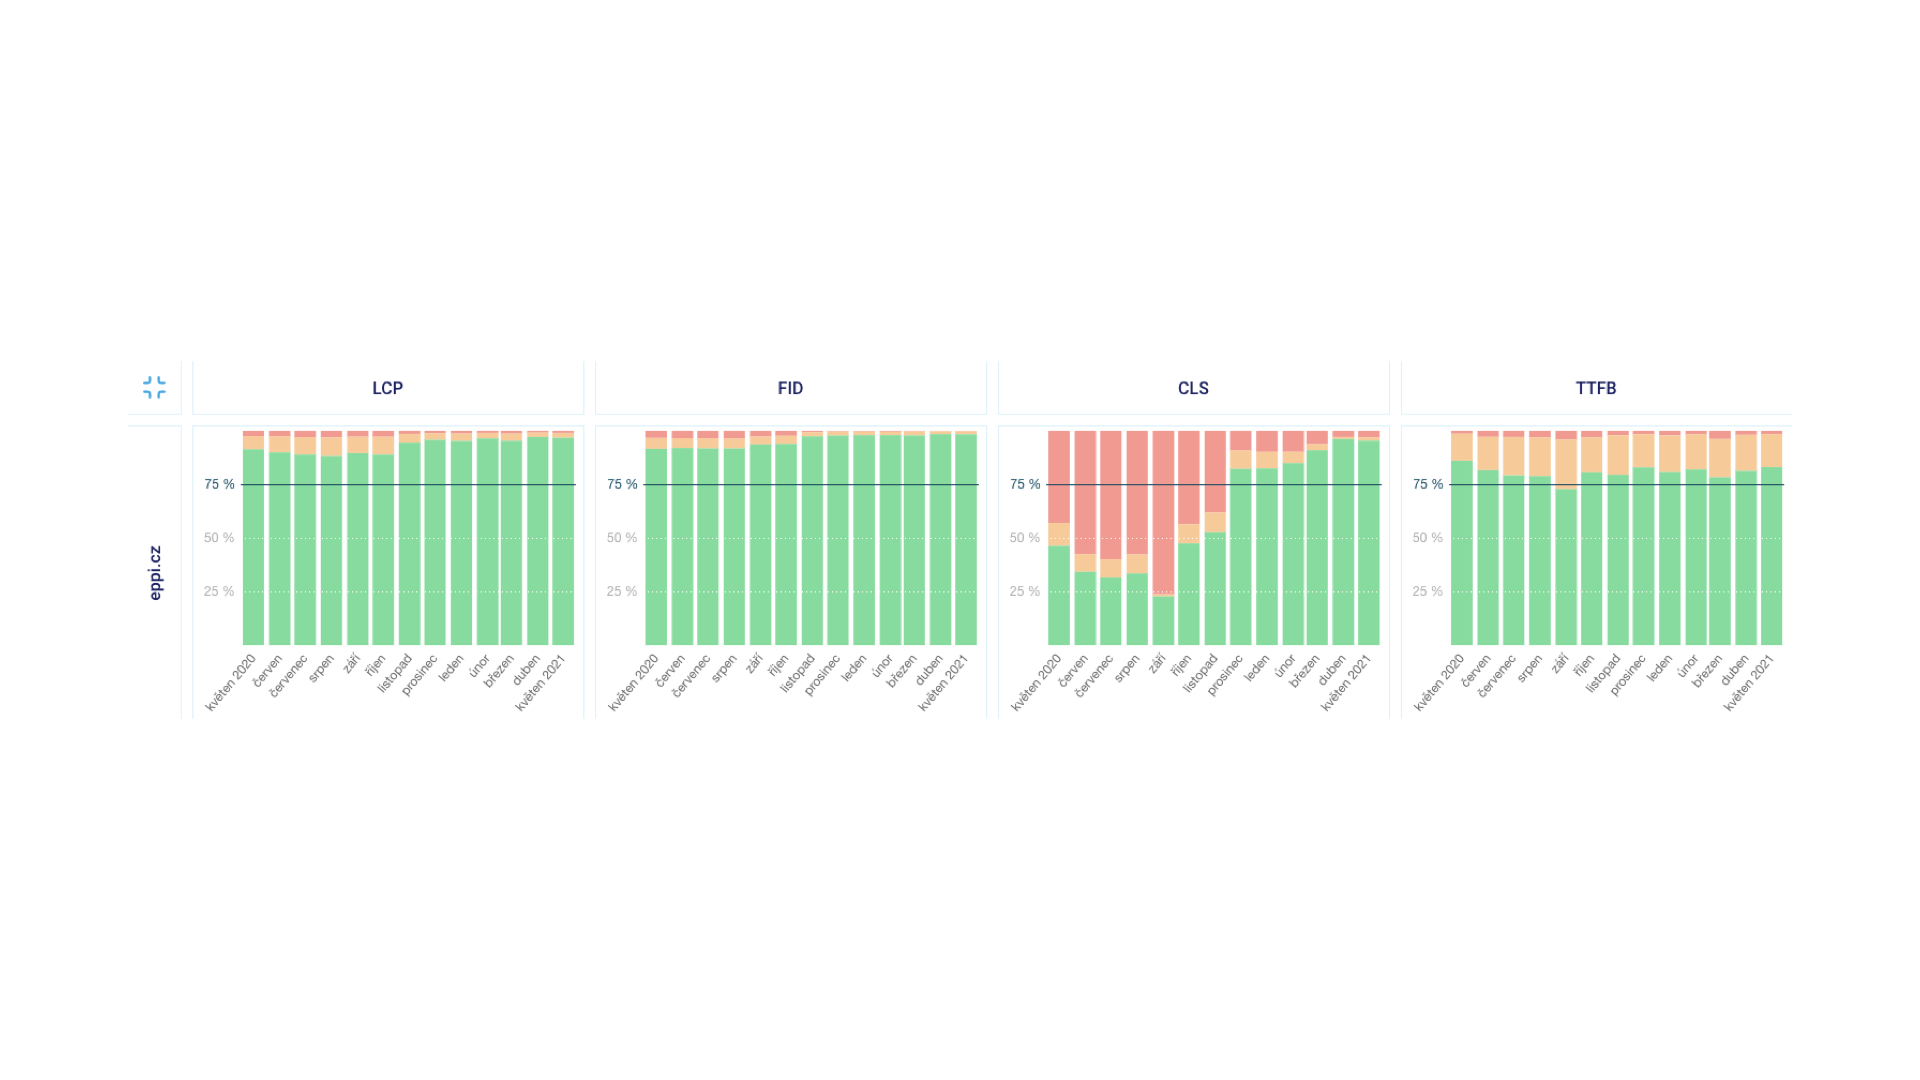
One example of botched JavaScript metrics says it all. In the first half of the screen below is the measurement result of a page where a YouTube video in an iframe is rampant, a notorious killer of TBT and Time to Interactive (TTI) metrics. The metrics are high because YouTube is downloading large CSS and JS files.
Solution for better metrics? For YT embedded via iframe, either use native lazyloading or YouTube Lite Embed.
LCP - Largest Contentful Paint
My favorite metric, Largest Contentful Paint, is just that because it's comprehensive. To optimize it, you need to master many areas during loading. It thoroughly tests developers' knowledge in the web loading process and allows us to measure the rendering of the largest element on the page.
When tuning LCP, the most important step is identifying LCP elements. They are often different for mobile and desktop. You can reliably identify your LCP elements using Lighthouse, PageSpeed Insights, or in the test detail in our PageSpeed.ONE tool.

LCP and Lazy Loading
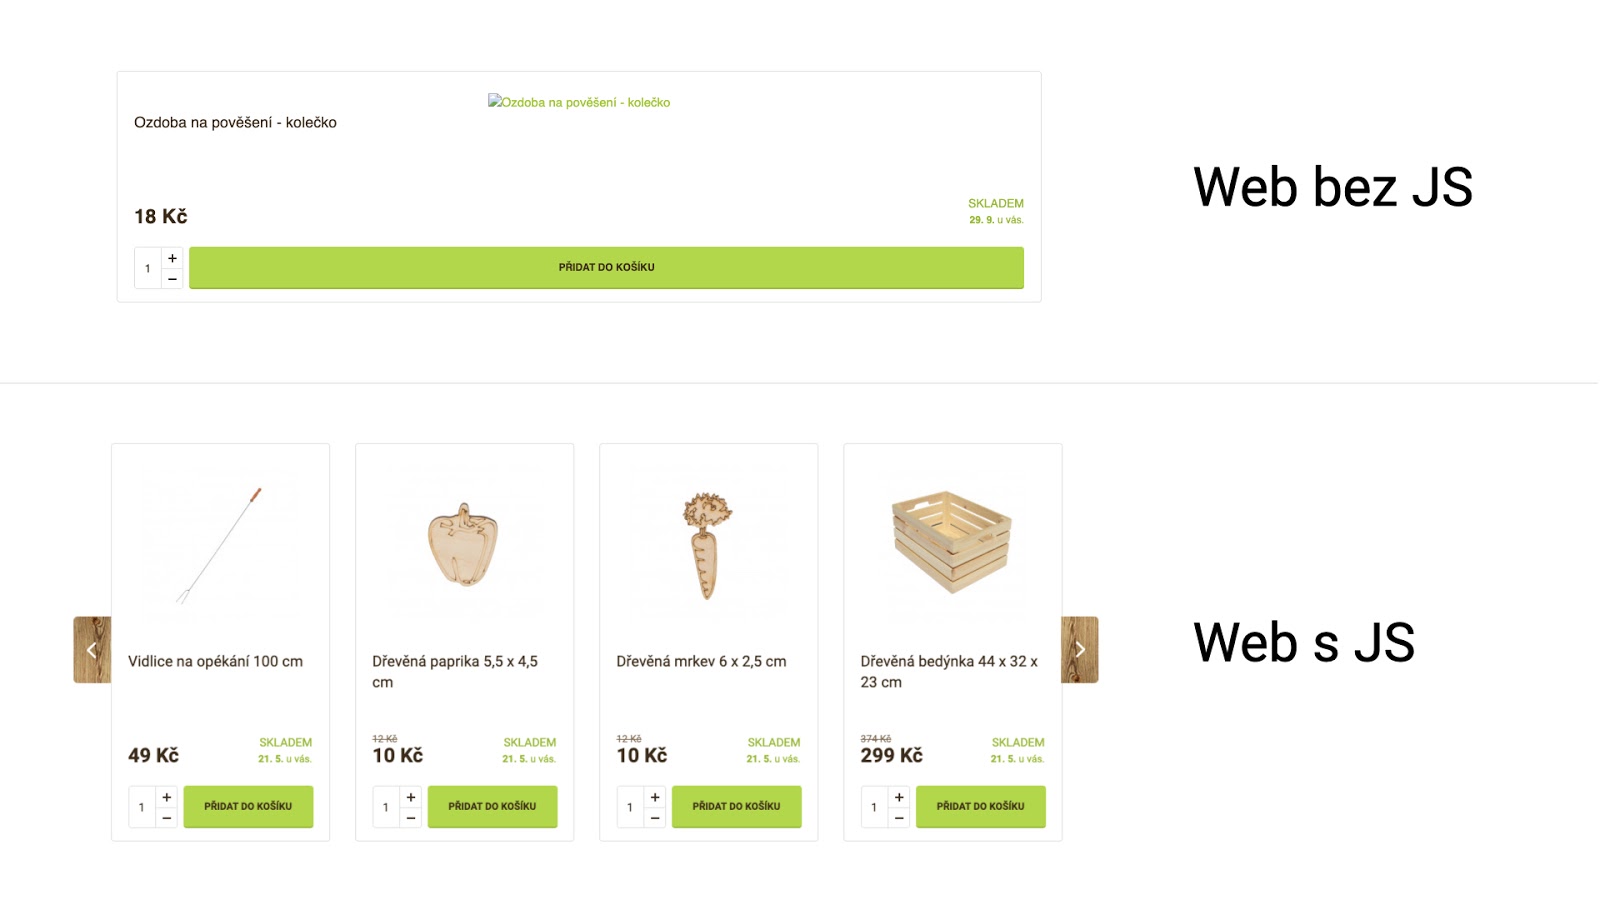
The vast majority of websites harm their LCP metric with poorly implemented lazy loading. It's crucial to realize that lazy loading changes the order of image downloads.
A common mistake is lazy loading only on large images on the page. Yes, logically, deferring the loading of the largest images saves the most data, but in the case of an LCP element, it undermines your efforts.
The rule is that images without lazy loading are downloaded first. Images with lazy loading are downloaded later, even if they're in the viewport. If you have lazy loading on an image that is also an LCP element, it will be downloaded much later, increasing the LCP time.
You've likely already figured out the solution while reading: remove lazy loading from LCP elements on your site and, conversely, add lazy loading to all other elements.
LCP and Complex DOM
Bad news right from the start: this usually takes a lot of time to optimize. On the bright side, I'll give you a hotfix until you can make larger code changes.
The problem often arises in design, where there's a big difference between the desktop and mobile versions. Of course, you need to solve this, often by hiding elements on mobile.


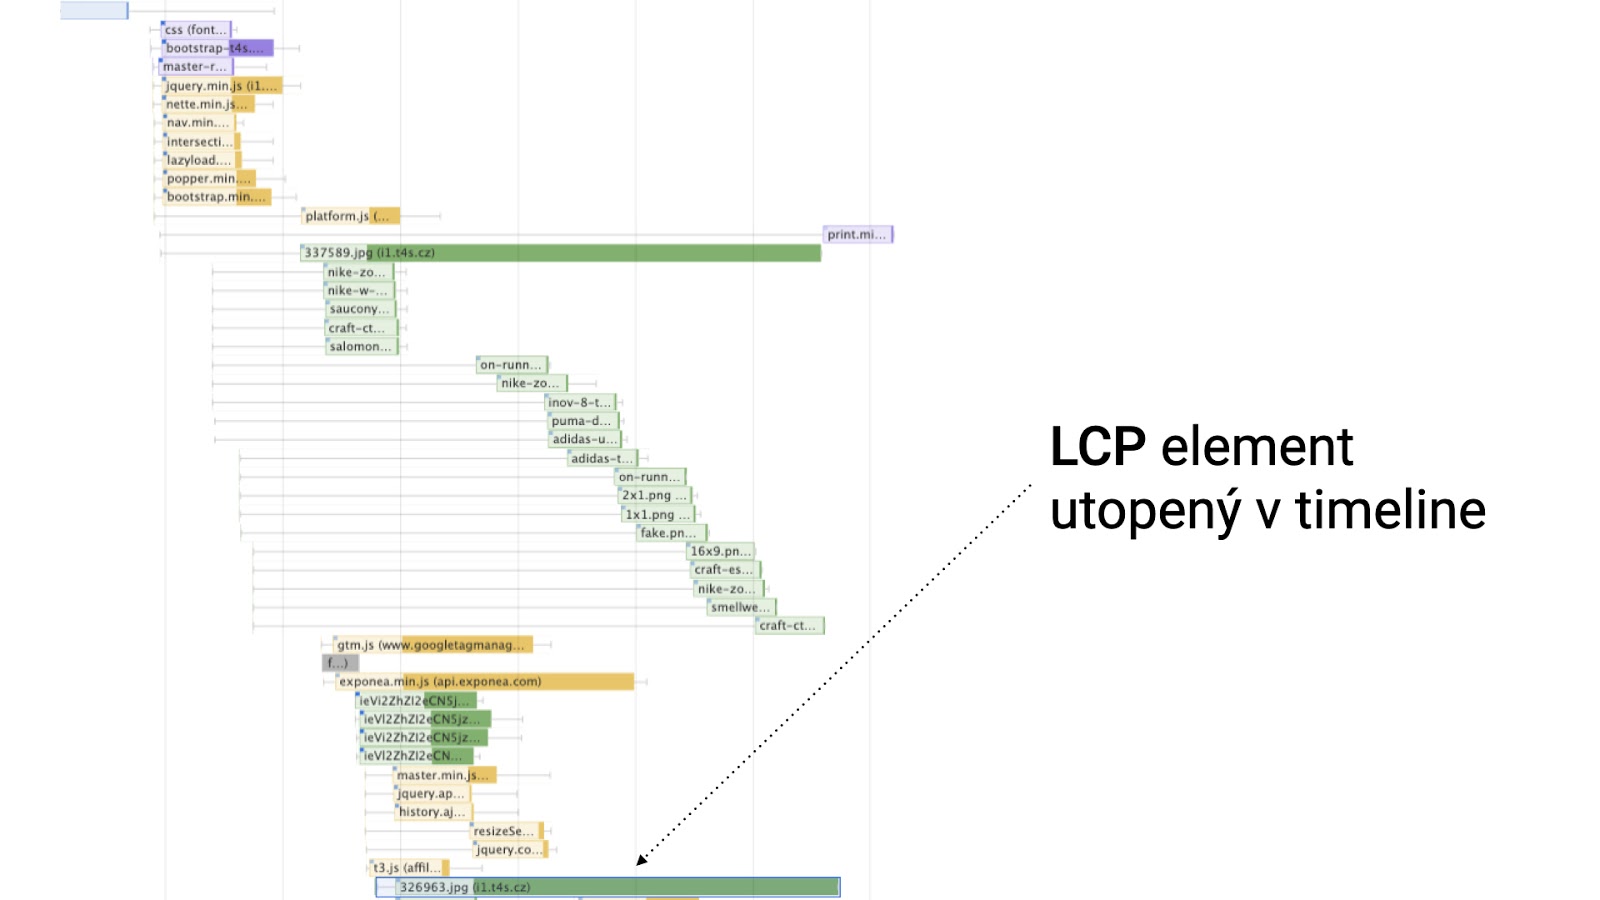
The dark blue area is quite extensive, isn't it? This will mess with your LCP metric. It's important to note that it wouldn't matter much if we were talking about simple DOM text elements. The problem here is with lots of images that will be downloaded even if they're not visible.
There are several solutions. If you have the time and space, rewrite the HTML to reflect the LCP elements. You can also use preload for the image identified as LCP on mobile.
<link rel="preload" as="image" href="image.jpg" />
Use preload cautiously, especially if you already have other preloads on the page. You can also use loading="lazy", as images in hidden elements with this attribute won't be downloaded.
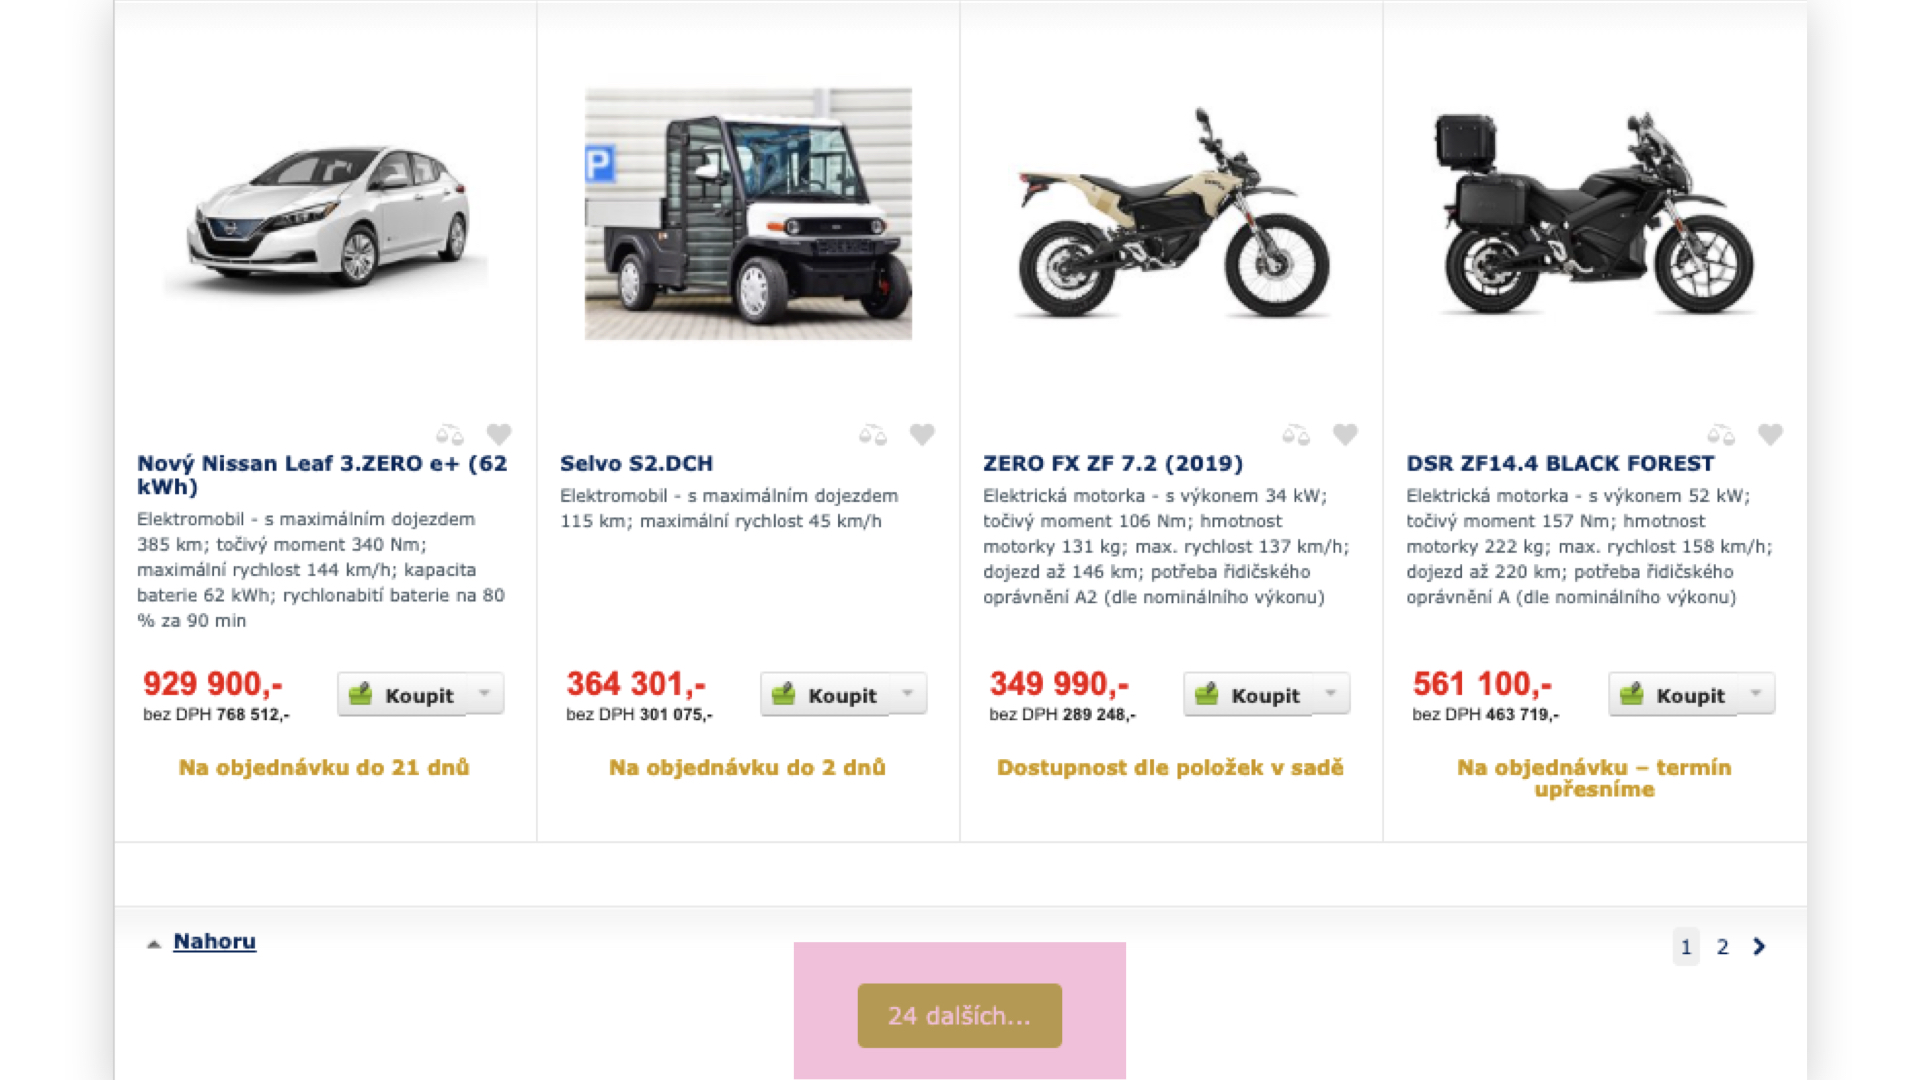
LCP and Images from WYSIWYG
Working with images in the editor needs monitoring. Many e-commerce sites write blogs under their domain, which can also mess up metrics, and it often happens. I don't want to bash developers, but what a user uploads via WYSIWYG is your problem too. Here, you need to resolve sizes, compression, appropriate formats, and srcsets.

CLS - Cumulative Layout Shift
Cumulative Layout Shift deals with the movement and jumping of the page layout. It's not just layout shifts during loading that are critical; synthetic tools measure these, but you also need to address layout shifts during page browsing. You can discover this by looking into user data in the Chrome UX report.
How to test such CLS? Ideally, through a Chrome extension called Web Vitals, or in Chrome itself in the rendering tab with the checkbox “Core Web Vitals.”
CLS and Width and Height Attributes
Concerning CLS, we comment on missing width and height attributes on image tags on every website. Often, it's an oversight, so it's essential to search for all images on the project and check for missing attributes.
<img src="image.jpg" alt="img" width="150" height="200" />
Another solution for not just image jumping but also other content elements will be the upcoming CSS property aspect-ratio. With one line of code, you resolve the space an element should reserve for its content.
.box {
	aspect-ratio: 4/3;
	background: grey;
}
If you need an infallible solution right now, we recommend the padding-top trick.
CLS and Carousels (for Example)
Cumulative layout shift can be worsened not only by carousels but by any content initialization via JavaScript. Often, these are various quizzes, calculators, widgets, etc.
In general, JavaScript initialization comes very late, causing CLS to rise. It's not good to handle things with JavaScript that can be styled in CSS. Typically, these are the widths of individual items in a carousel.
Therefore, handle the widths and heights of elements in CSS, and test your website with JavaScript disabled. This will help you pinpoint weak spots on the website. The Chrome extension Web Developer can help, allowing you to disable JavaScript with a single click.
CLS and AJAX
The CLS metric isn't just calculated at page load but also during user navigation. If a user decides to load "another 24 products" on the website, you have a 0.5-second window to display the content without further raising CLS.
The instructions for such a situation are as follows: Test on slow networks and load content deferred when the browser is "bored" using RequestIdleCallback();.
A Few Words in Conclusion
If you're new to website speed and I've overwhelmed you with a slew of new information, don't despair. First, go make yourself a coffee, then focus on data collection and testing. You should be interested not only in user data Web Vitals but also in synthetic measurements. Ideally, all in the context of several months.
Regarding synthetics, Lighthouse has been released in version 8, where, for instance, the calculation of the score itself has been adjusted. For example, the TBT and LCP metrics together make up 55% of the total calculation weight. This alone suggests which metrics you should focus on.
Finally, I want to pass on enough enthusiasm and curiosity to all developers to understand how browsers really work. Focus on DevTools and the Performance tab for optimizations, think holistically, and try to figure out how various aspects of the web influence each other. At Vzhůru dolů, you can also learn to optimize both problematic metrics – CLS and LCP.
Discussion
Following the presentation, there was also a moderated discussion where I, along with Michal Matuška, answered questions from the audience.
Jak je rychlý váš web?
Jak rychlý je váš web v porovnání s vaší konkurencí? To zjistíte
pomocí našeho online testeru.
Tagy:Core Web Vitals