Monitoring v4.6: Speed Scores, New Notes, and Dozens of Other Changes
At PageSpeed.ONE, Christmas comes a little early for our speed monitoring users. In the first week of December, we gifted them a new version of our tool.
Expect a major overhaul of Notes, a new speed score, and a better way to evaluate Watchdog notifications. In total, about 80 changes to our monitoring application.
PageSpeed.ONE Score: Website Speed in a Single Number
Measuring speed is complex. You need to know many metrics and understand different types of measurements. It's a labyrinth, especially when managing multiple websites.
That's why we're introducing the PageSpeed.ONE Score (SPS), which distills everything into a single number and color, reflecting the most critical value: all Core Web Vitals metrics from users.
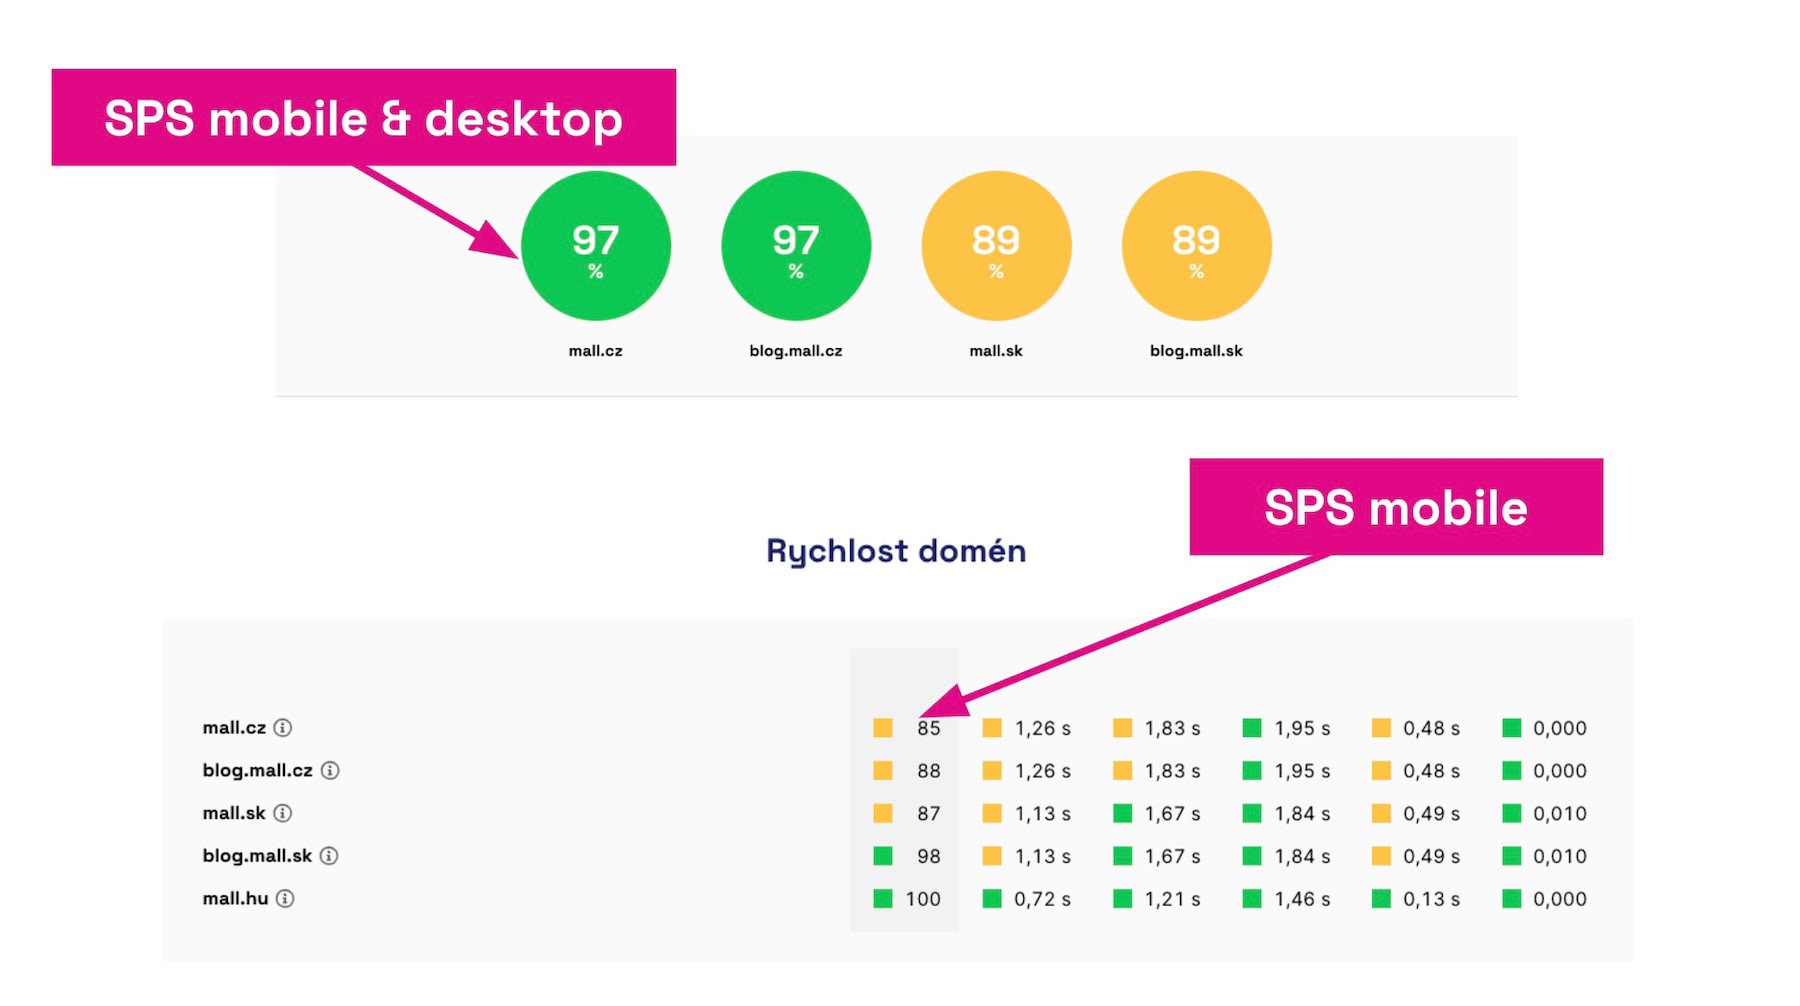 The speed score (SPS) is calculated for the entire domain, separately for mobile and desktop, as well as combined.
Why introduce the SPS metric? The goal is to simplify the view on data from the Chrome UX Report, especially when monitoring multiple websites. Now, you should be able to focus on just one number.
How is the score calculated? Each metric, each device type has its weight. The color of the metric signals the overall rating you receive for speed from Google, which uses a three-tier scale—green, orange, and red.
We're continuing to work on ensuring that speed monitoring reliably leads you to the most important information and helps you easily understand your website's speed. The score is just the first step in a series of updates.
Measure your website's speed score: pagespeed.one.
Major Update to Notes
We consider Notes in graphs to be one of the most important tools for properly improving website speed. That's why this version includes significant changes to how you work with this tool.
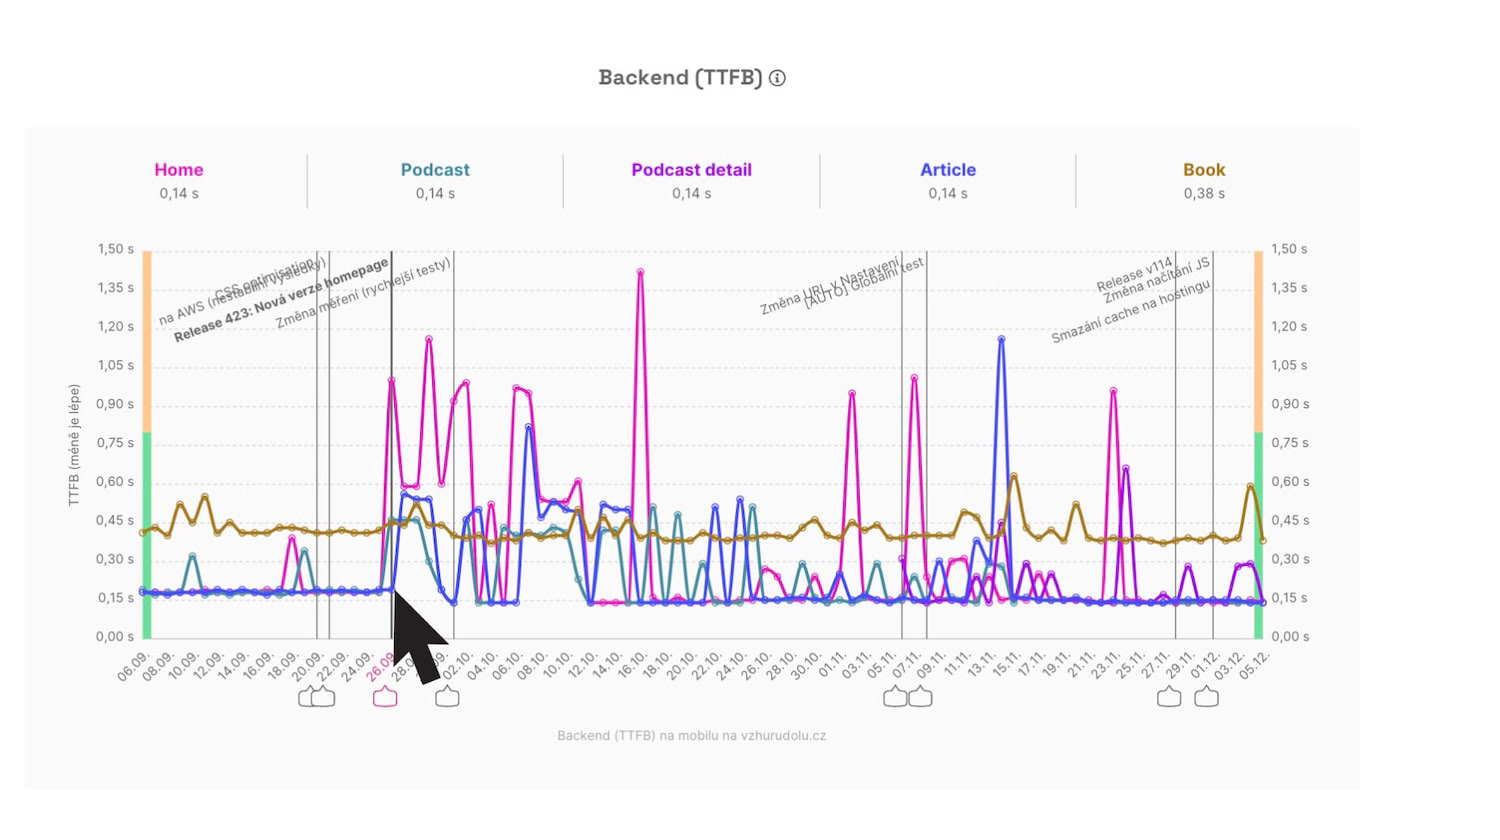
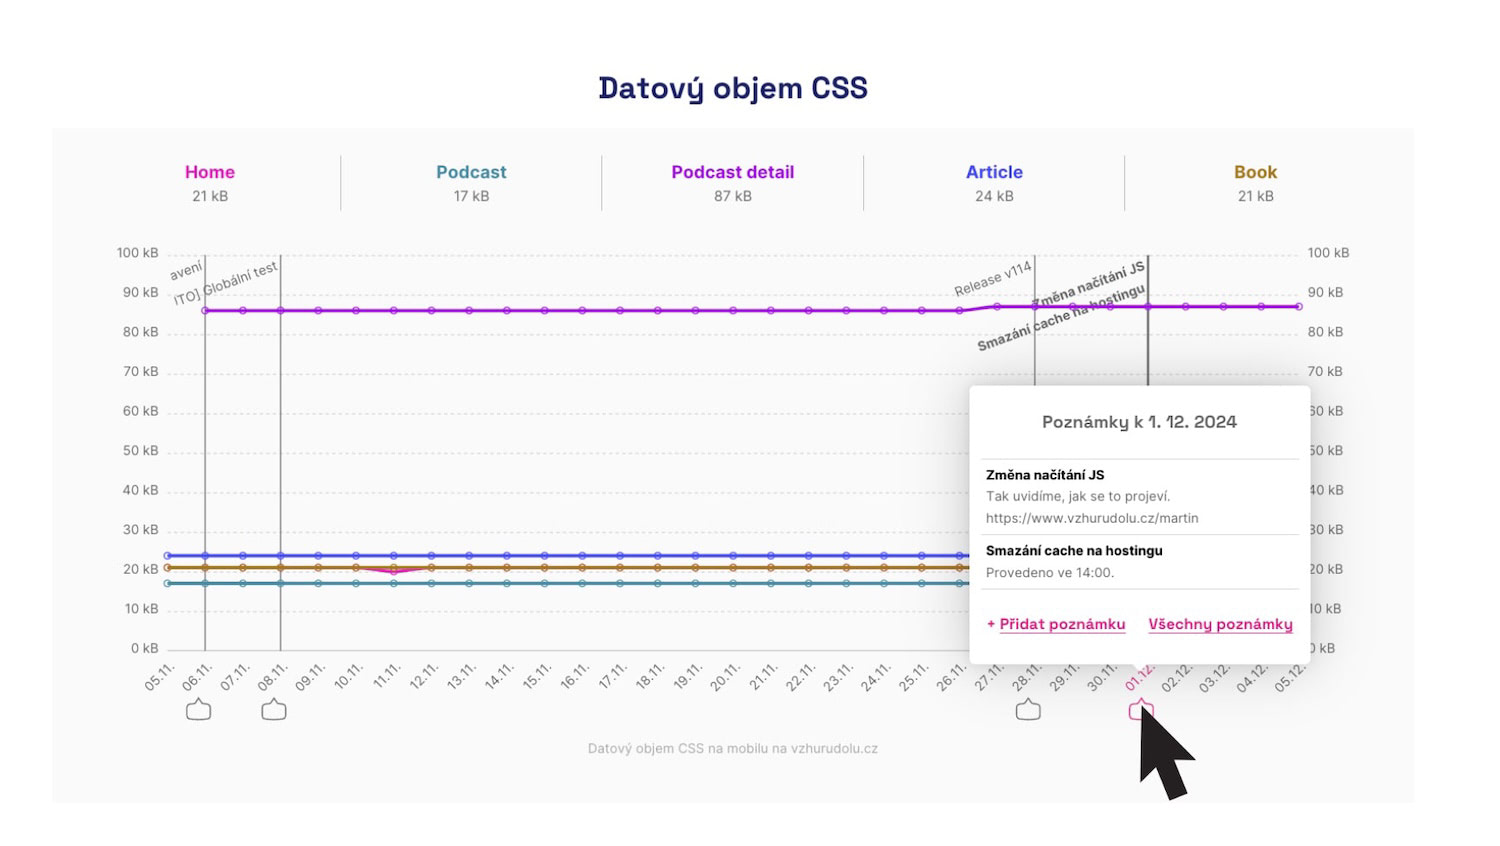 Inserting notes about important website changes into graphs allows you to link speed changes with specific adjustments.
For version 4.6 of Monitoring PLUS, we've prepared several significant changes for working with notes:
- It's now possible to add or display multiple notes for a single day in graphs.
- We distinguish your notes from those inserted automatically, e.g., during measurement changes.
- Notes are now more visible, including being featured in the main test navigation.
- You can now add more detailed text to a note.
We've made improvements to notes as well, which you'll see for yourself.
 Notes about significant changes are the basis for retrospective problem assessment or even a reason to celebrate when something is fixed.
What will happen to your existing notes? No worries, everything will remain as it is.
Users of Monitoring PLUS highly appreciate the notes feature. Eduard Beneš from PragueBest wrote to us:
“We appreciate the ability to check data daily and the email notifications. It's proven beneficial to mark changes in the tool and monitor their impact.”
Find more in the newly updated Notes Help.
How to Evaluate Watchdog Notifications
We claim that our speed monitoring is among the best in the market. Unlike the competition, we don't make you manually set monitored metric levels. We have a very sensitive algorithm that varies for different metrics, thus significantly reducing noise from signals from other speed monitoring tools.
Still, evaluating Watchdog notifications requires having certain knowledge at hand (or in mind). Not every Watchdog alert simply requires action.
Therefore, we provide guidance on how to evaluate the signals from our monitoring. Our mission is to make website speed more comprehensible even to laypeople, and this step is part of that mission.
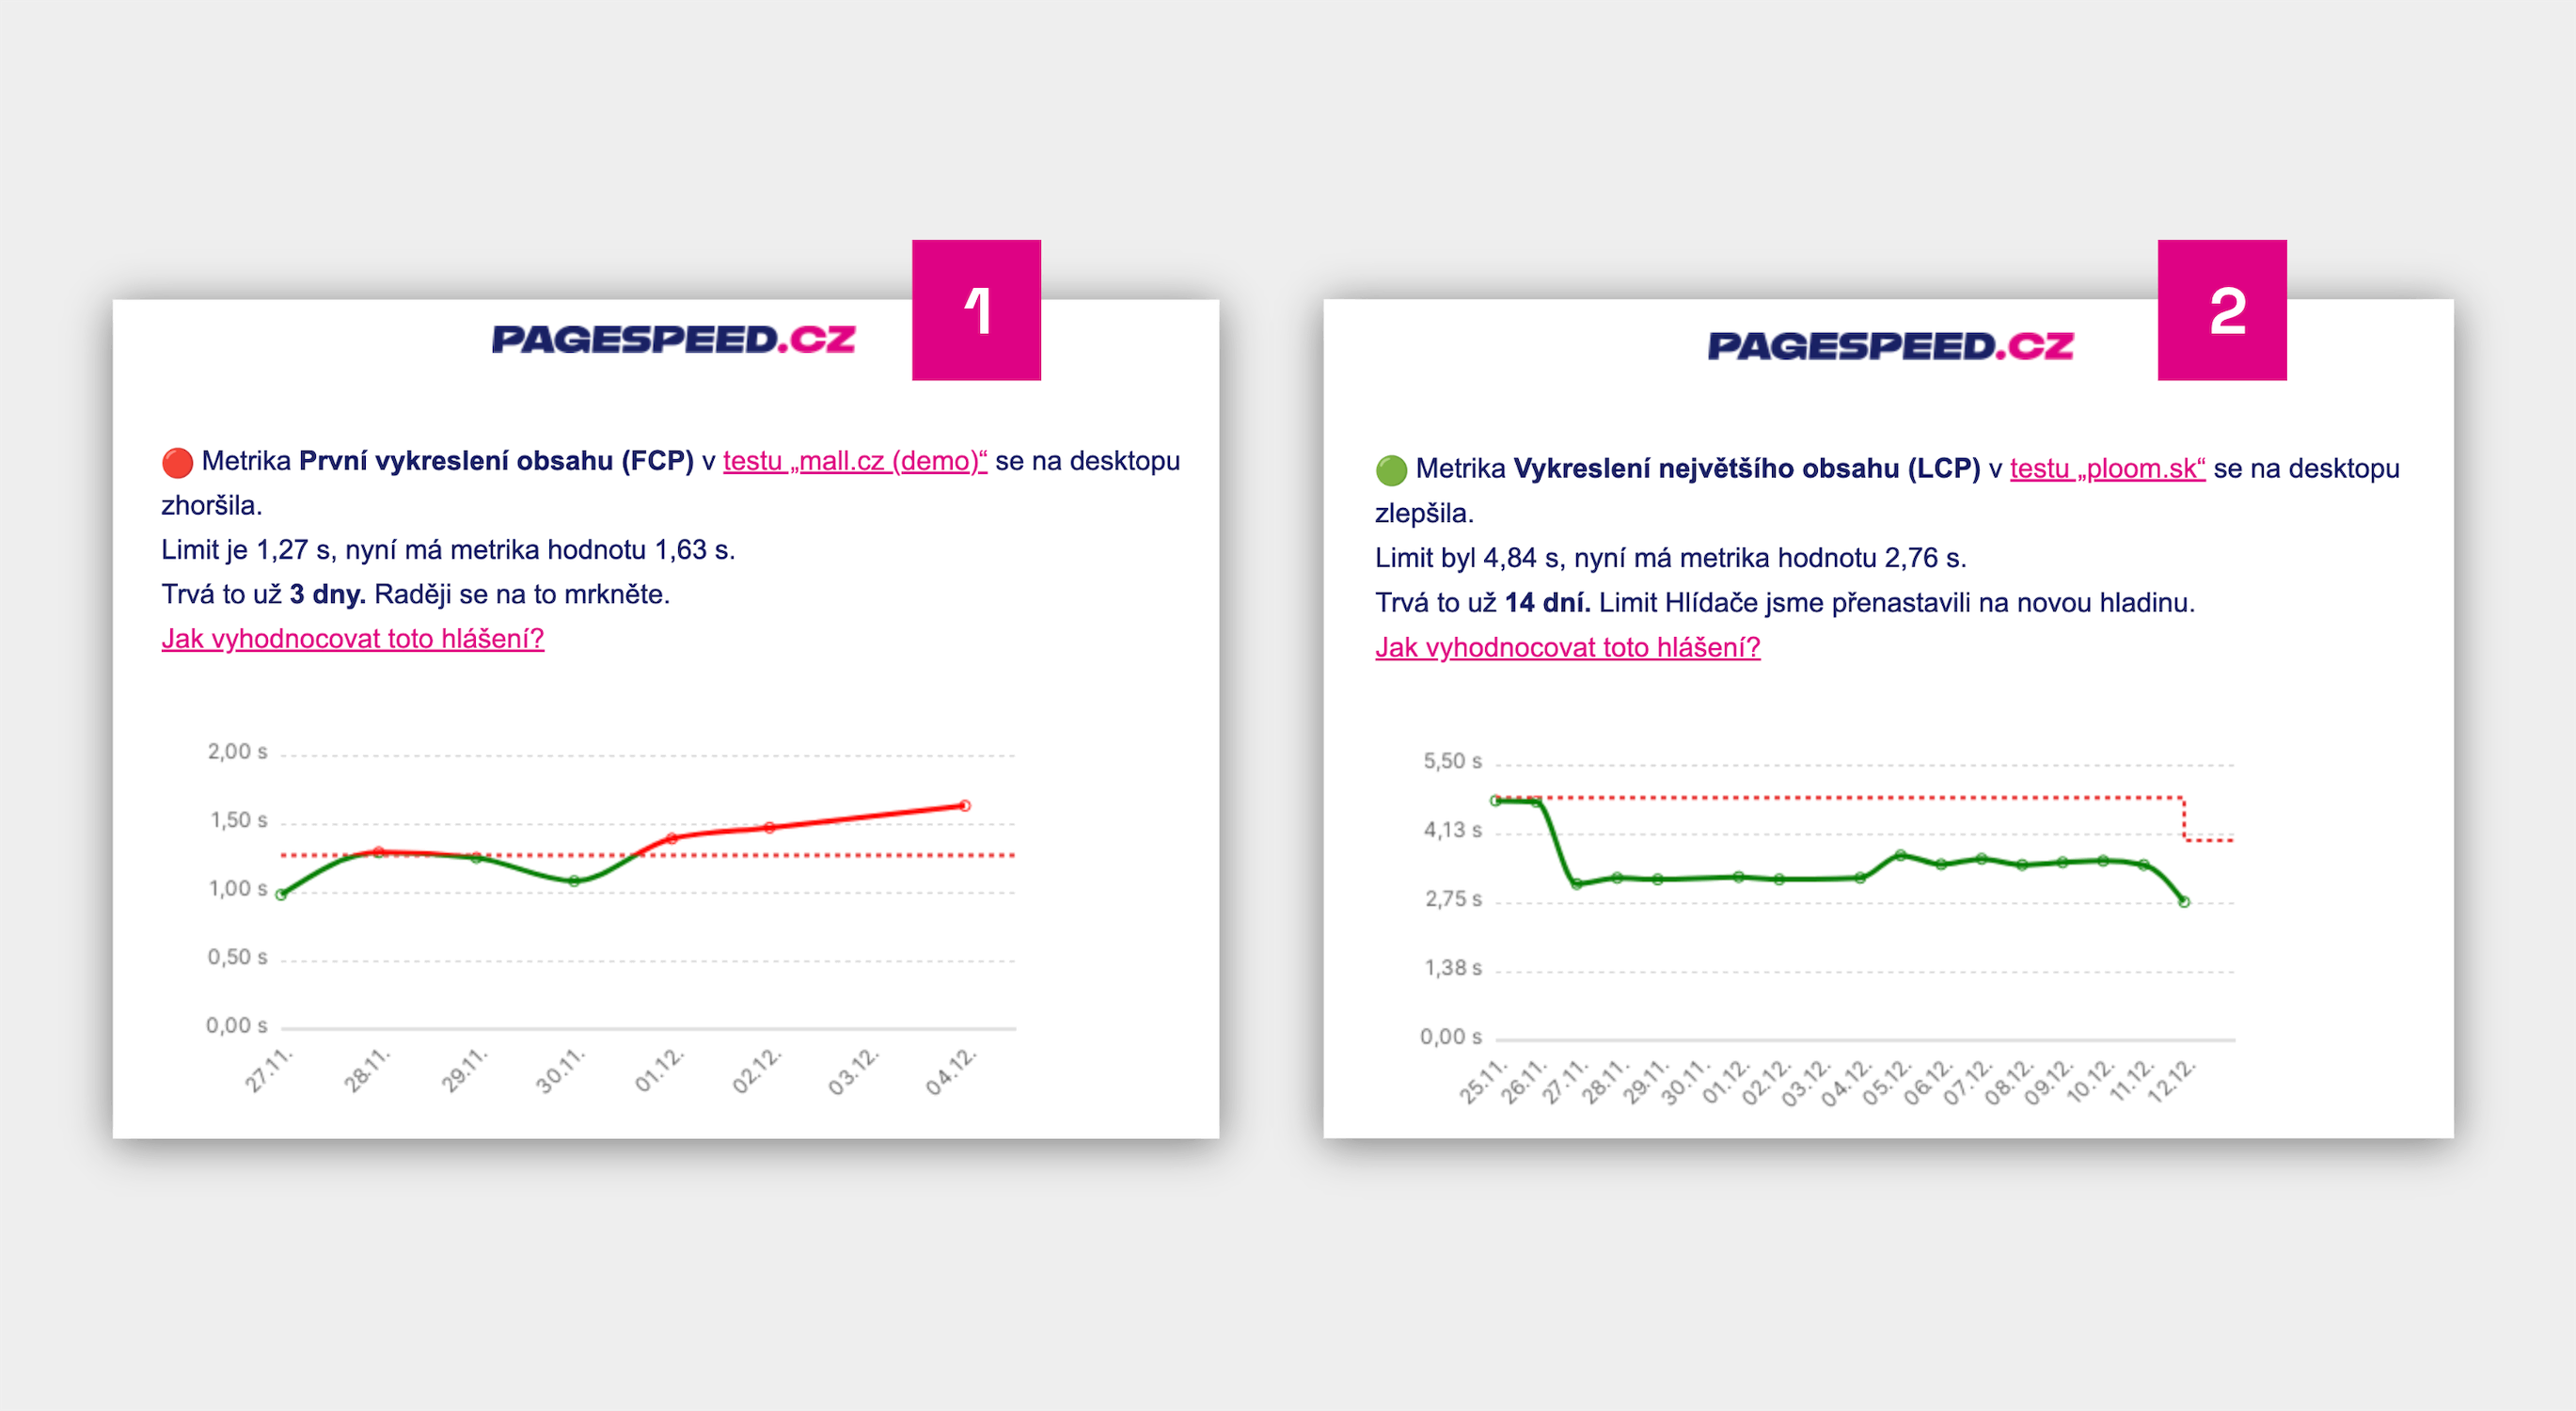 Each Watchdog report now includes information on how to evaluate the notification.
The Watchdog is a crucial part of speed monitoring. Check out the help page on evaluating Watchdog reports for individual metrics.
Help Content Updates
Our educational mission continues by sharing our know-how with the wider public on our help pages. Are you familiar with pagespeed.one?
What's new in the Help for web speed added during the work on version 4.6 monitoring?
- How can backend developers help with speed? (authored by Zuzana Šumlanská)
- What's the benefit of the Chrome UX Report? (Zuzana Šumlanská)
- How to optimize INP? (Zuzana Šumlanská)
- What does basic React optimization entail? (Michal Matuška)
- What does the INP setTimeOut trick do? (Michal Matuška)
- WebP images: how do they help speed? (Radek Šír)
- How to optimize LCP? (Radek Šír)
- How to optimize CLS? (Radek Šír)
- How to maintain the element height without worsening CLS? (Radek Šír)
However, there were numerous updates to the Help. We strive to keep this section as fresh as possible.
Follow changes in the Help and receive more updates on our social media (LinkedIn, Facebook, X) or in our newsletter.
Smaller Product Tasks
Take a look at the smaller tweaks that positively impacted monitoring after deploying version 4.6:
- UI: Info when we don't have CrUX data for a domain is now displayed outside the dashboard as well.
- Watchdog no longer monitors Lighthouse score (LPS), it only duplicates other metrics.
- Onboarding when creating a PLUS test: Unified countdown display in Watchdog graphs.
- Onboarding when creating a PLUS test: Improved content for PLUS informational emails.
- Measurement error: Better documentation if we can't measure due to Network.getResponseBody
- Newsletter: Missing redirection and UTM parameters for team names.
- Onboarding when creating a PLUS test: Now there's an option to book a demo
- Graphs: Graph naming now changes when switching domains.
- PLUS settings: Add extra charges to UI and Help.
- Technical Report: Whole numbers in the graph of blocking JS counts.
- UI: Modals now show which specific URL belongs to a named page.
- Graphs: We display even days where data is missing, just without data.
- UI: Gradually cleaning up “tooltip hell”.
- Forms post-measurement: Adding “https://” to make starting measurements easier.
Internal and Long-term Product Tasks
In addition to visible changes, we also put in a lot of work on various internal technical or product tasks in this release, such as:
- Adjusting visitor measurement and custom reporting.
- Transitioning the technical part from Basecamp to GitHub Projects.
- Internal notifications about tests that are not running.
- Preparation for translating the tool into English.
- Preparing the database for planned major changes and acceleration.
- Restructuring Help for easier work and translations.
- Accelerating the deployment of changes.
- Preparing for a one-time test.
In version 4.6, we also fixed about 20 bugs, some of which were reported by you (thank you!).
Have you found a bug or have an idea for improving our Monitoring PLUS? Write to us at info@pagespeed.cz.