“Watchdog” Report
Every day, Watchdog monitors the speed of your website's measured pages. If any key metric changes, the Speed Watchdog will alert you.
Unlike other tools, Watchdog does this without requiring your active involvement and without spamming you.
🔒 Watchdog is a feature of the paid PLUS tests.
Watchdog consists of three different parts:
- The “Watchdog” Report itself (this text)
- Watchdog Notifications
- Watchdog Status in the “Summary” Report
Parts of the “Watchdog” Report
The report itself can be found in every PLUS test under the “Watchdog” tab. It serves as the main dashboard for the entire functionality of monitoring and reporting website speed.
You can see its parts in the following image:
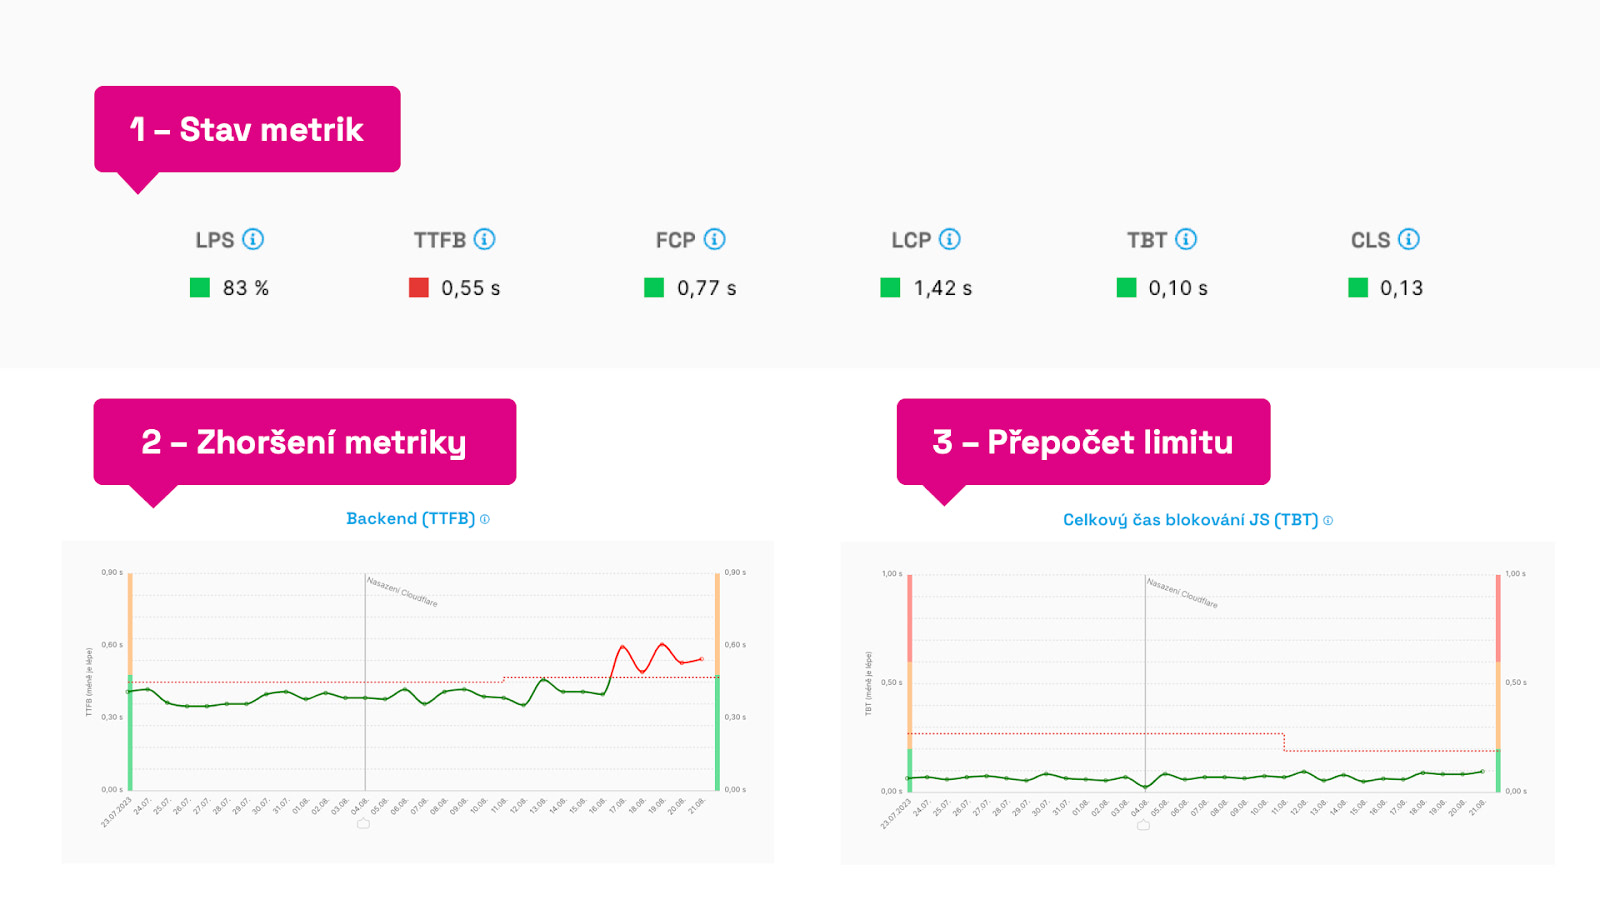 Different parts of the “Watchdog” report.
Let’s comment on each point:
- Metric Status – at the top in the “Watchdog status,” we see the monitored metrics and their current status. If they meet the set limits, they are green. “Broken” metrics are shown in red.
- Metric Deterioration – if you see a red line in the graphs for several days, it means the limit for this metric has been exceeded. We recommend paying attention to it. More on finding causes is below in this text.
- Limit Recalculation – the Metric Limit, represented by a dashed line in the graph, can automatically recalibrate if the metric shows a good state for several days, or if the metric shows a bad state that doesn't change. We aim to prevent further deterioration of already poor values, so we always monitor current values.
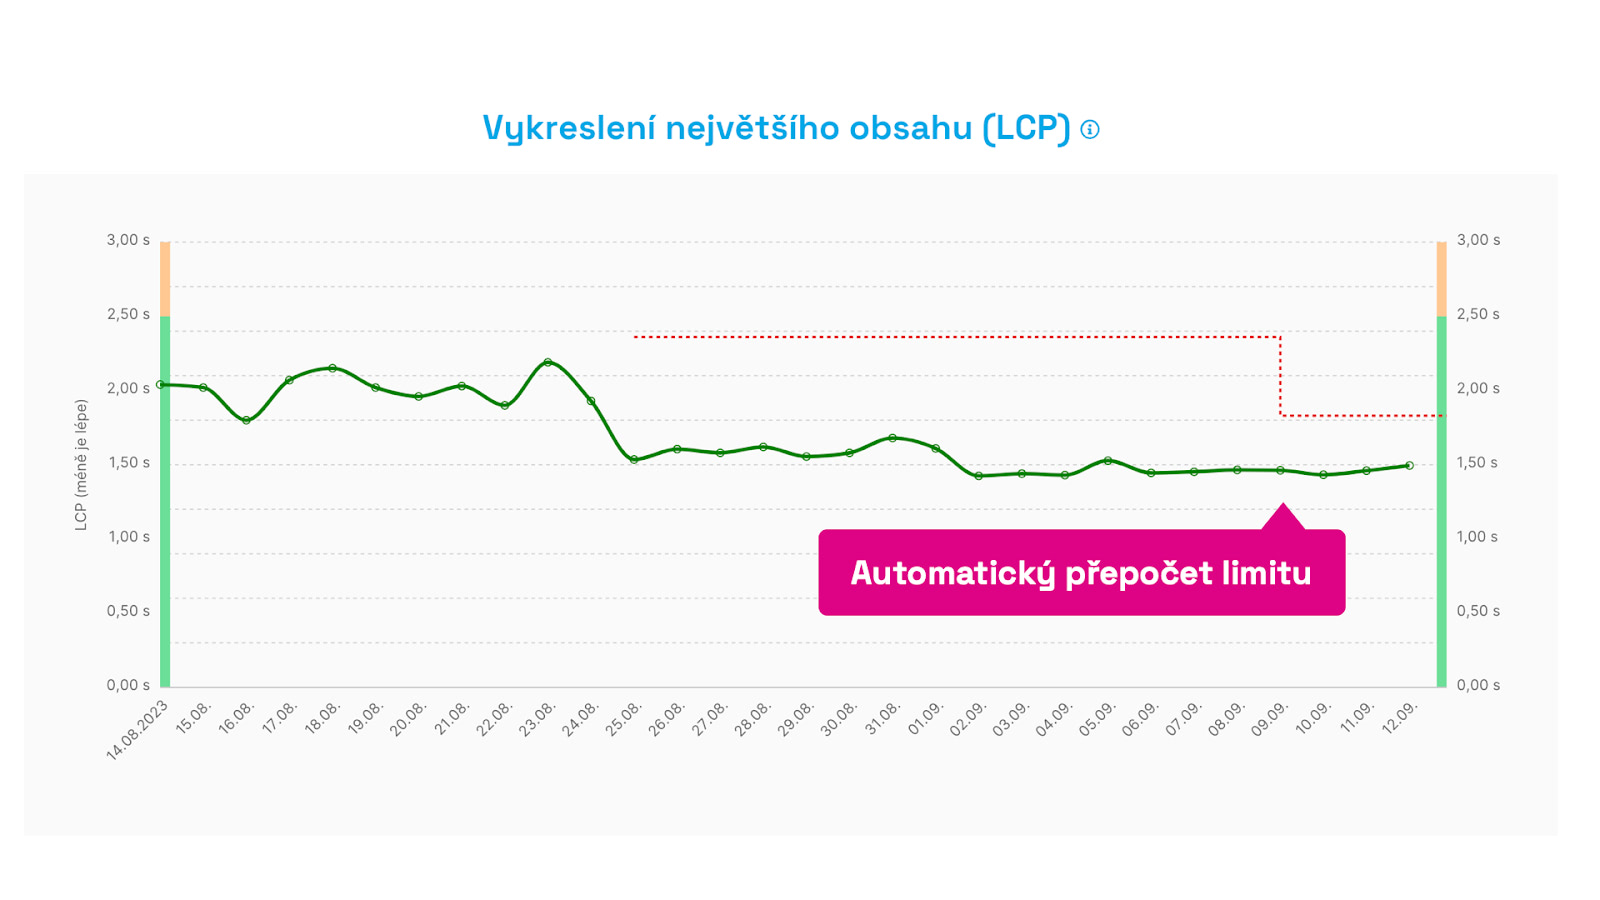 Automatic limit recalculation. After two weeks of improvement, we begin to monitor the new metric value automatically.
The key, then, is the speed limit, the metric value itself, and the timing. But let's delve deeper.
How Exactly Does Speed Monitoring Work?
Our goal was to have new data every day and to minimize spam with irrelevant alerts.
Measurement Method
Watchdog's numbers are measured using the Lighthouse tool, meaning synthetically. We take the median measurement of each URL and calculate the average from it. This has proven to be a sufficiently sensitive calculation for potential changes on critical URLs of the site.
Metrics
We selected the Web Vitals metrics, which can be measured synthetically (LCP, CLS), but we complement them with other auxiliary metrics like TTFB (backend speed) or TBT (total blocking time of JS).
Measurement Cycle
Speed monitoring takes place in ten-day cycles. If during these cycles the metric does not change above or below a certain value, the limit remains as set. If the value changes and lasts for more than three days, we will notify you and highlight it in the graph.
Watchdog Limit
In the graph, the limit is shown as a dashed line. The limit is always set above the metric threshold and does not have any optimal values, it always derives from the previous state. This allows us to effectively detect changes in metrics.
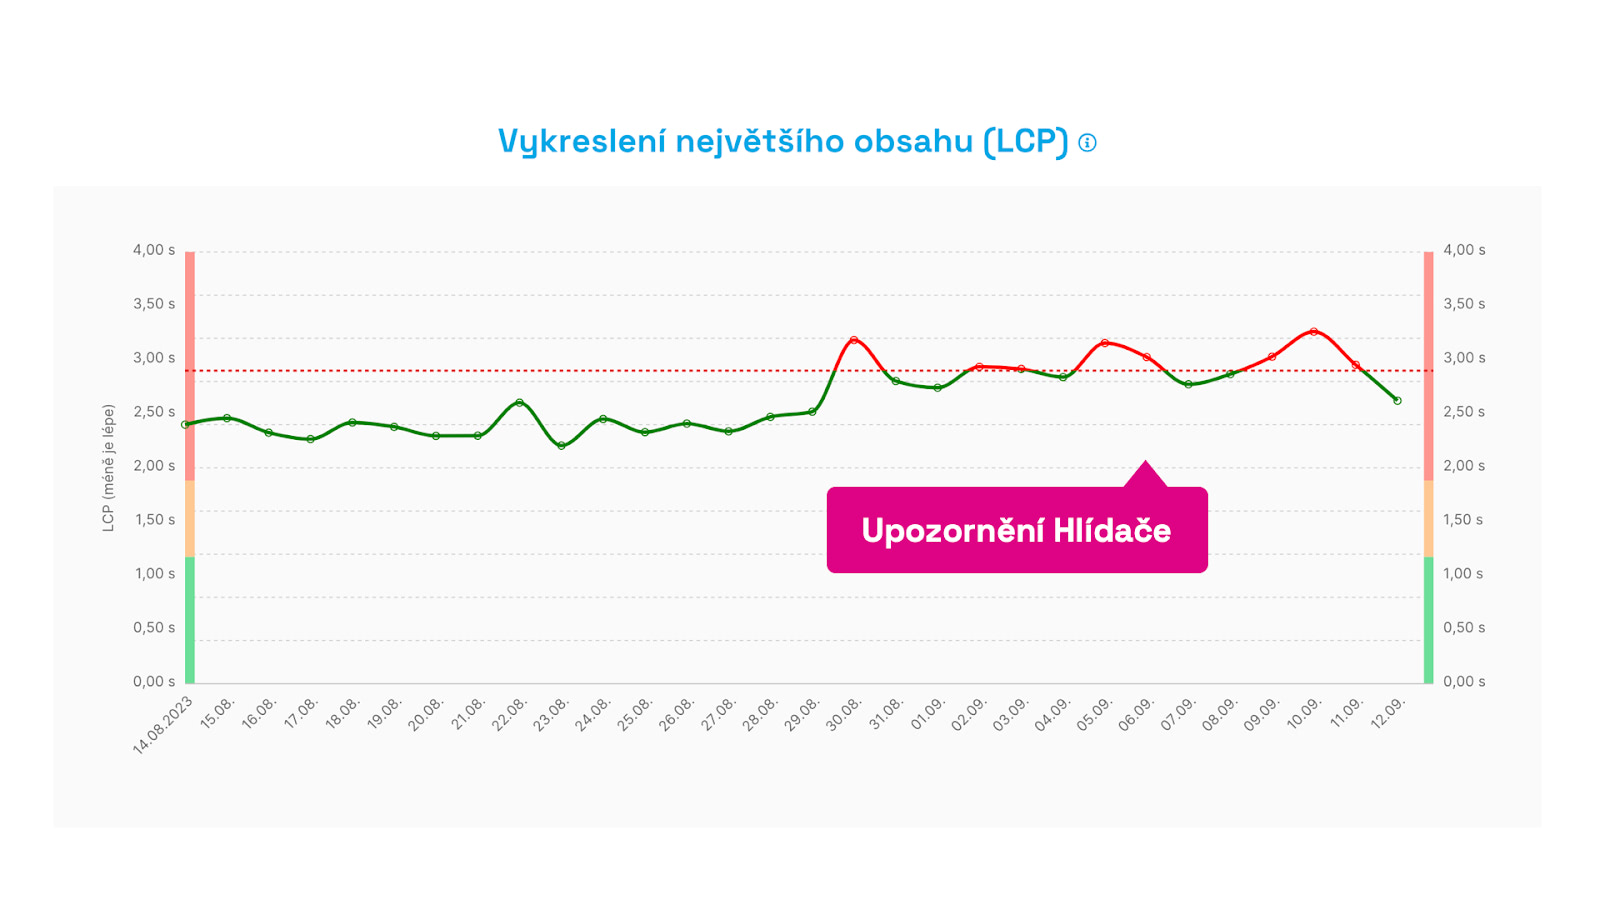 Something went wrong here. You will receive an alert when the metric limit is exceeded for the third consecutive day. This avoids unnecessary alerts when there is a one-time fluctuation.
Change Detection Sensitivity
It's worth knowing, after many iterations, we rejected detecting metric changes based on percentages.
For example, a 10% change in a low metric value does not have the same significance as a 10% change in a higher metric value. Changes in some metrics are more significant (let’s say LCP as part of Core Web Vitals), while others change very frequently (like TBT and other JavaScript metrics), so we have to set the limits less sensitively.
Therefore, in our algorithm, we use smart detections with specific values, where different metrics behave differently at various values. The main goal? To spam you as little as possible with insignificant changes.
What If I Change the URL in Settings?
Changing or adding a URL within the settings of the test will naturally alter the metric values due to the calculation method and likely trigger a report of improvement or deterioration in the metrics. Now, when a URL changes, a note is automatically added to the graph.
How Did We Design the “Watchdog”?
We developed the PageSpeed.ONE speed tester based on research of competing speed measurement tools, but primarily from years of experience tracking website speed for dozens of clients through our website speed consulting.
This feature is elsewhere referred to as Performance Budgets, but in our approach, it works slightly differently. We want our Speed Watchdog to…
- be easy to use even for performance novices,
- not burden users with excessive informational noise,
- function automatically without the need for ongoing adjustments,
- and be available across various communication channels.
Watchdog was created because no available tool adequately met our needs or those of our clients. How exactly does Watchdog differ from PageSpeed.ONE?
1) Sends Only Essential Messages
Notification emails from all existing monitoring tools will eventually overwhelm you. Only some contain relevant and important changes in website speed. We ourselves spend hours each week evaluating these notifications for clients. Most of the time, it's just a false alarm, a notification that didn’t need to be sent.
2) Focuses on Key Metrics
Traditionally used tools cling to older metrics like page load time (Load event) or invent their own metrics. But we have long had metrics that very well capture user experience. Yes, the tester focuses on Web Vitals metrics and auxiliary indicators.
Summary and Final Recommendations
“Watchdog” and monitoring “performance budgets” in general are fundamental to working on website speed.
If you don't have a data history of changes and their impact on speed, you will find yourself facing deteriorations and only expensively searching for causes.
How to work with the Speed Watchdog?
- Get our PLUS tests.
- Add important type URLs to the test settings.
- Add your preferred channel for alerts in Settings.
- Monitor Watchdog status on the web, via email, in Slack, or Teams.
- In case of a change, monitor data movement from Google (CrUX), for example in the Domains report. It may happen that synthetic measurements from Watchdog are more sensitive than necessary. Changes in CrUX are always crucial.
- If you see significant changes and new features have been deployed, add a note to the graph.
- Use Pages or Technical reports to find causes of other changes.
Also, see how to evaluate Watchdog alerts.