Chrome UX Report: Real User Speed Data from Google
The Chrome UX Report (CrUX) is a public dataset from Google that collects and anonymously analyzes real user experience data when browsing the web with the Chrome browser.
 Chrome UX Report logo by Google.
CrUX focuses on key metrics such as loading speed, interactivity, and content stability, thus offering valuable insights into how websites perform under real-world conditions. CrUX data is distinct from RUM or synthetic measurements.
Besides the fundamental Core Web Vitals metrics (LCP, INP, CLS), CrUX now also provides extended data, newly included in our Domain Report monitoring. These insights reveal how your site behaves in real conditions — such as user distribution by device, different page load methods, or details on what slows down images for LCP.
Why is it important and where is it used?
CrUX is a critical resource for developers, SEO experts, and digital marketers because it provides data from real users. In our experience, speed impacts the following areas:
- SEO: Google includes Core Web Vitals in its website ranking criteria. Better performance can lead to higher search rankings.
- PPC Campaigns Ratings: Website speed affects bounce rates and the overall effectiveness of PPC campaigns. It can also influence ad costs in Google Ads.
- Speed Measurement: CrUX offers real data on page loading speeds, allowing developers to enhance user experiences. By analyzing this data and optimizing accordingly, you can speed up your site, leading to higher user satisfaction. You can also easily compare your site against competitors.
There are many more general arguments and reasons, which we detail in a separate text Why Page Speed?.
How is it measured?
CrUX gathers data directly from the Chrome browser from users who haven't opted out of data sharing.
Google collects data separately for mobiles, tablets, and desktops. CrUX includes information on the Core Web Vitals metrics, which are:
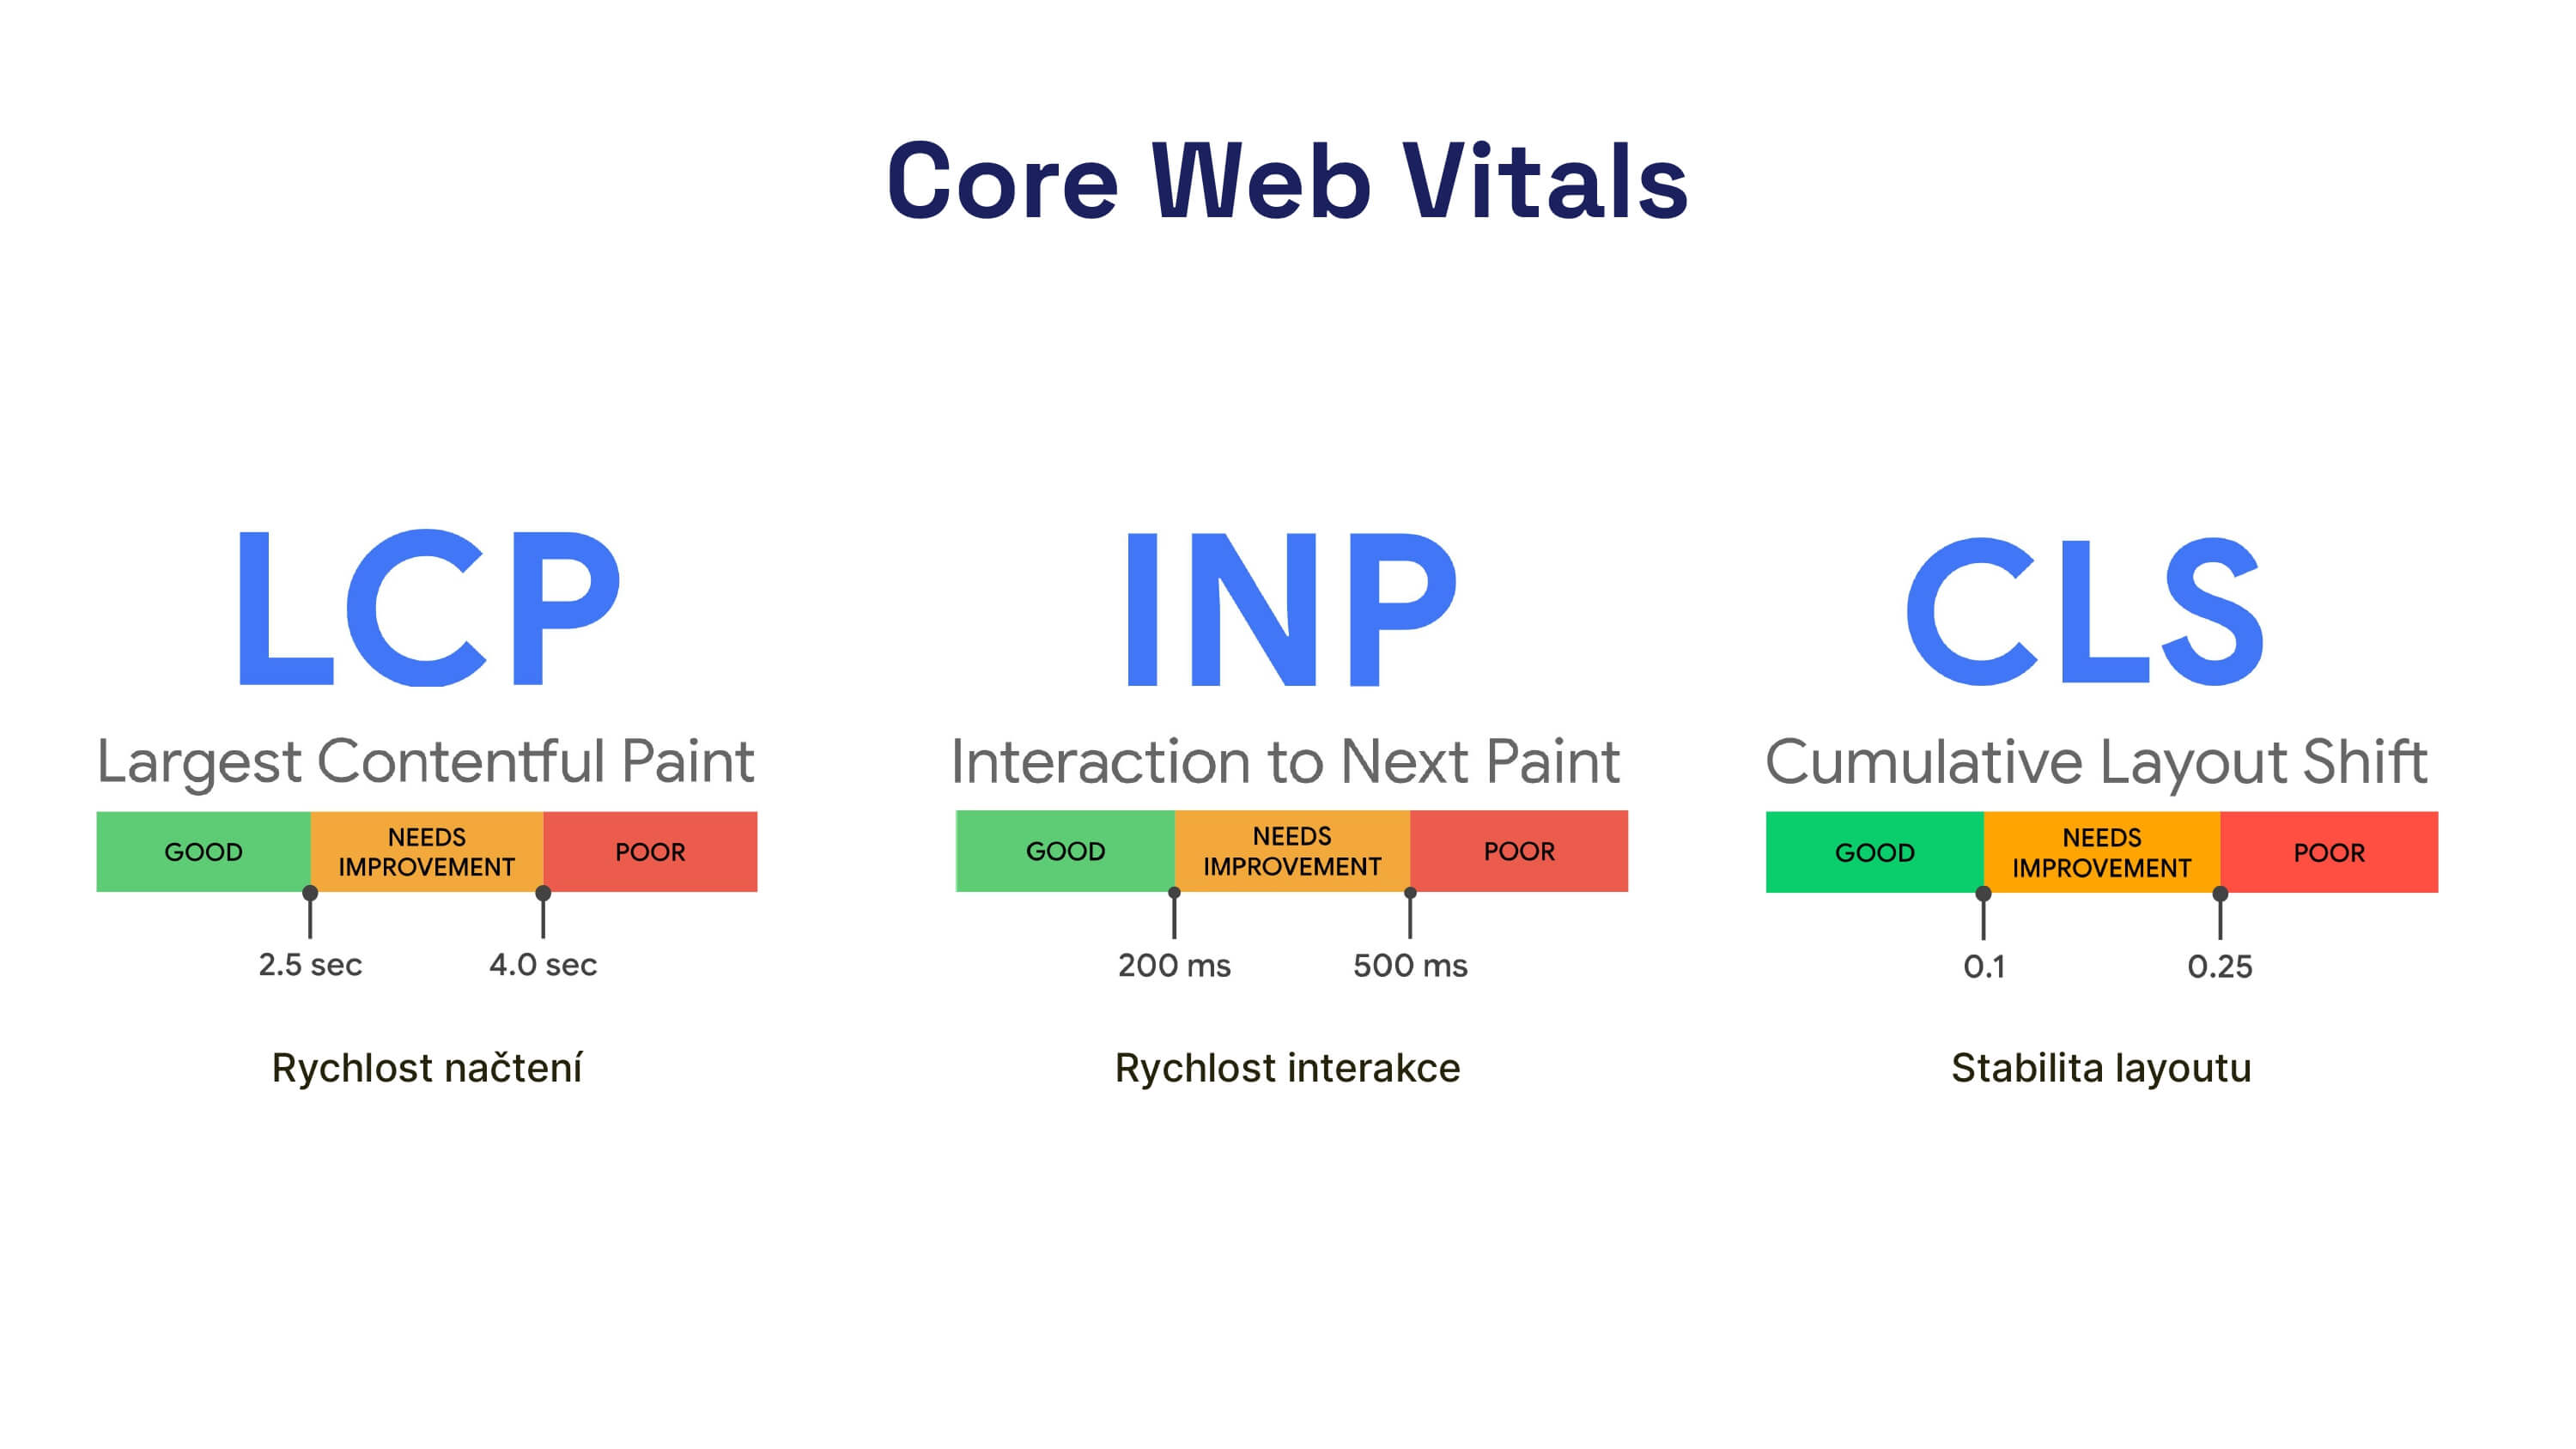 Core Web Vitals: the most fundamental of all web speed metrics.
In addition to these metrics, CrUX provides data on other metrics and events, specifically:
- First Paint (FP)
- First Contentful Paint (FCP)
- DOM Content Loaded
- Onload
There are also experimental values for metrics:
- Backend response speed (TTFB)
- Popularity
- Notification Permission
- Roundtrip time (RTT)
We must also remember navigation types that help us understand how users access and behave on our websites.
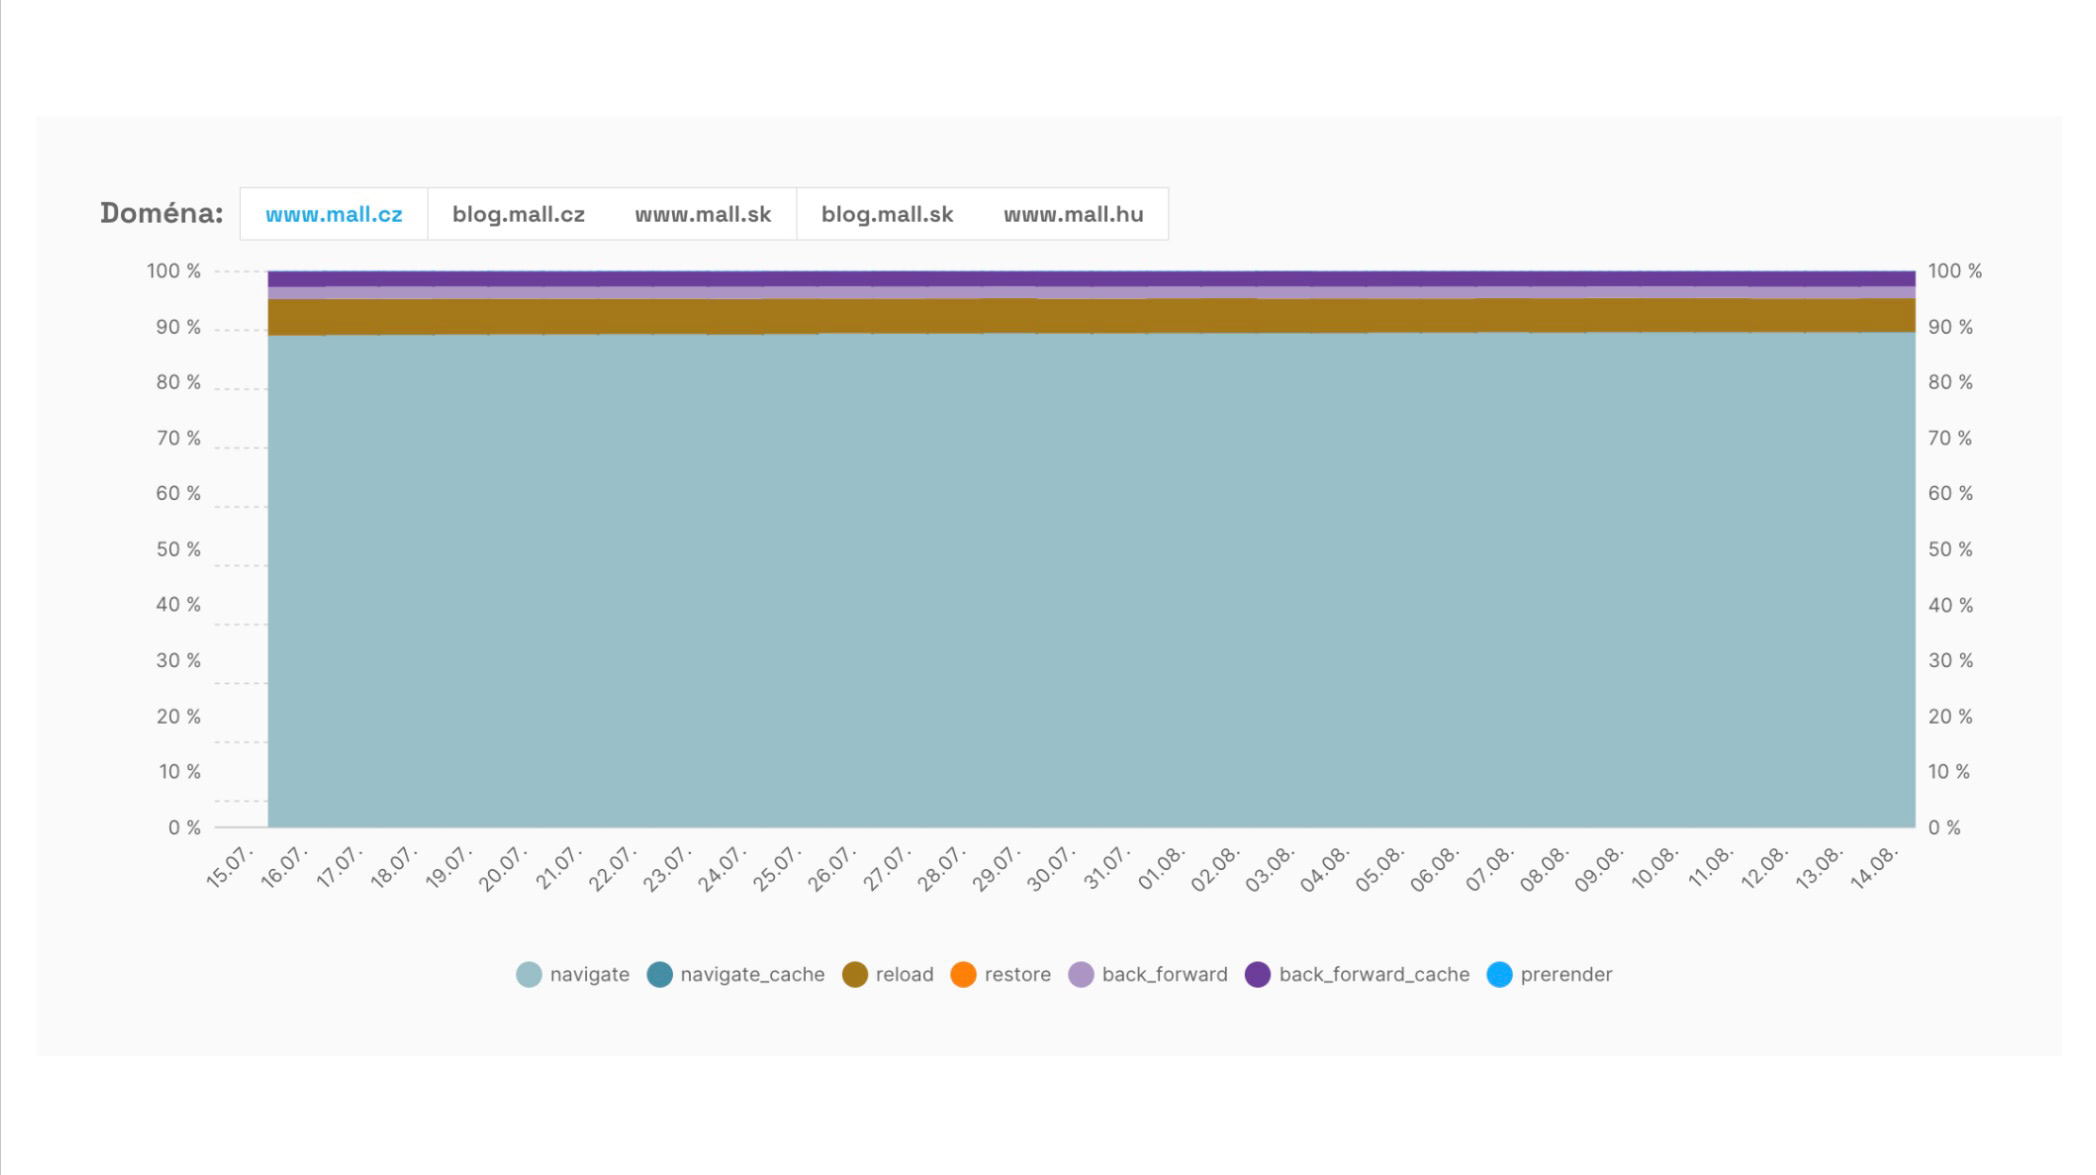 The evolution of navigation types allows us to see the share of fast or instant navigations like BFcache or prerender (using Speculation Rules).
The data is aggregated at the page and domain levels and also includes additional information about connection speed, region, etc.
Domains and URLs must have sufficient traffic for CrUX data to appear. Based on our consulting practice, we estimate that you need around 10,000 to 15,000 page views per month for an entire domain or page.
Where can you find CrUX data?
Google provides numerous tools for working with CrUX. Each accesses the data differently, which can affect metric support or data freshness.
- Google BigQuery – The public CrUX dataset allows for advanced analysis using database queries.
- PageSpeed Insights – Enables one-off speed tests and provides CrUX data. It includes cumulative page and domain analyses for the last 28 days.
- Google Search Console – Displays reports based on CrUX data, particularly highlighting URL groups with problematic Core Web Vitals metrics.
- Monitoring PageSpeed.ONE – Our tool uses advanced CrUX data display via the CrUX API. It features a view of metric history for Core Web Vitals for domains, specific URLs, navigation distribution graphs, and much more.
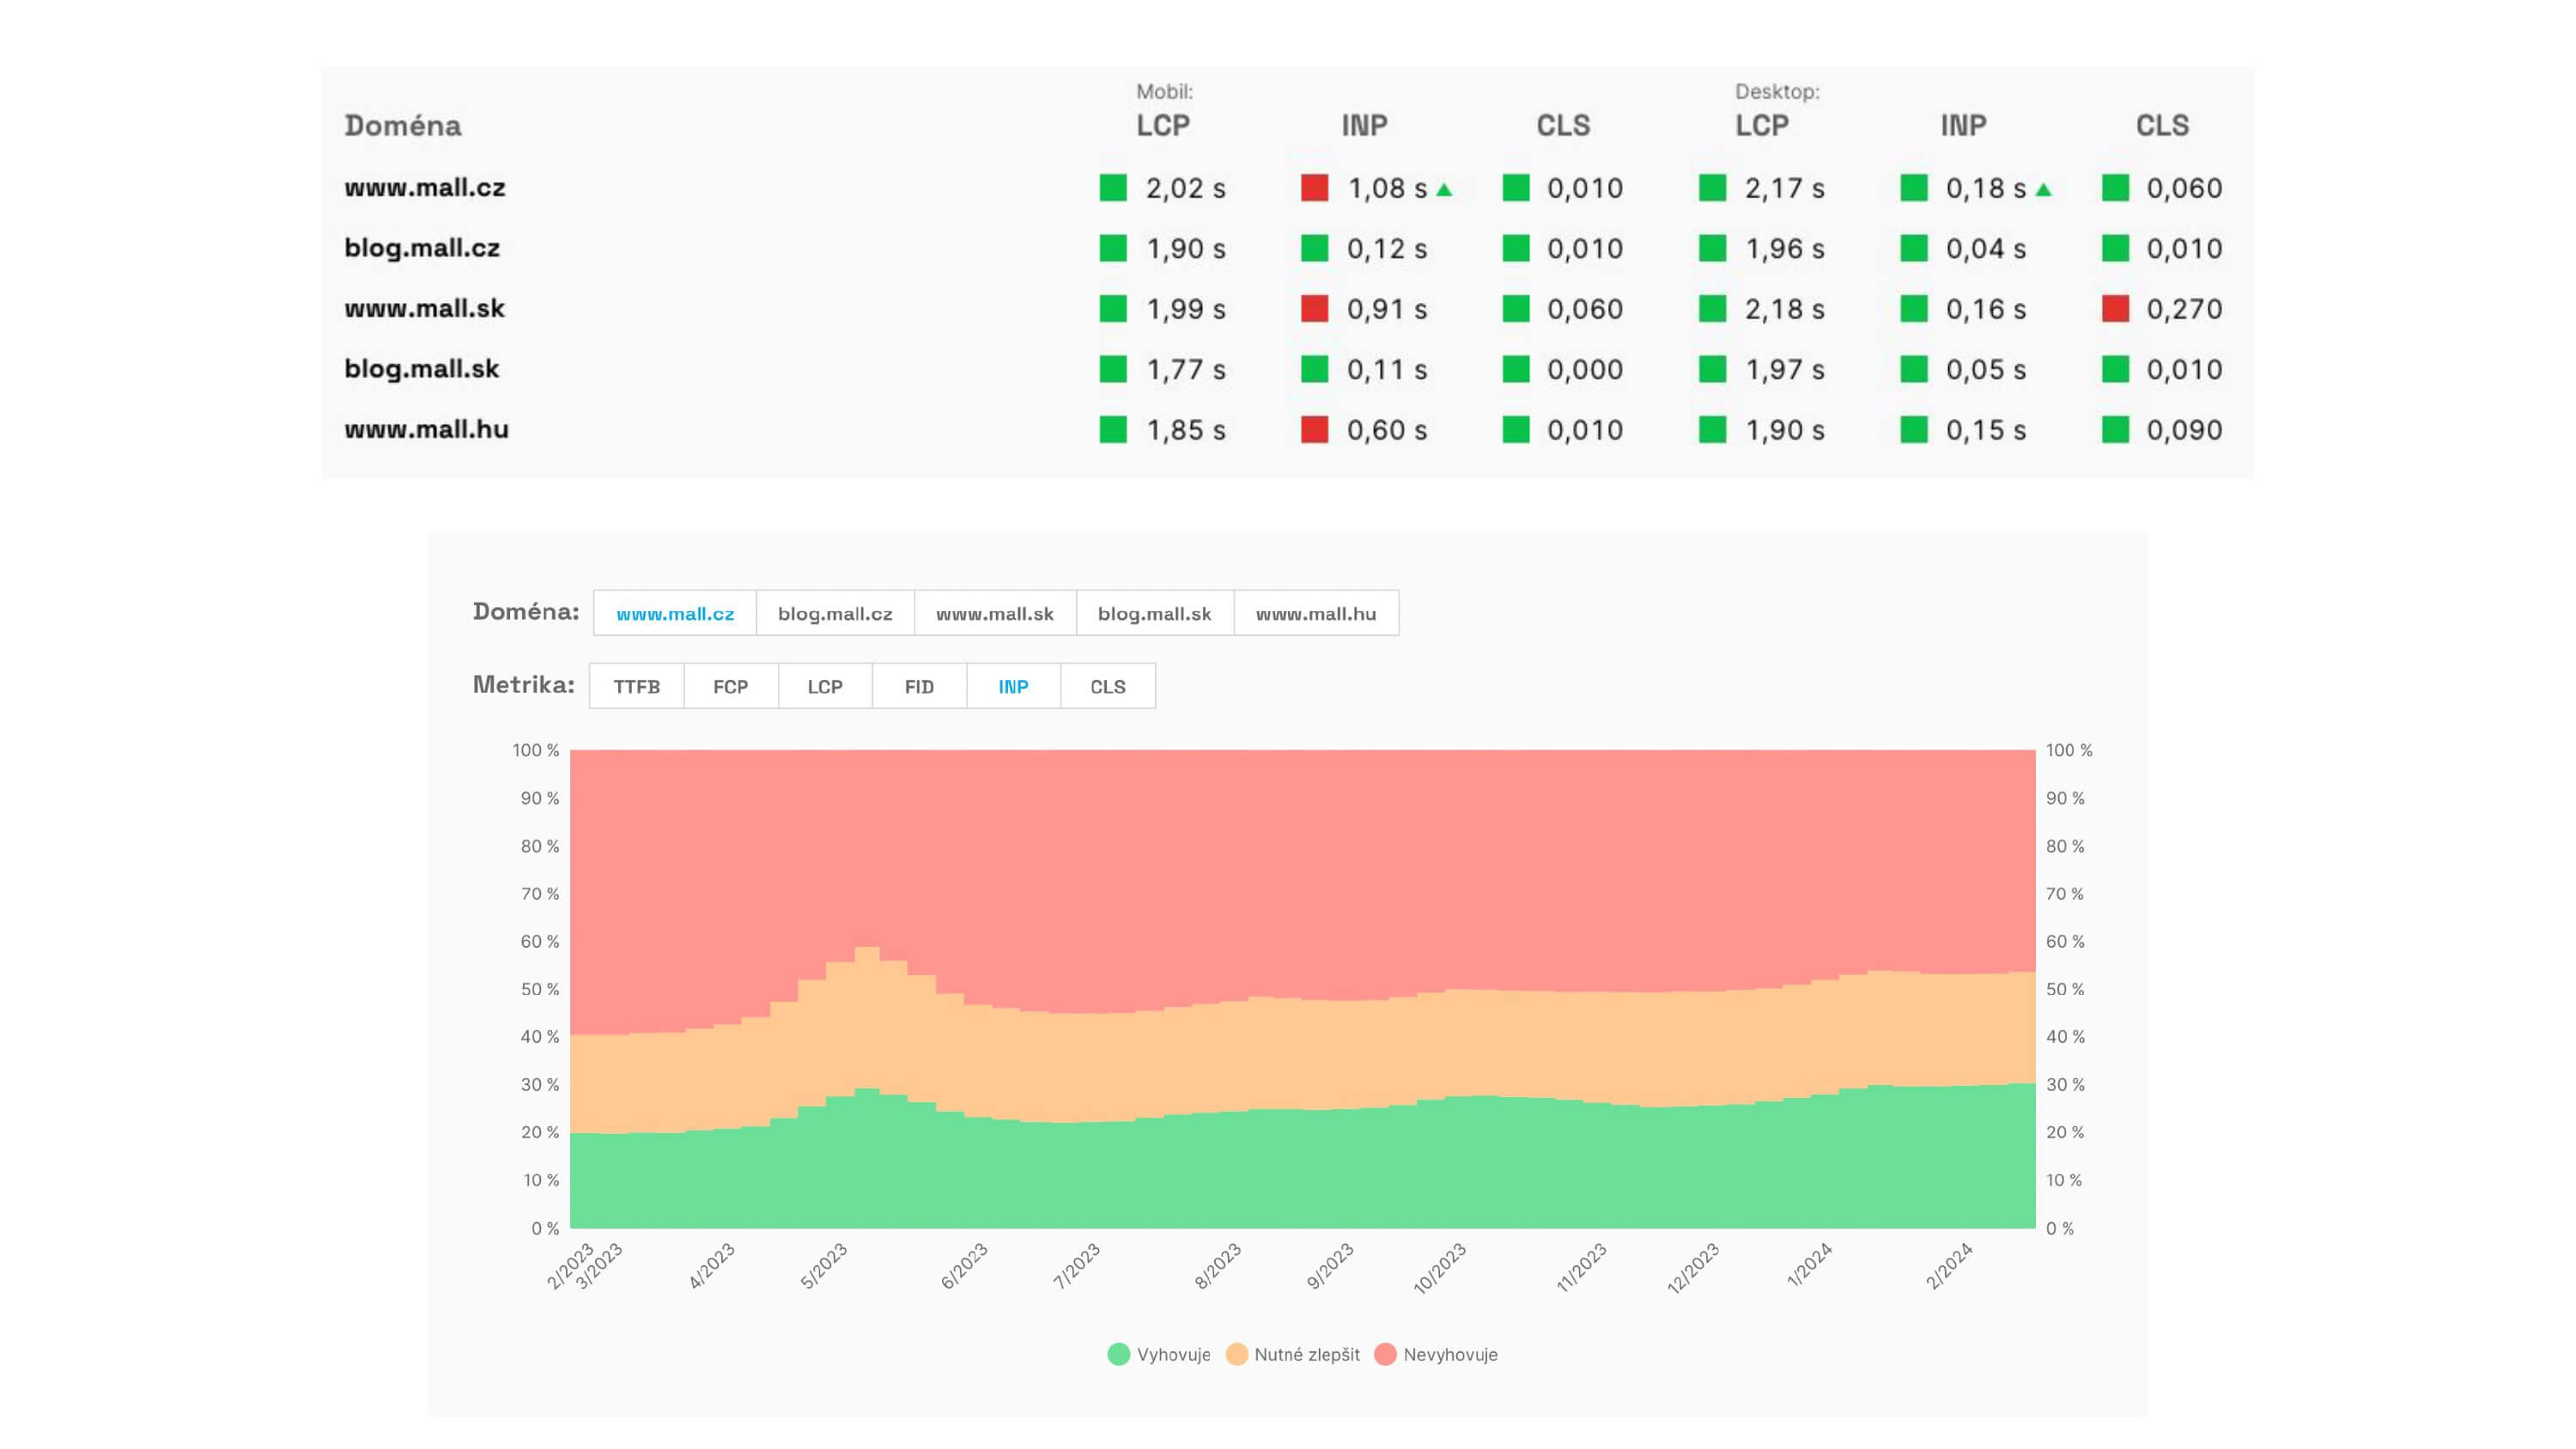 CrUX data reports from PLUS monitoring by PageSpeed.ONE show metrics status in the dashboard and value development on domains.
More information on the Chrome UX Report can also be found in the official documentation.
How do we use CrUX data in PageSpeed.ONE monitoring?
Tracking CrUX data is crucial for all websites that have this data. In our Domain Report, you will find, among other things:
- Core Web Vitals metrics (LCP, INP, CLS),
- other speed metrics (FCP, TTFB, RTT),
- user distribution by device type (mobile, tablet, desktop),
- page load methods distribution (navigate, reload, bfcache, prerender…),
- LCP element source type (image vs. text),
- reasons for image delays that are LCP elements,
- the development of this data by day and month
Together, this information creates a picture of how your users truly experience website speed — and where you have room for improvement.