UX Day 2026: Presentation Materials “Speed: The Invisible Aspect of Web UX”

Speed isn't just a technical detail. It's a feeling that determines trust, purchase completion, and overall user satisfaction.
At UX Day 2026, I spoke about how performance influences UX and business, how to measure this impact, and where teams most frequently hit a snag in practice. Below you'll find a summary, embedded slides, and the same checklist of links I presented live.
Every 100 ms acceleration of your site can bring you…
- +5.2% in page views per session
- +8.4% in conversion rate
- +9.2% in average order value
…as stated by Deloitte Digital. And we witness similar variations with PageSpeed.ONE clients.
What did I cover in a nutshell? Speed must be measurable at your end, with users, and over time; Search Console provides Google's perspective; for specific businesses, data analysis helps; a long-term performance culture and clear roles maintain it. Details and links are in the checklist.
Presentation from the Lecture
Lecture Checklist: Start with Web Speed
1) Your site with you? → Chrome Extension “Core Web Vitals Live”
I demonstrated an extension where you can see your site's performance directly in the browser in real-time. It measures LCP, INP, and CLS, displaying them with visual overlays directly on the page.
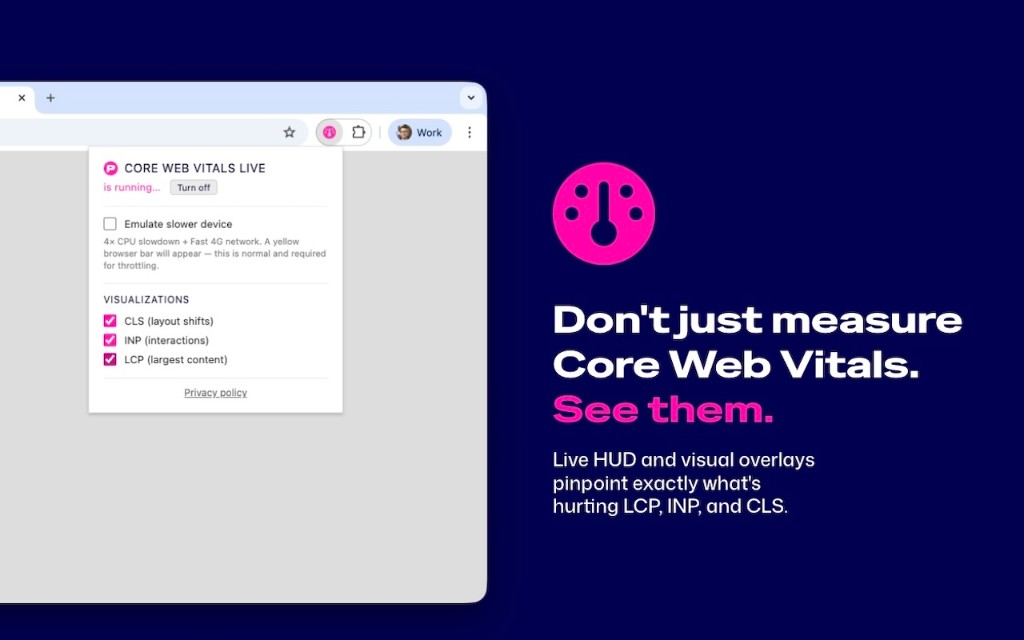
Live indicator and visual overlays show what specifically harms LCP, INP, and CLS.
2) Your site with users? Test it
The first step is to get a real picture of how the website performs under typical conditions. A one-time lab test isn't enough. You need data from various devices, ideally from the Chrome UX Report, and context for the metrics.
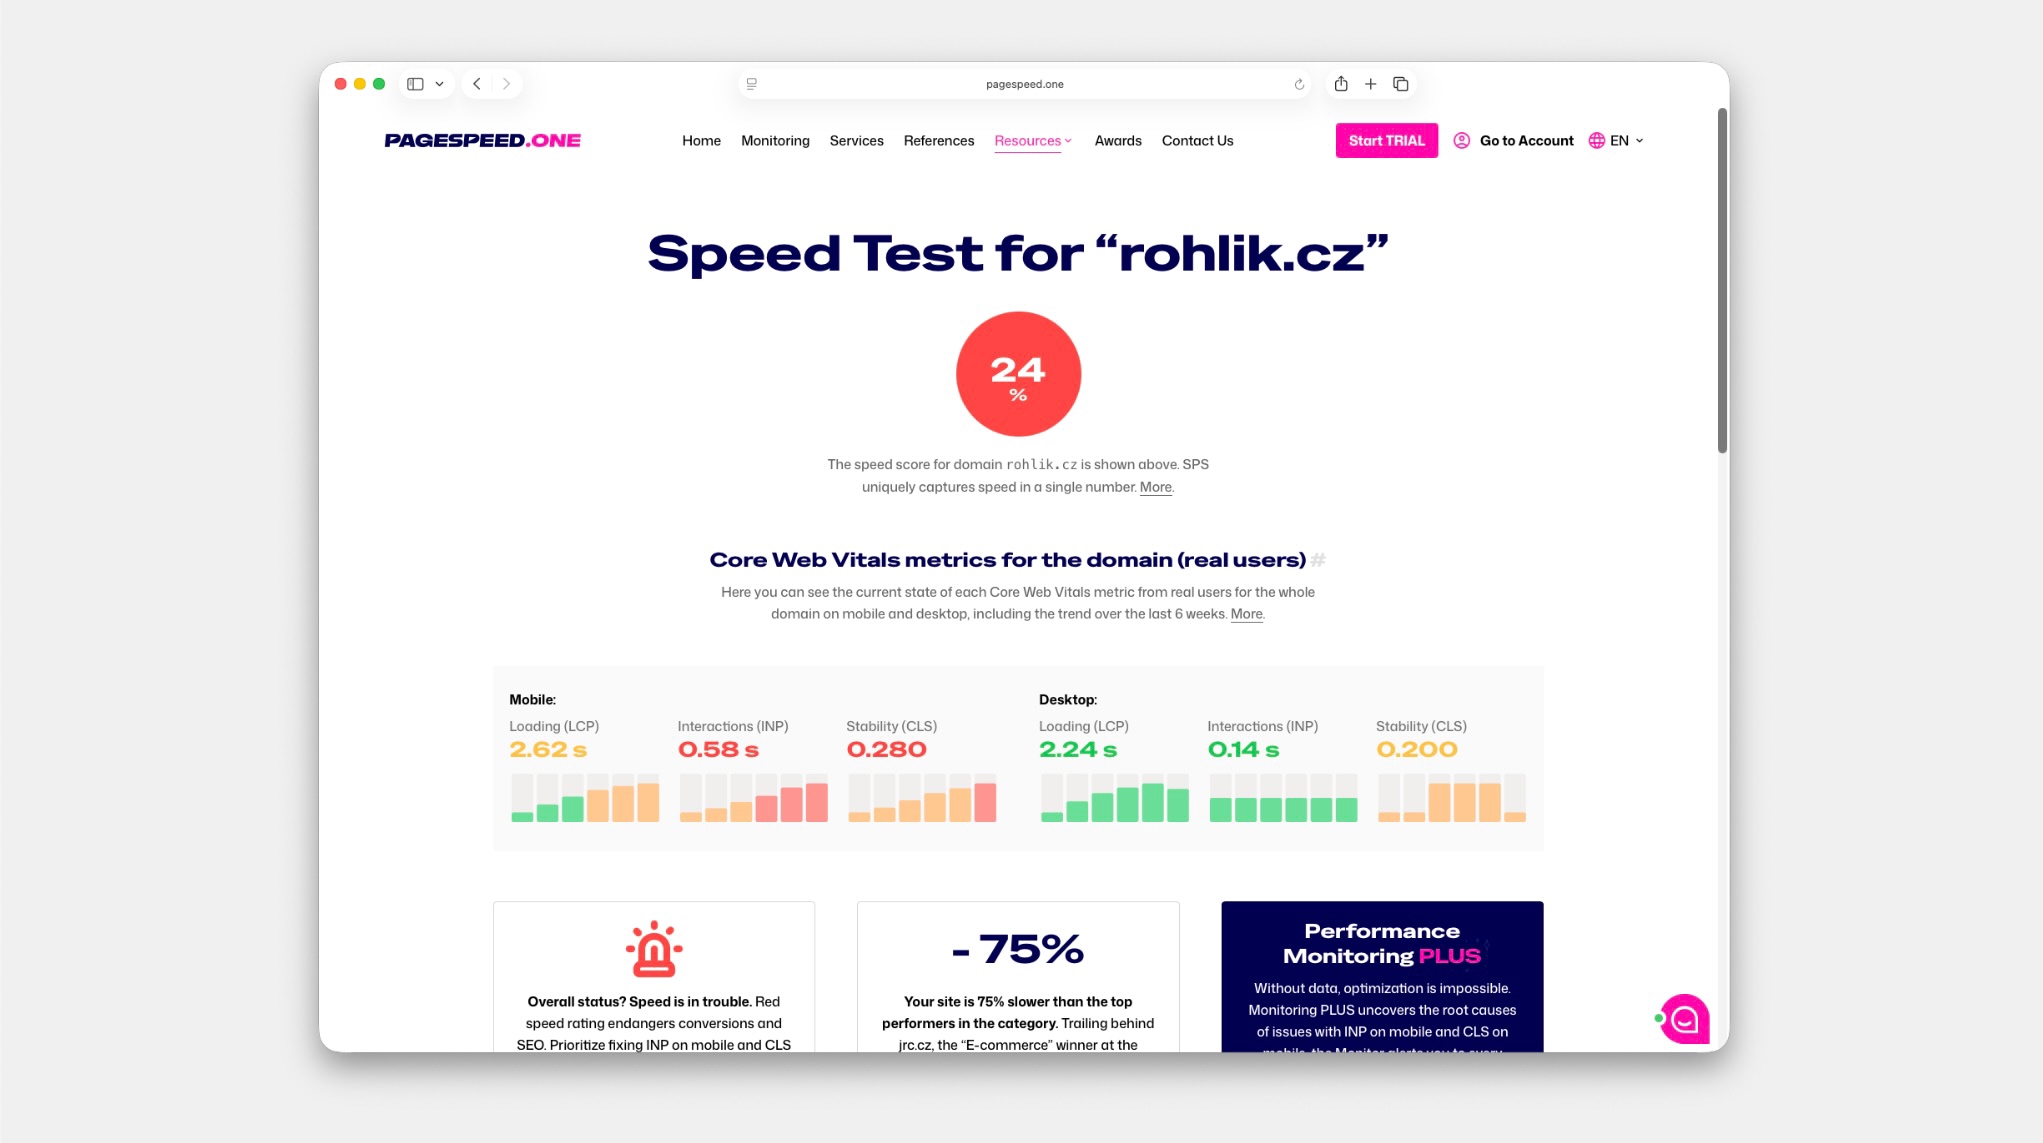
Real-world operational data (CrUX) and Core Web Vitals in context – not just a one-time lab test.
3) Your site over time? Enable monitoring
The quality of a website changes weekly due to release cycles, campaigns, and third-party interventions. Therefore, it's crucial not only to monitor the current state but also the trend over time. Monitoring helps detect regression the moment it occurs, providing the team with data for prioritization.
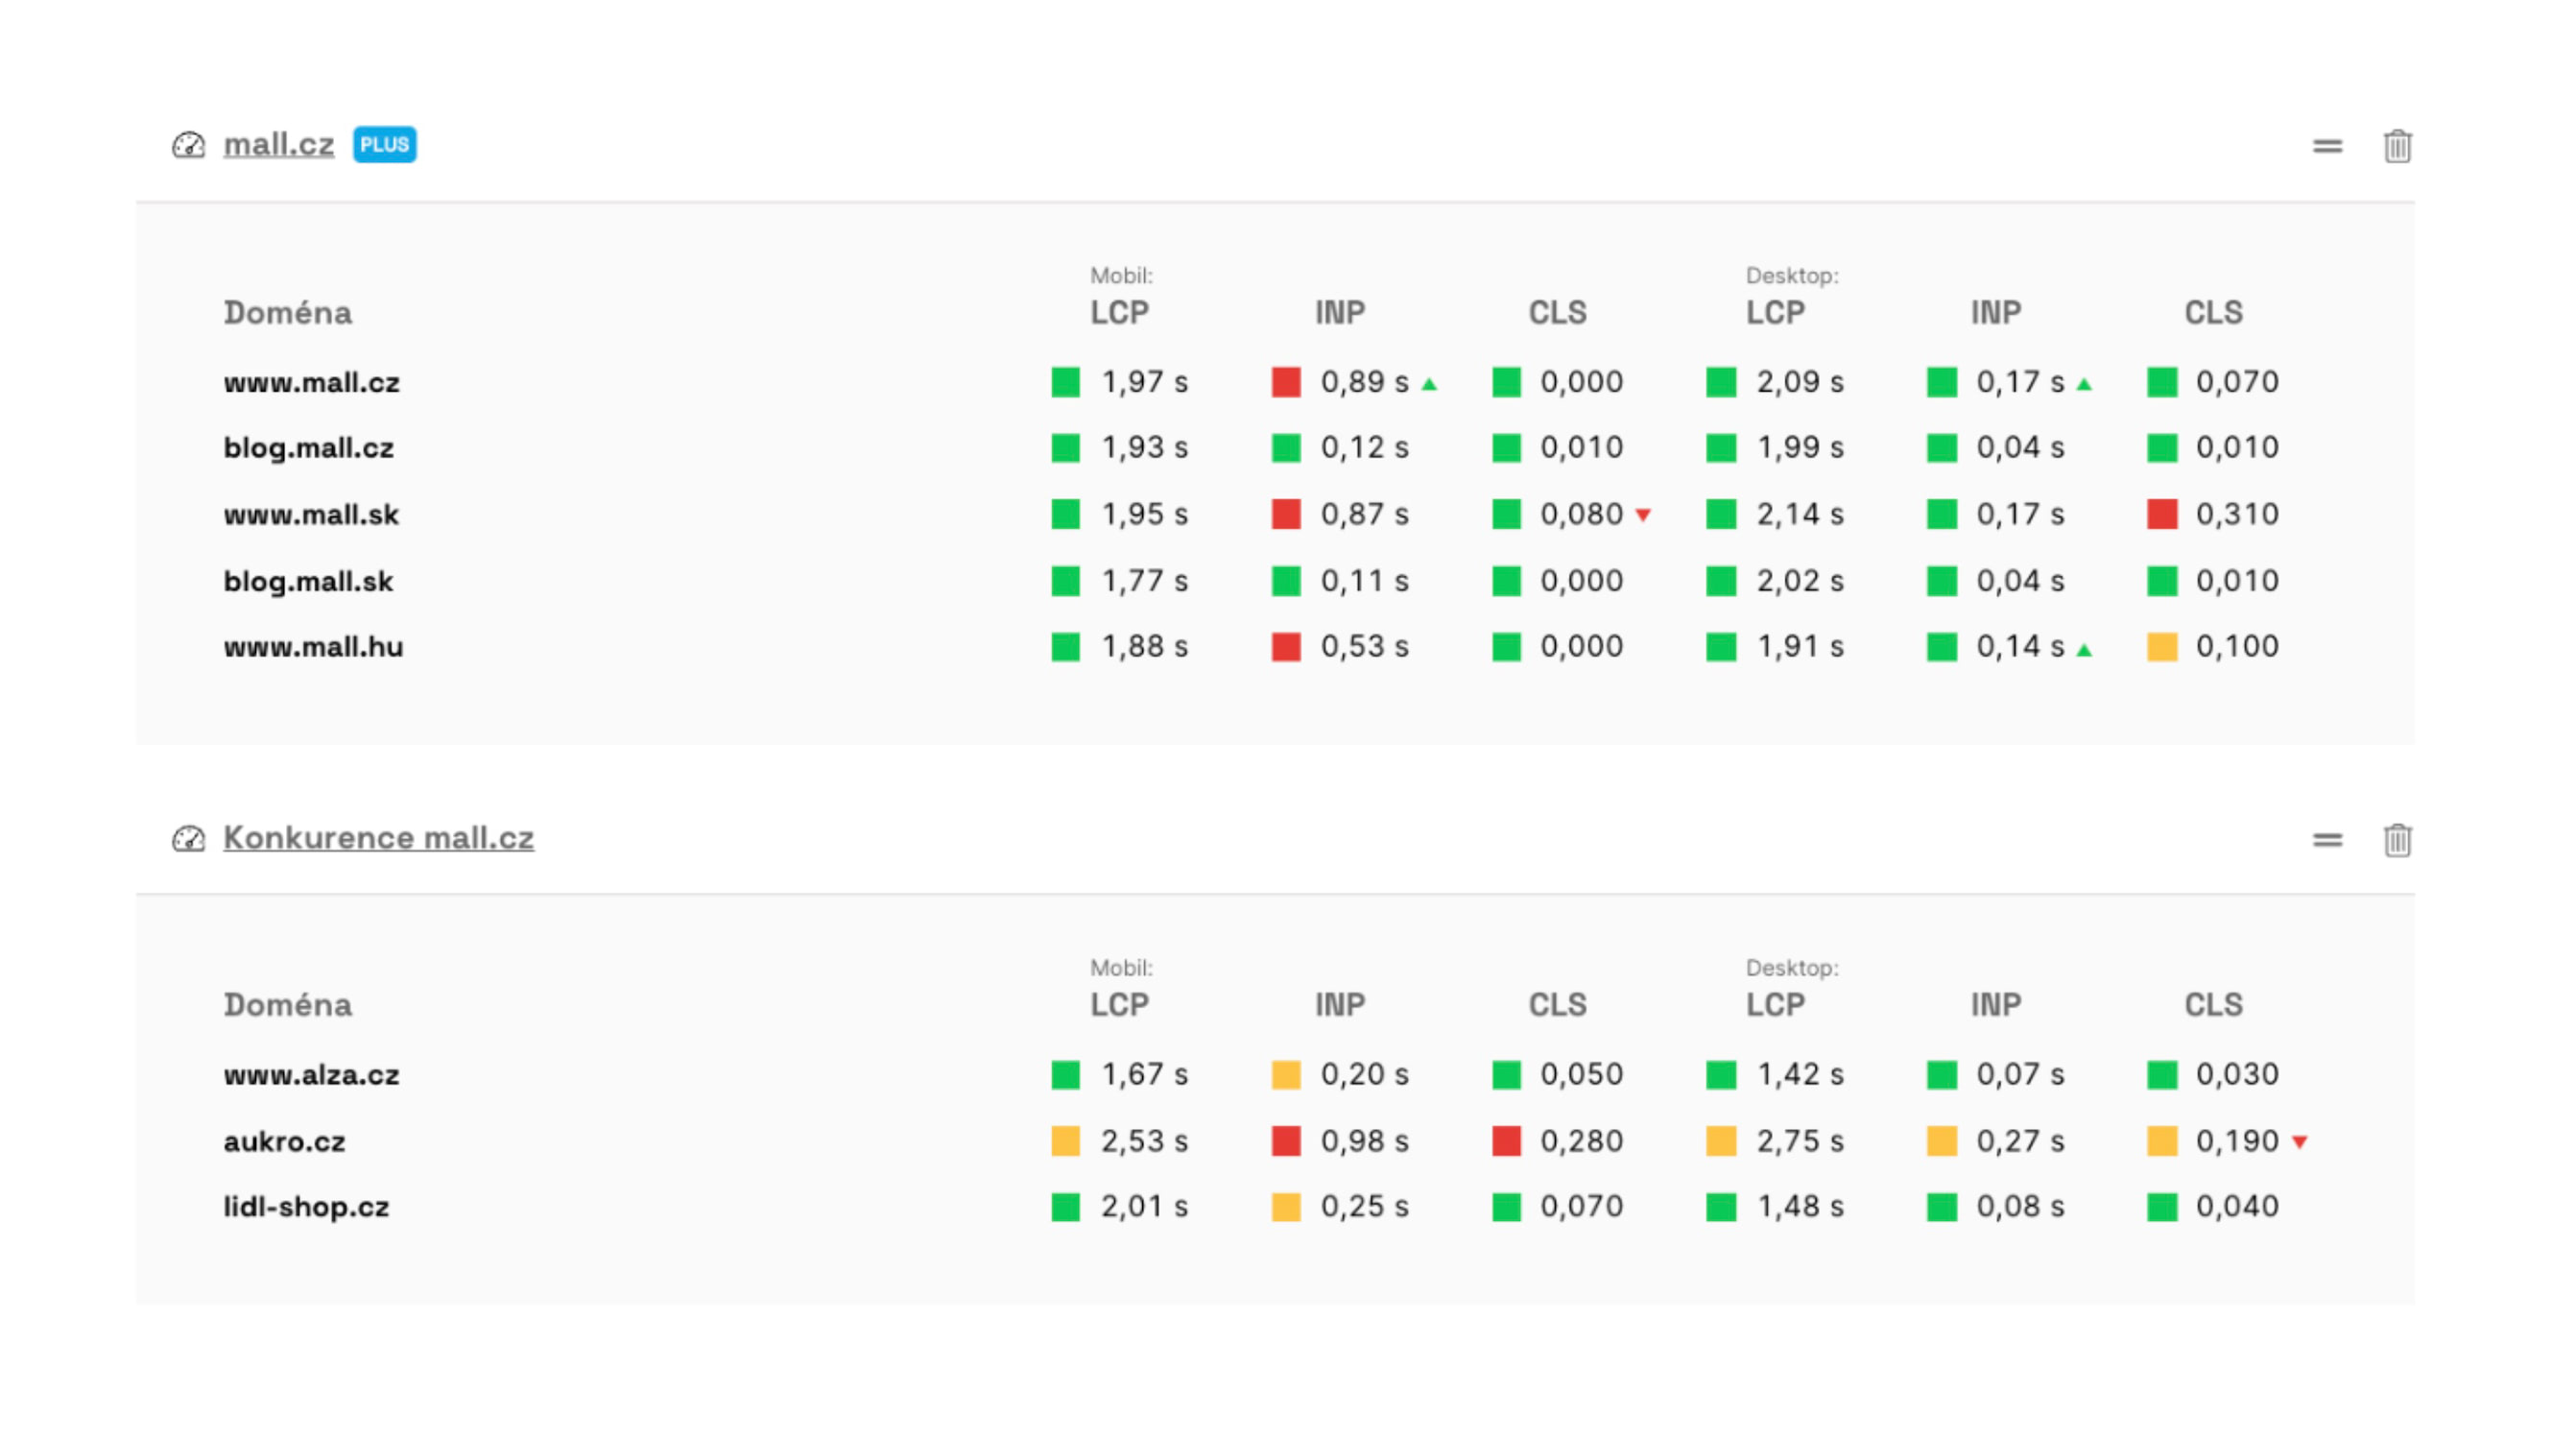
Monitoring helps you track metric evolution over time and quickly spot deterioration after releases.
4) Your site with Google? Search Console
Speed is also critical for visibility in search. Search Console shows how Google reads the quality of user experience, where there are Core Web Vitals issues, and which types of pages need addressing first.
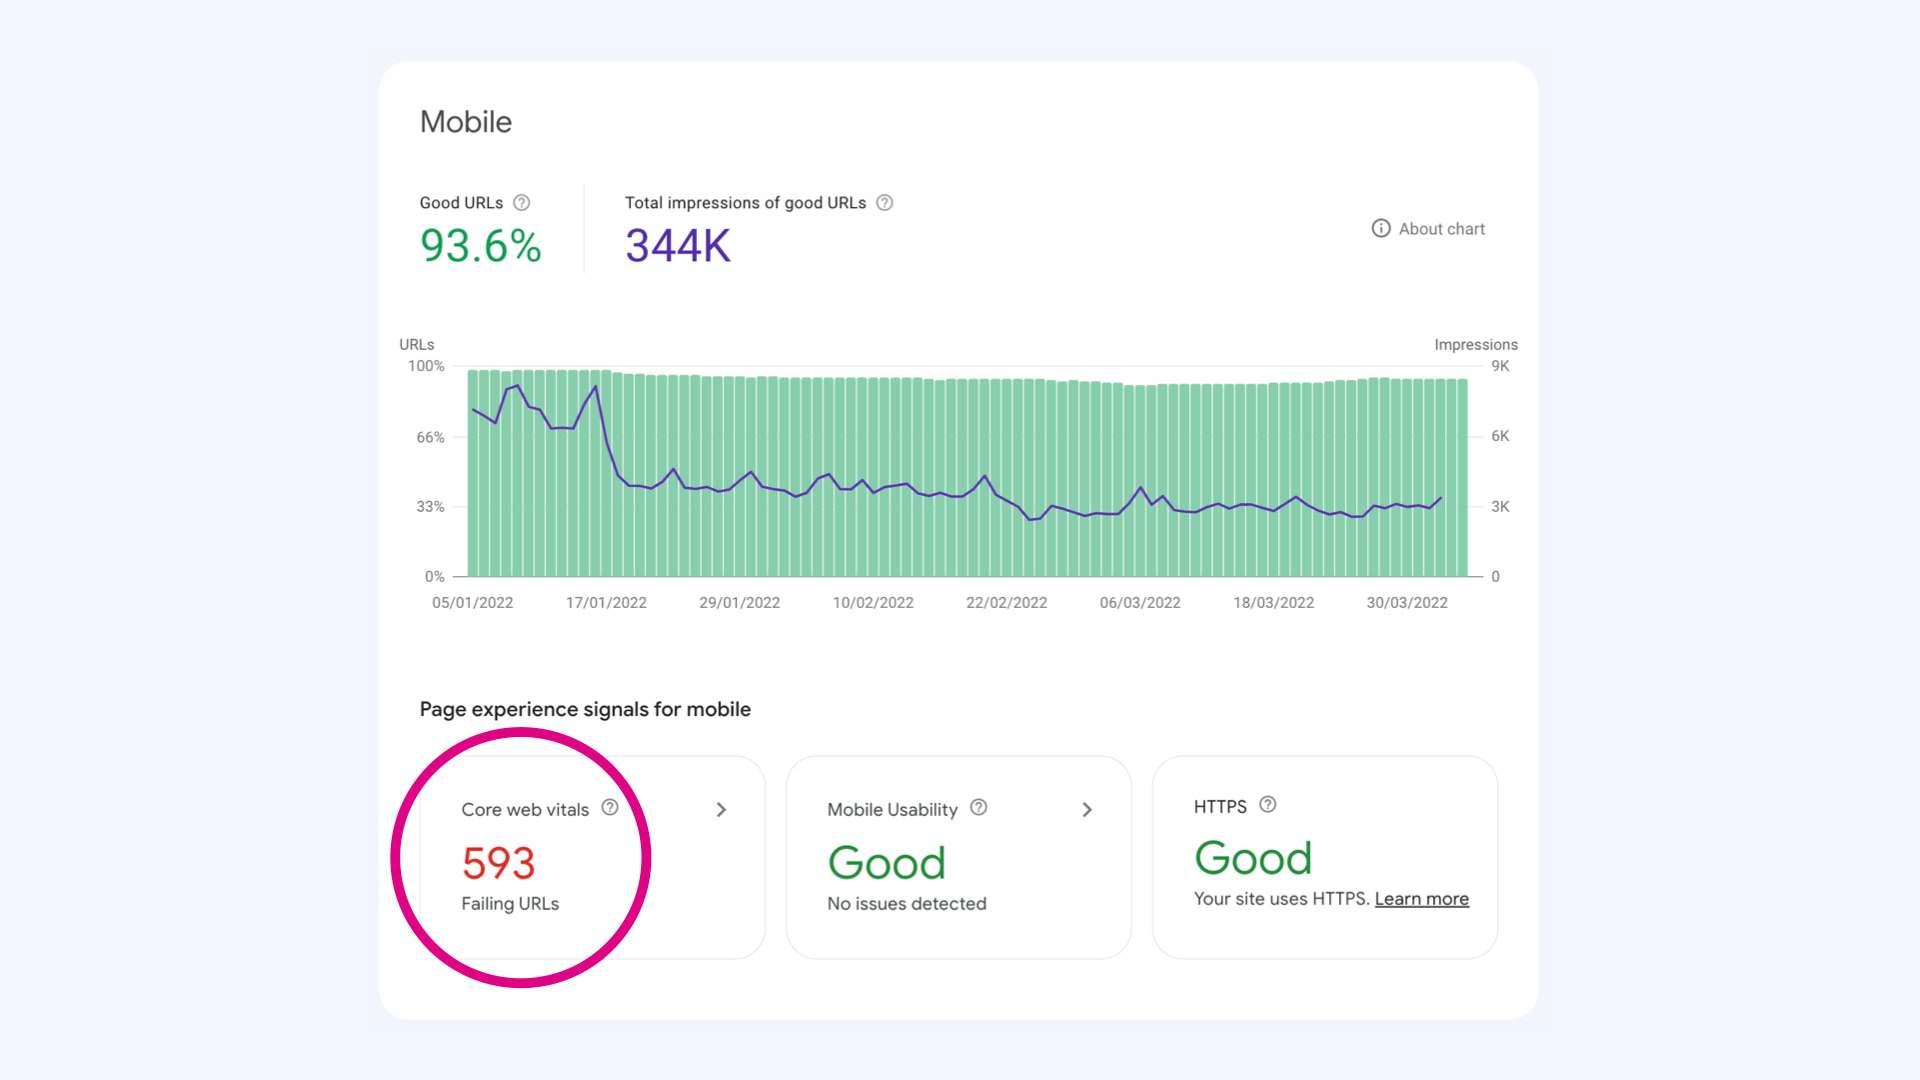
Search Console quickly indicates where you have problematic URLs or groups of pages from Google's perspective.
5) Discover the Impact of Speed on Your Site
For most teams, the crucial question is how speed specifically affects conversions and revenue on their site. We conduct business analysis based on data, pairing speed metrics with business results to identify areas with the greatest impact.
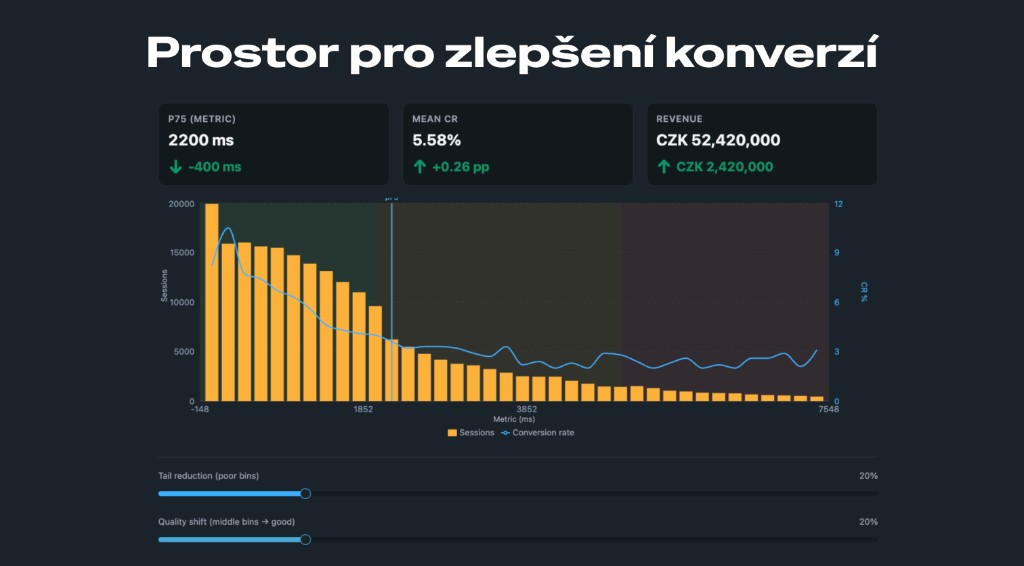
An example output from a business analysis of the impact of speed on conversions. The graph combines visit distribution by speed and conversion rate, showing where there's room for the greatest revenue growth.
6) Speed as a Theme: Roles, Education, Prioritization
Speed works long-term only when there's a clear owner in the team, a common language between product, marketing, and development, and continuous priority management. One-off acceleration isn't enough. The aim is to create a process that monitors performance with every website change.
Bonus: How to Speed Up Your Site, Checklist
Thanks to TUESDAY Business Network and everyone who prepared UX Day – it was a pleasant meeting, and I hope someone takes away a concrete step towards a faster website.
If you don't want to miss upcoming events, tool news, or articles, sign up for the newsletter. And if you want to measure or monitor web speed in practice, start at PageSpeed.ONE.
How Fast Is Your Website?
How does your website speed compare to your competitors? Find out using our online tester.