Performance Budgets
Performance budgets are a methodology used to maintain web page speed at a predefined level. Think of a budget as a limit of values for various metrics.
Tools that monitor these speed limits alert us to potential issues when they are exceeded. This helps teams maintain the desired speed level even as new content is added or features are changed.
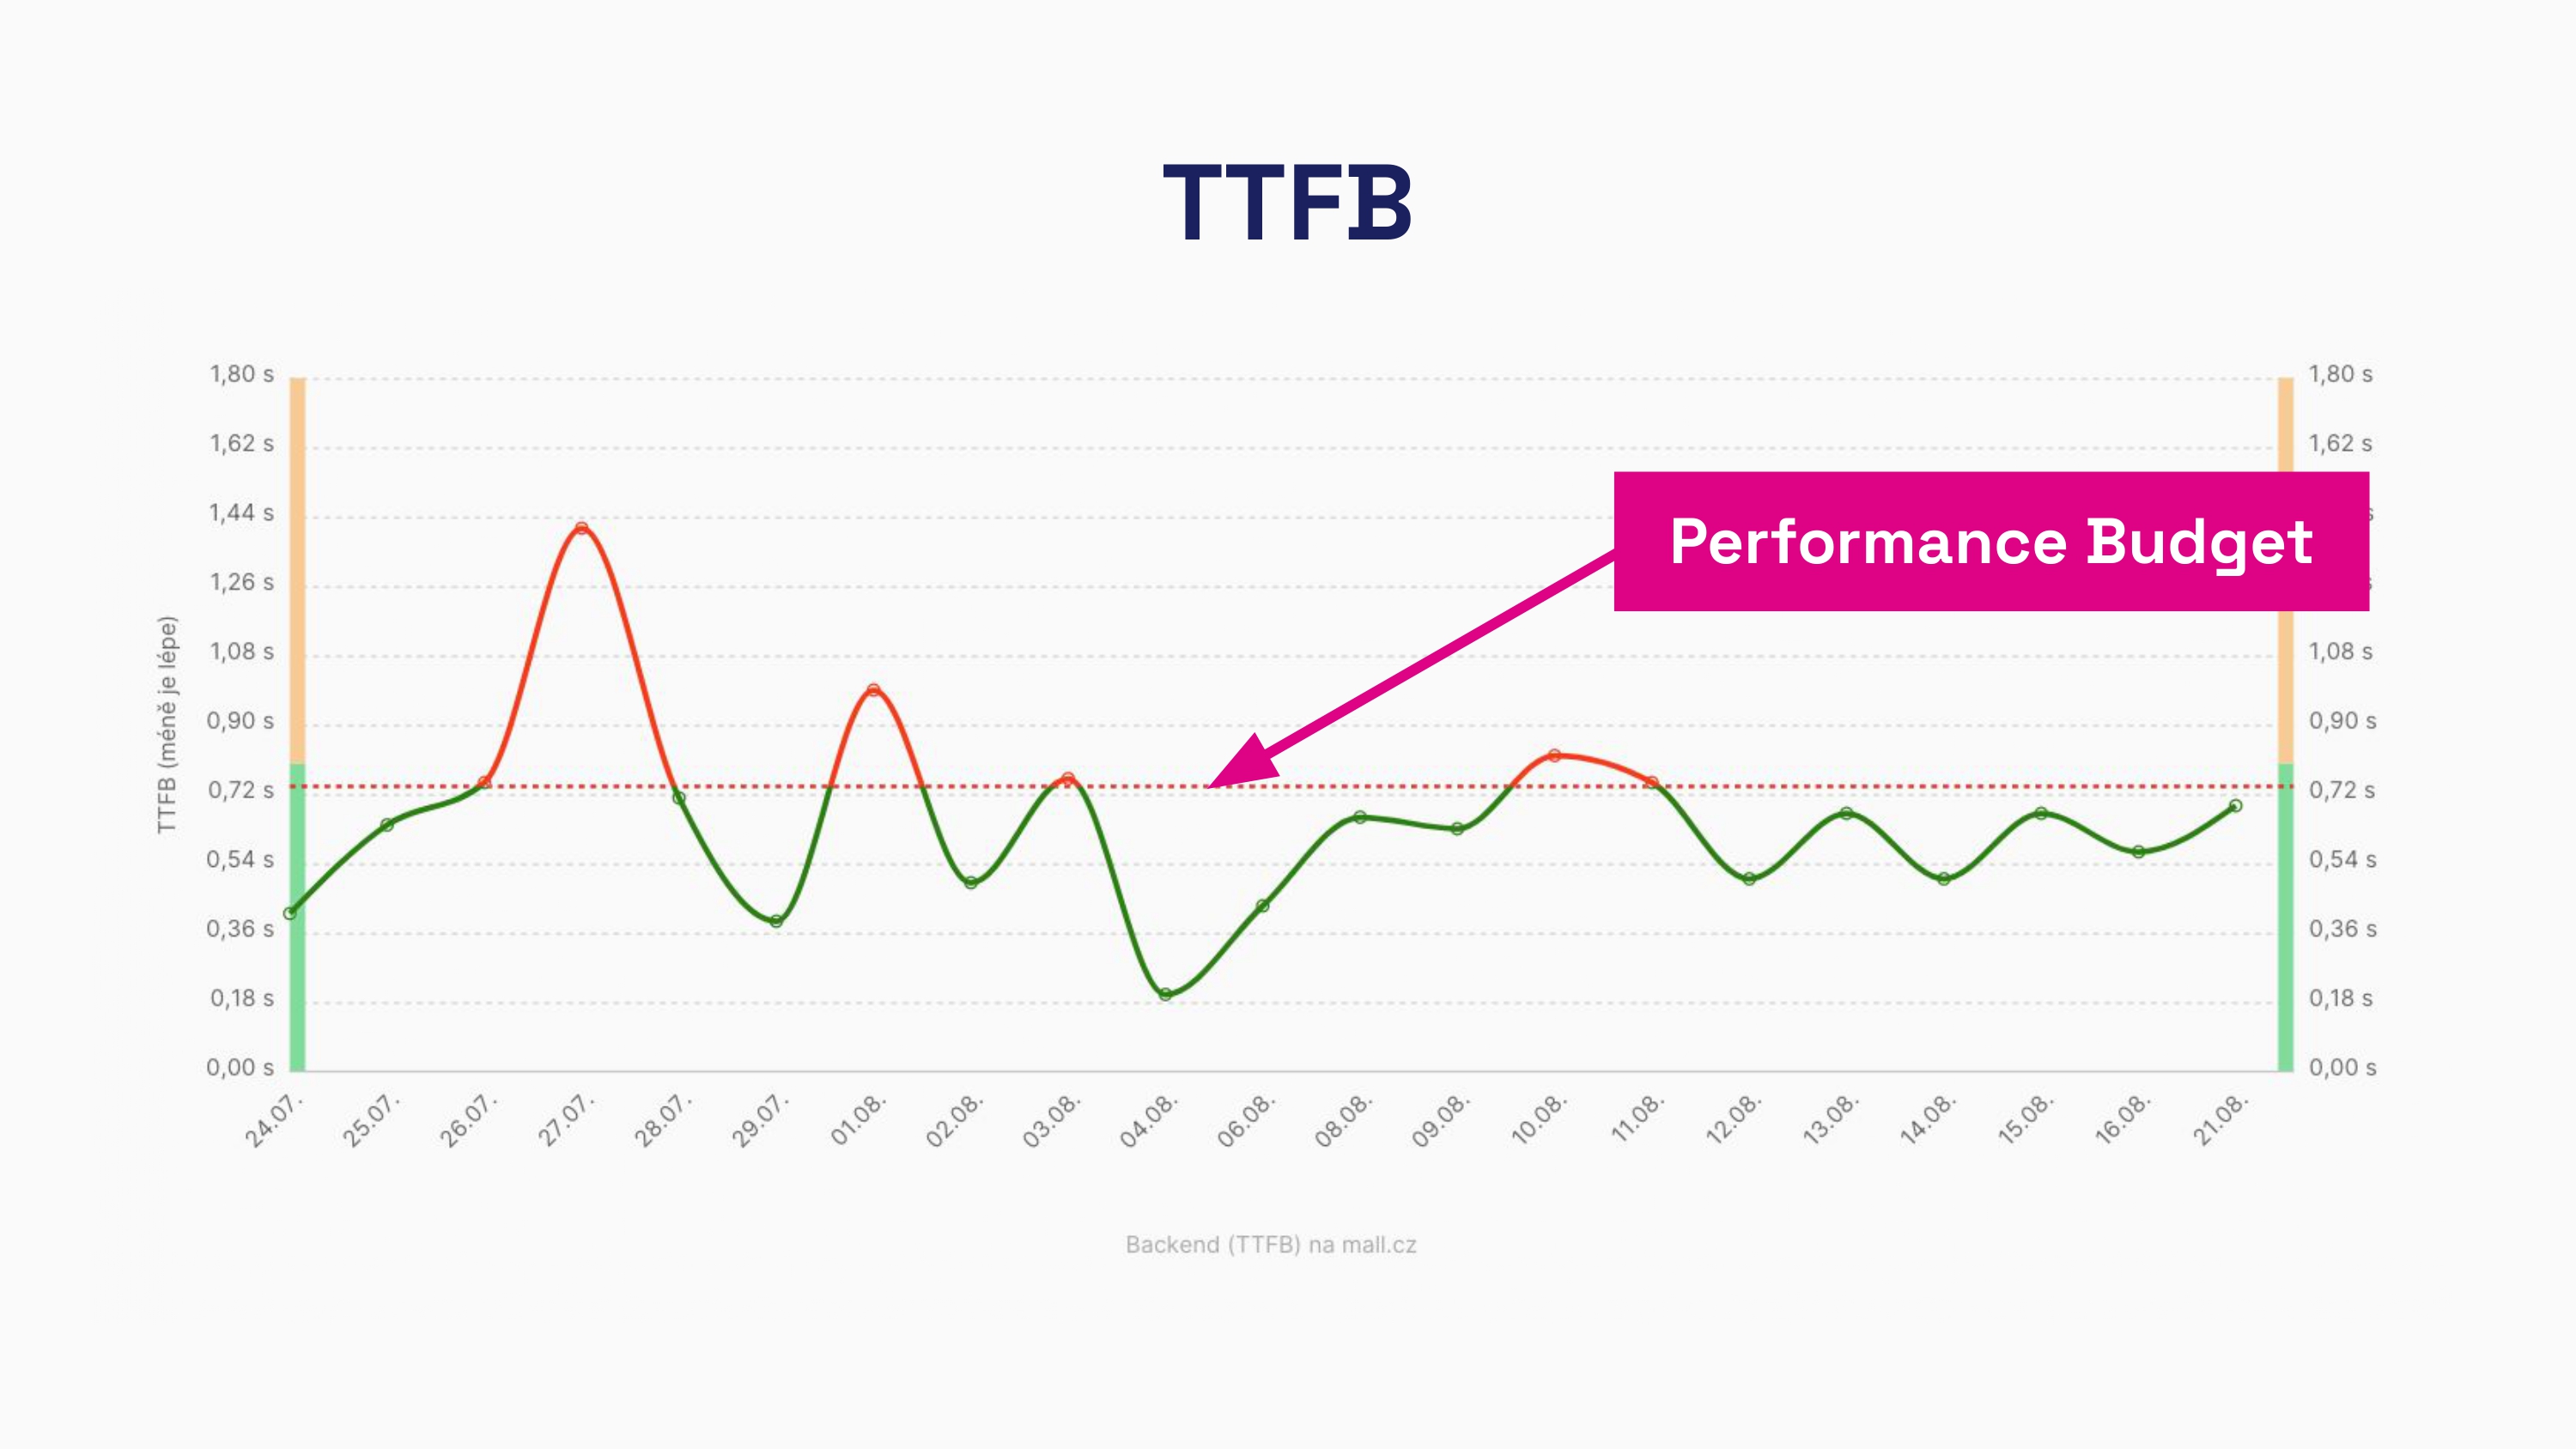 Performance budget for the TTFB (server response) metric
How can speed limits aid in optimization?
Performance budgets are a set of rules ensuring that pages remain fast and user-friendly. These limits work well with various measurements – both synthetic and RUM.
It's wise to track speed limits for all essential metrics. Specifically, we recommend monitoring the Core Web Vitals metrics along with additional auxiliary metrics. The list of monitored metrics should include:
- Time to First Byte (TTFB)
- First Contentful Paint (FCP)
- Largest Contentful Paint (LCP)
- Cumulative Layout Shift (CLS)
- Interactive to Next Paint (INP)
- Total Blocking Time (TBT)
Do note, there are substantial differences between synthetic and RUM measurements in metrics.
Synthetic measurements are limited to gauging metrics during page load, meaning results for metrics like INP or CLS may not be available or accurate. Hence, synthetic CLS results should be considered partial compared to user data (CrUX) and instead of INP in synthetic, TBT should be monitored.
Why do we recommend everyone track Performance Budgets?
The loading speed of websites directly impacts user experience and, consequently, business performance. A slow site can reduce conversion rates and increase the bounce rate.
Performance budgets help achieve this goal by:
- Maintaining consistent metric levels.
Setting limits prevents issues when deploying new features or content. - Automating checks.
With automatic alerts for issues, there's no need for constant manual monitoring. - Testing long-term in a stable environment.
By maintaining the same testing environment, you can compare current conditions with historical data.
For a deeper understanding of setting speed limits, we recommend articles on MDN, the SpeedCurve blog, or from Harry Roberts.
How to correctly set performance budgets?
If you use tools for web speed monitoring, you'll find these tips handy for setting limits.
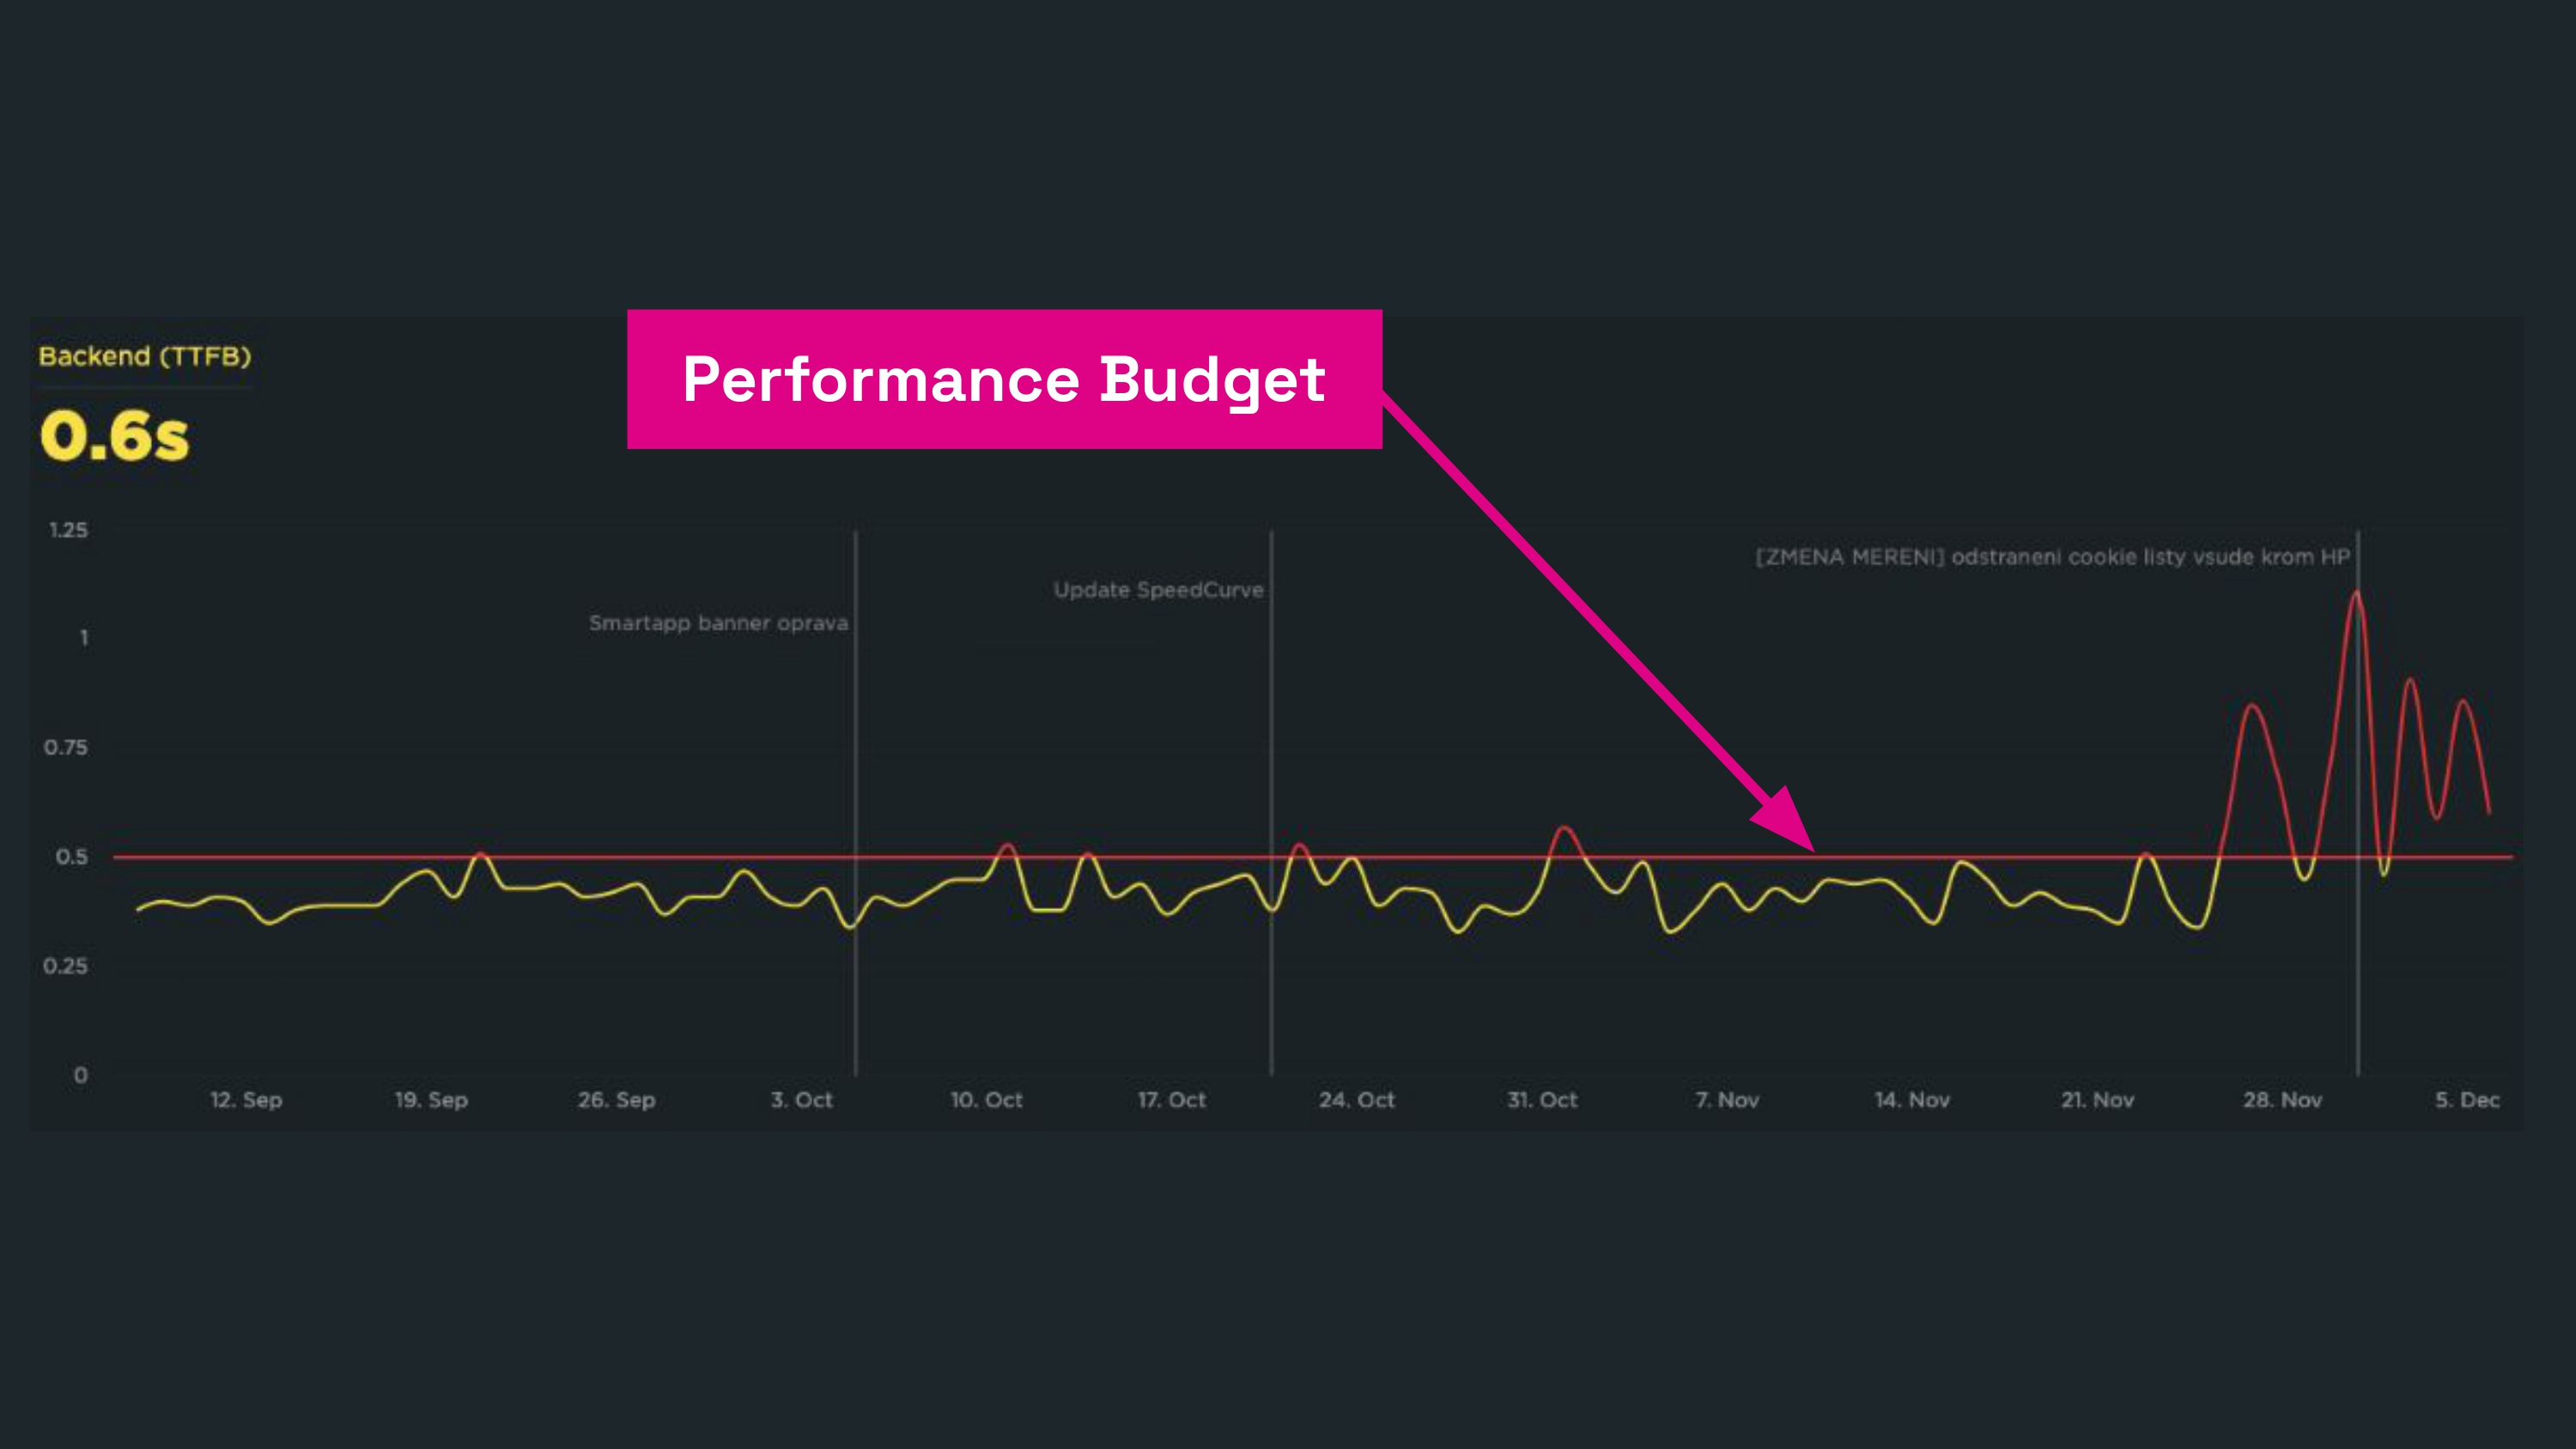 Example of Performance budgets in SpeedCurve.
If you're setting speed limits manually, we recommend the following basic procedure:
- Analyze and set limits.
Review data from the last 2 to 4 weeks and identify the worst cases. Set the budget based on the worst results. This is crucial as there's often a misunderstanding about speed limits – they truly reflect the current state. Do not set them to merely meet Core Web Vitals. Those are your long-term goals. - Start with primary metrics.
It's recommended to focus on a few key metrics like TTFB or LCP, and gradually add more metrics as needed. - Regular checks and updates.
Websites constantly evolve, so it's good to regularly update limits based on current user data.
Monitoring PLUS takes a different approach to speed limits
In our PLUS speed monitoring, we set performance budgets automatically, differing from traditional approaches.
Speed limits are featured in the Watchdog report. The Watchdog monitors the speed of your site's measured pages daily. If any key metric changes, the Speed Watchdog will notify you.
Unlike other tools, the Watchdog operates without requiring active attention and without spamming you. This allows you to focus on what's crucial for your projects.
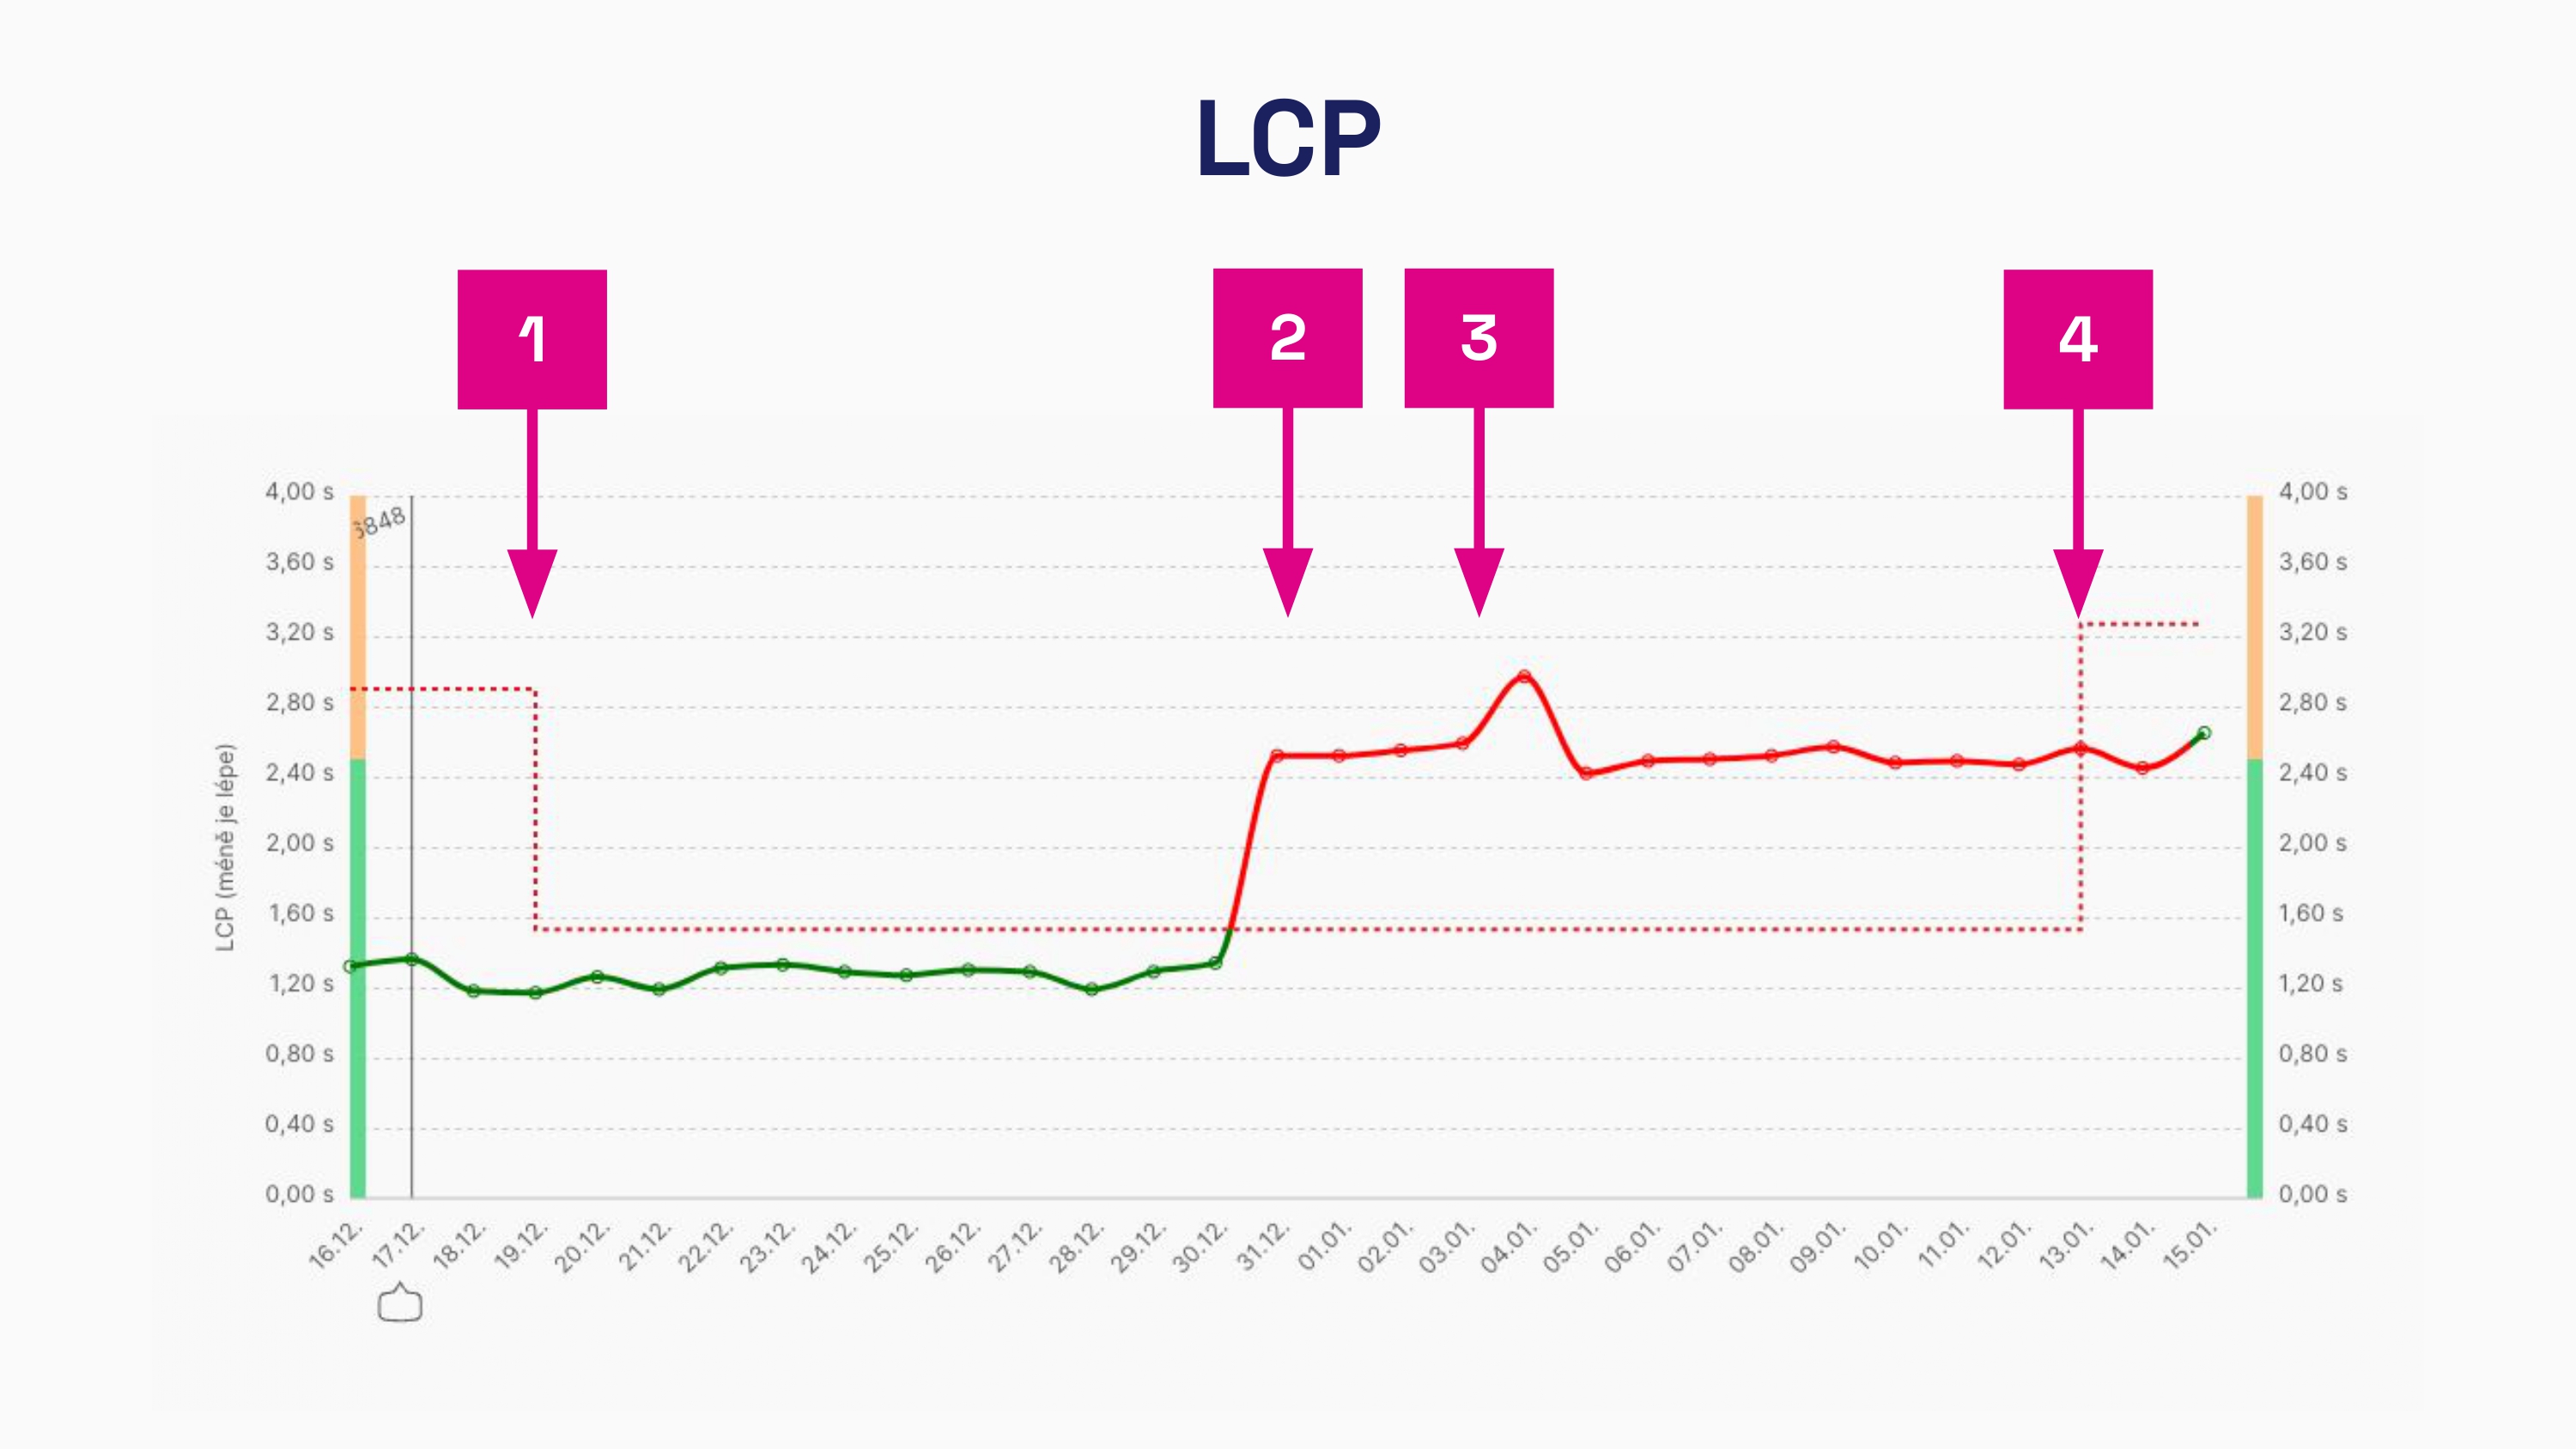 How Speed Watchdog operates in monitoring PLUS.
Let’s explain what you see in the image:
- The LCP metric improved, triggering an automatic recalculation to lower values.
- A sudden deterioration of the metric occurs.
- If it's not a temporary change, the Watchdog will send a notification.
- After two weeks with no fix, the Watchdog remembers the new level for monitoring the LCP metric.
In conclusion, web speed tends to deteriorate. The Performance Budgets methodology serves to maintain existing levels and monitor changes. The most critical feature of monitoring is its ability to watch these limits and alert you to potential issues.
If you exceed the limits and need to determine what exactly changed, Lighthouse Diff can assist you – a tool for visually comparing two Lighthouse reports.