The “Total Blocking Time” (TBT) Metric
 Radek Šír2/9/20266 minutes reading
Total Blocking Time (TBT) is a web performance metric that indicates the total duration during which a rendered page is unable to respond to user inputs.
The Total Blocking Time metric, also known as the “Total JavaScript Blocking Time”, measures the period after the First Contentful Paint (FCP) when the browser's main thread was blocked by JavaScript, preventing the page from responding to user inputs. It is often a symptom of slow JavaScript, and TBT typically has a direct impact on the crucial INP metric.
What Does Browser Blocking Mean and What Are Long Tasks?
A blocked main browser thread occurs when the browser must process a long task. A “long task” is any task that runs on the browser's main thread for more than 50 milliseconds.
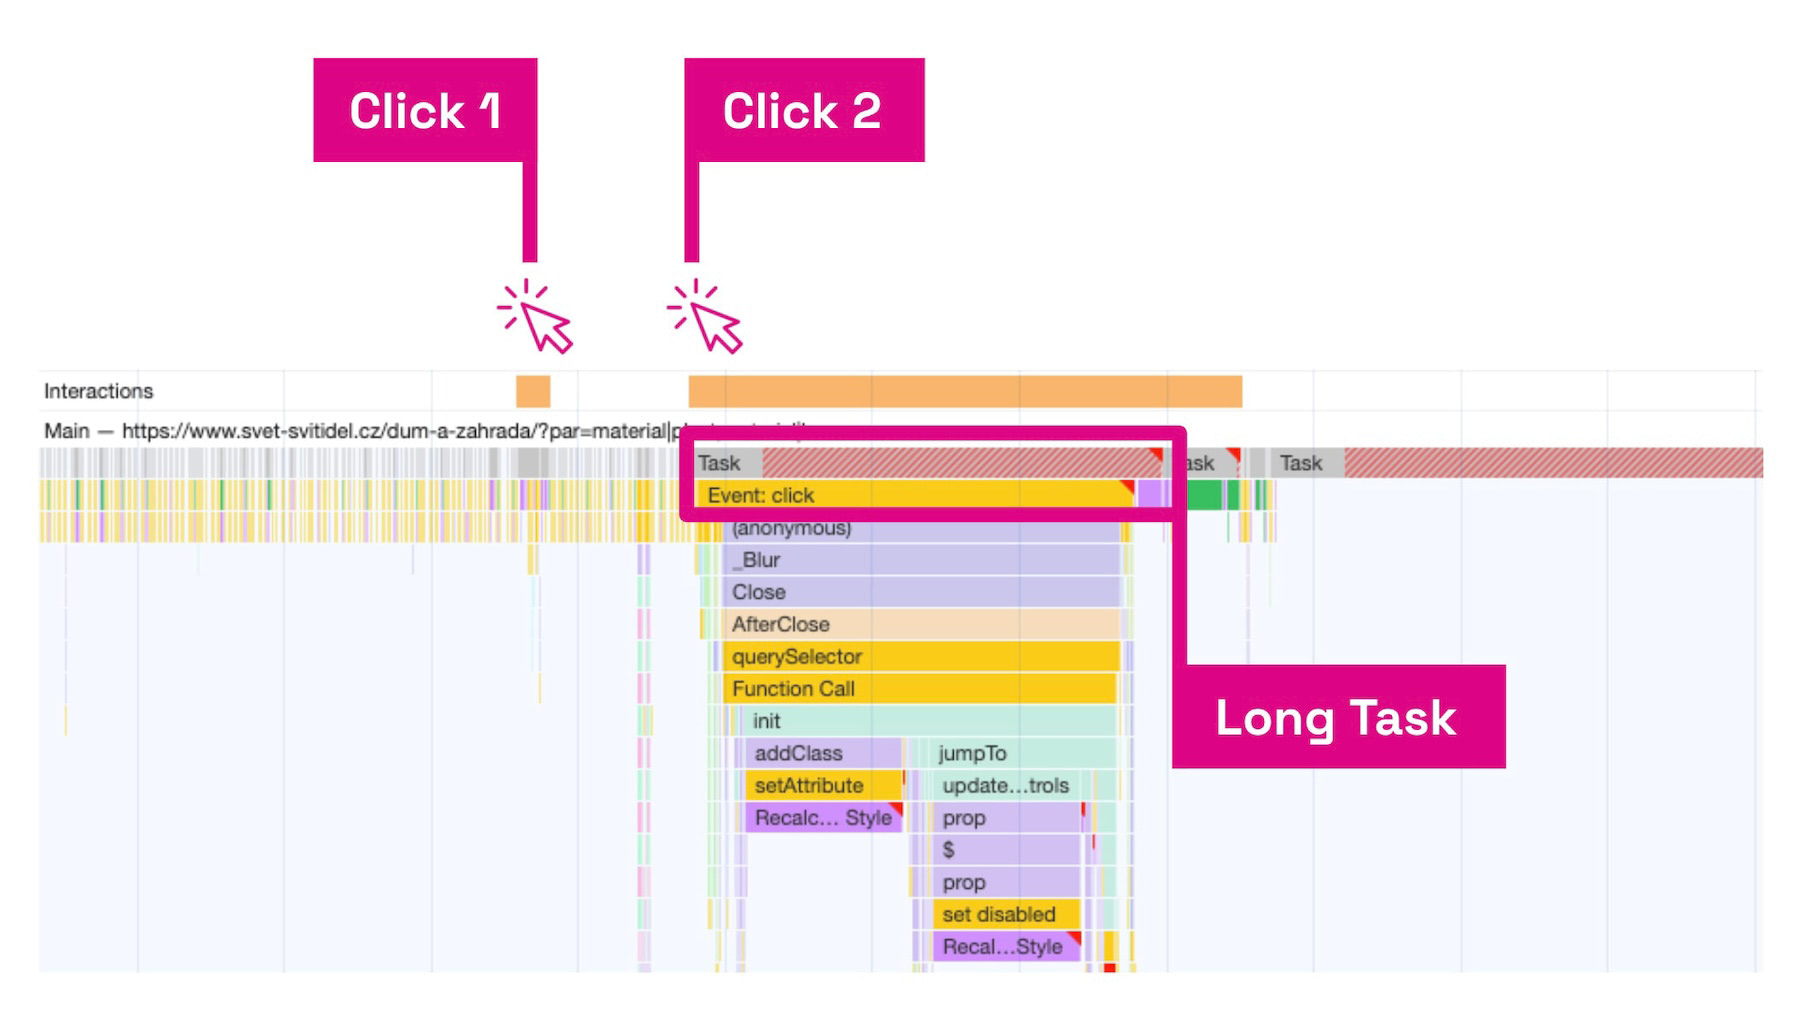 An example of a click delayed by a long task.
From the illustration:
- The first interaction (“Click 1”) happens quickly as the browser can respond immediately.
- The response to the second interaction (“Click 2”) is delayed because the user clicked during the processing of JavaScript in the background (“Long Task”).
The main thread is said to be “blocked” because the browser cannot interrupt the running task. Meanwhile, the user keeps clicking or trying to interact with the page, but receives no response as the browser is busy executing a long task.
If a user interacts with the page in the middle of a long task, the browser must wait until the task is complete before it can respond.
If a task takes longer than 50 milliseconds, the user is likely to notice the delay and perceive the page as slow or unresponsive.
The total blocking duration of a page, or the TBT metric value, is the sum of the blocking times of each long task occurring after the FCP event during the measured time span. The measurement typically ends when the Time To Interactive (TTI) metric is met or when the monitoring tool stops tracking.
Why Monitoring TBT Matters
Users dislike waiting, and if they must, they want reassurance that something is happening. Once a webpage has displayed meaningful content (FCP event occurs), it’s highly likely users will begin interacting with it. If the page fails to respond to these interactions, users might become frustrated and leave the site.
As mentioned, TBT also affects one of the three Core Web Vitals metrics, specifically the INP metric. If TBT is high and individual long tasks exceed 200 ms, the INP metric will likely be less favourable.
Therefore, aim to minimize the length of long tasks on your site and reduce the Total Blocking Time as much as possible.
Ideal Total Blocking Time Values
To ensure a good user experience, pages should aim for a Total Blocking Time (TBT) of less than 200 milliseconds when tested on “average mobile hardware”. This recommendation comes from the Chrome team on Web.Dev.
Let’s look at the TBT values recommended by Lighthouse and derived tools like our speed monitoring.
| TBT Time | Lighthouse Rating |
|---|---|
| 0 – 200 ms | Green (fast) |
| 200 - 600 ms | Orange (moderate) |
| over 600 ms | Red (slow) |
Measuring TBT
Total Blocking Time can only be measured using synthetic measurements, i.e., by machines. There are several ways to obtain the TBT metric value for a specific page.
PageSpeed Insights
Using our web speed test or PageSpeed Insights tool, you can determine the TBT metric for each URL individually.
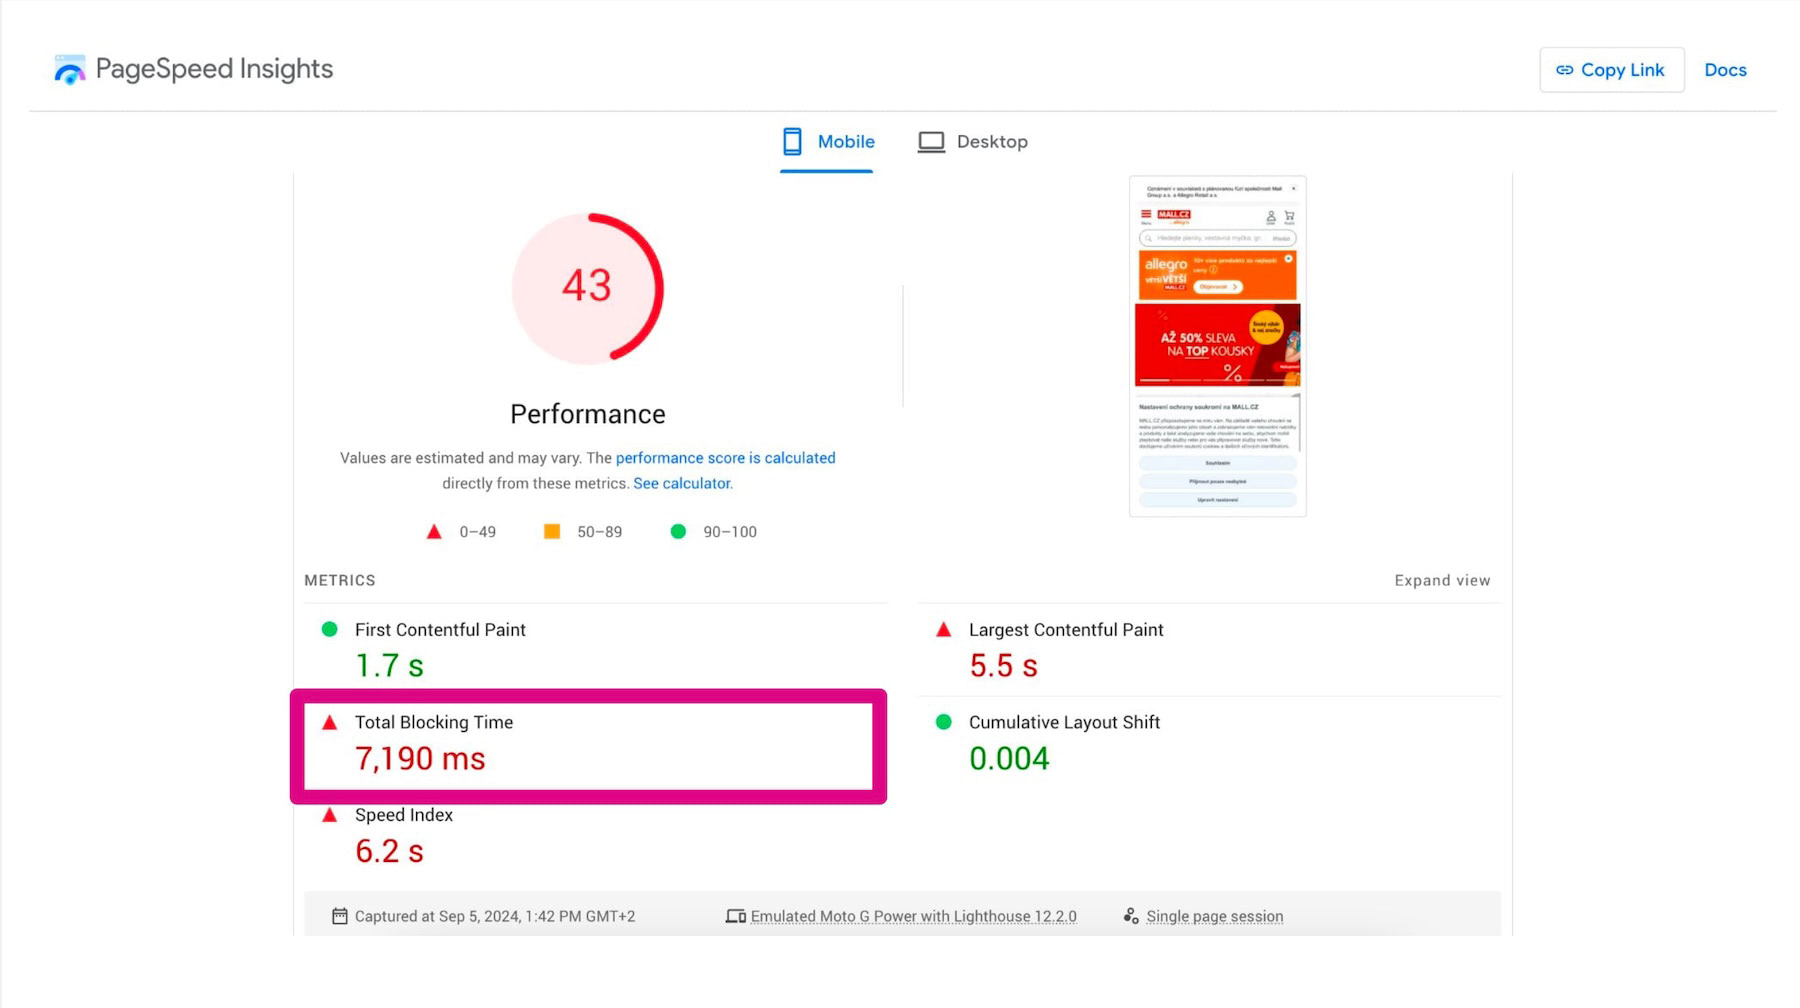 The TBT metric in a Lighthouse report, in this case within PageSpeed Insights.
PageSpeed.ONE Monitoring
In our PLUS monitoring, we display not only the current TBT value for each URL, but also illustrate how the metric has changed over time through a graph.
In the Pages Report, we track the TBT evolution for each URL:
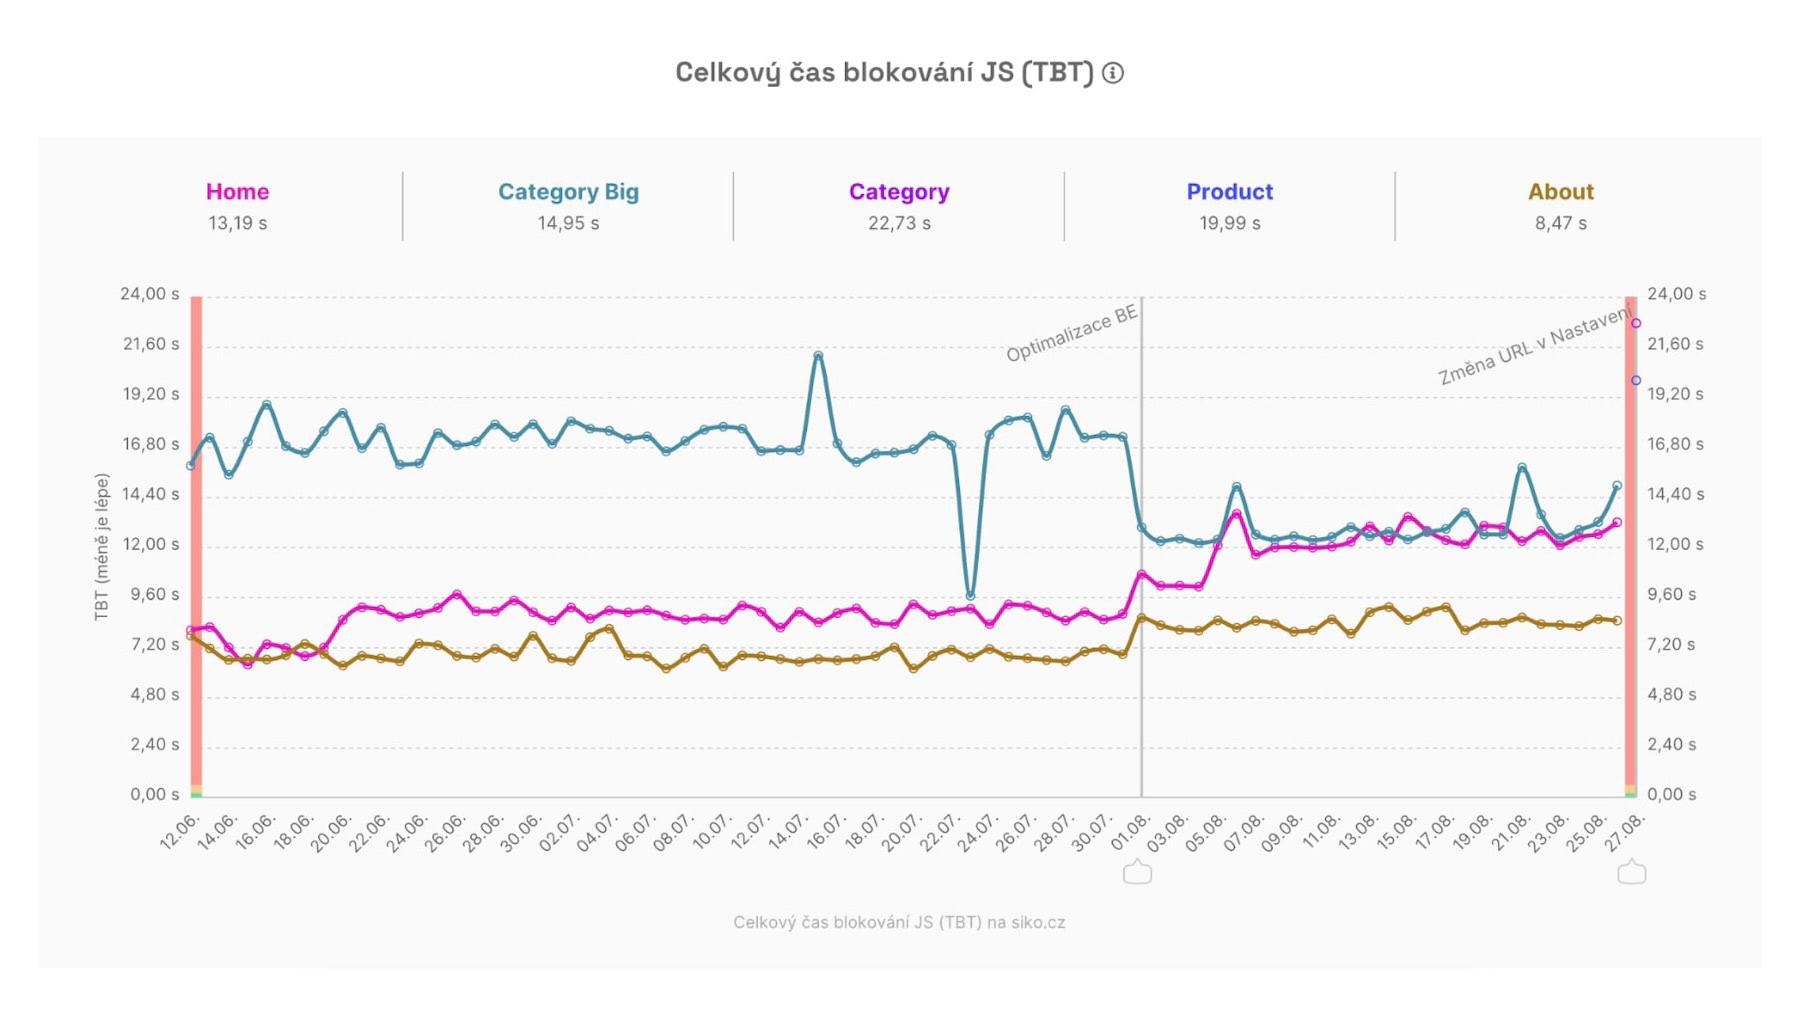 Total Blocking Time for various web page types and its development.
Using Watchdog, we show the ongoing daily changes in the synthetic TBT value, as well as other metrics, and send notifications when set limits are exceeded:
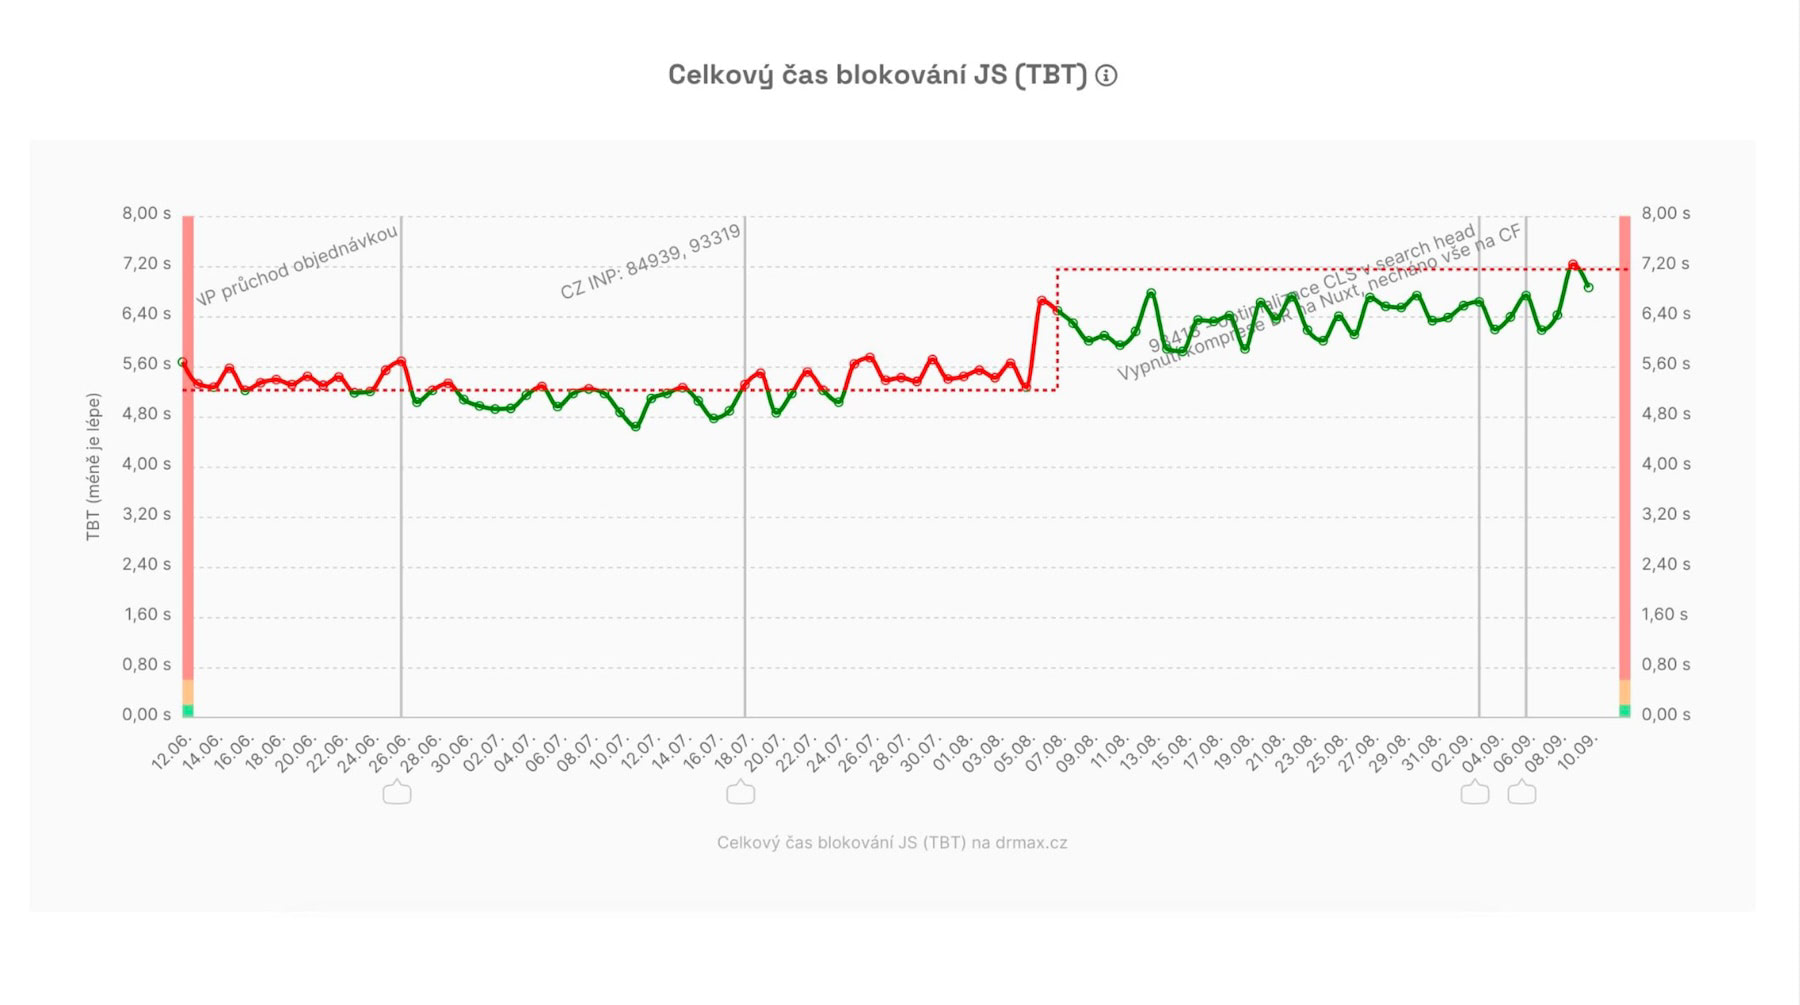 TBT metric development in the PageSpeed.ONE Watchdog monitoring.
Optimizing the Total Blocking Time Metric
Optimizing the TBT metric primarily involves reducing the amount of JavaScript executed on the page.
Generally, you can consider the following:
- Limit the amount of JavaScript embedded in the page.
- Avoid unnecessary JavaScript libraries.
- Minimize the use of third-party JavaScript code.
- Reduce work in the browser’s main thread.
Specific TBT issues might look like this:
- Generating a long task that handles page hydration in JavaScript frameworks such as React or Nuxt/Vue.js.
- Initializing a large number of functions that all run at the DOM ready event.
- Initializing numerous third-party JavaScript libraries used for marketing purposes, such as TikTok, Databreakers, GTM, FbEvents, etc.
- Initializing JavaScript libraries for components not visible in the first viewport, which can have their start deferred.
In all cases, it’s crucial to limit the amount of code executed on a given page or view, or to optimize the JS code that creates long tasks. To measure long tasks for real users, you can use the JS Long Tasks (JSLT) metric.
Manual Optimization of Long Tasks in JavaScript
Advanced users can identify specific long tasks in Chrome DevTools within the Performance tab (see browser speed measurement) and optimize specific parts of the code.
You can easily find long tasks on the web using the following image and guide:
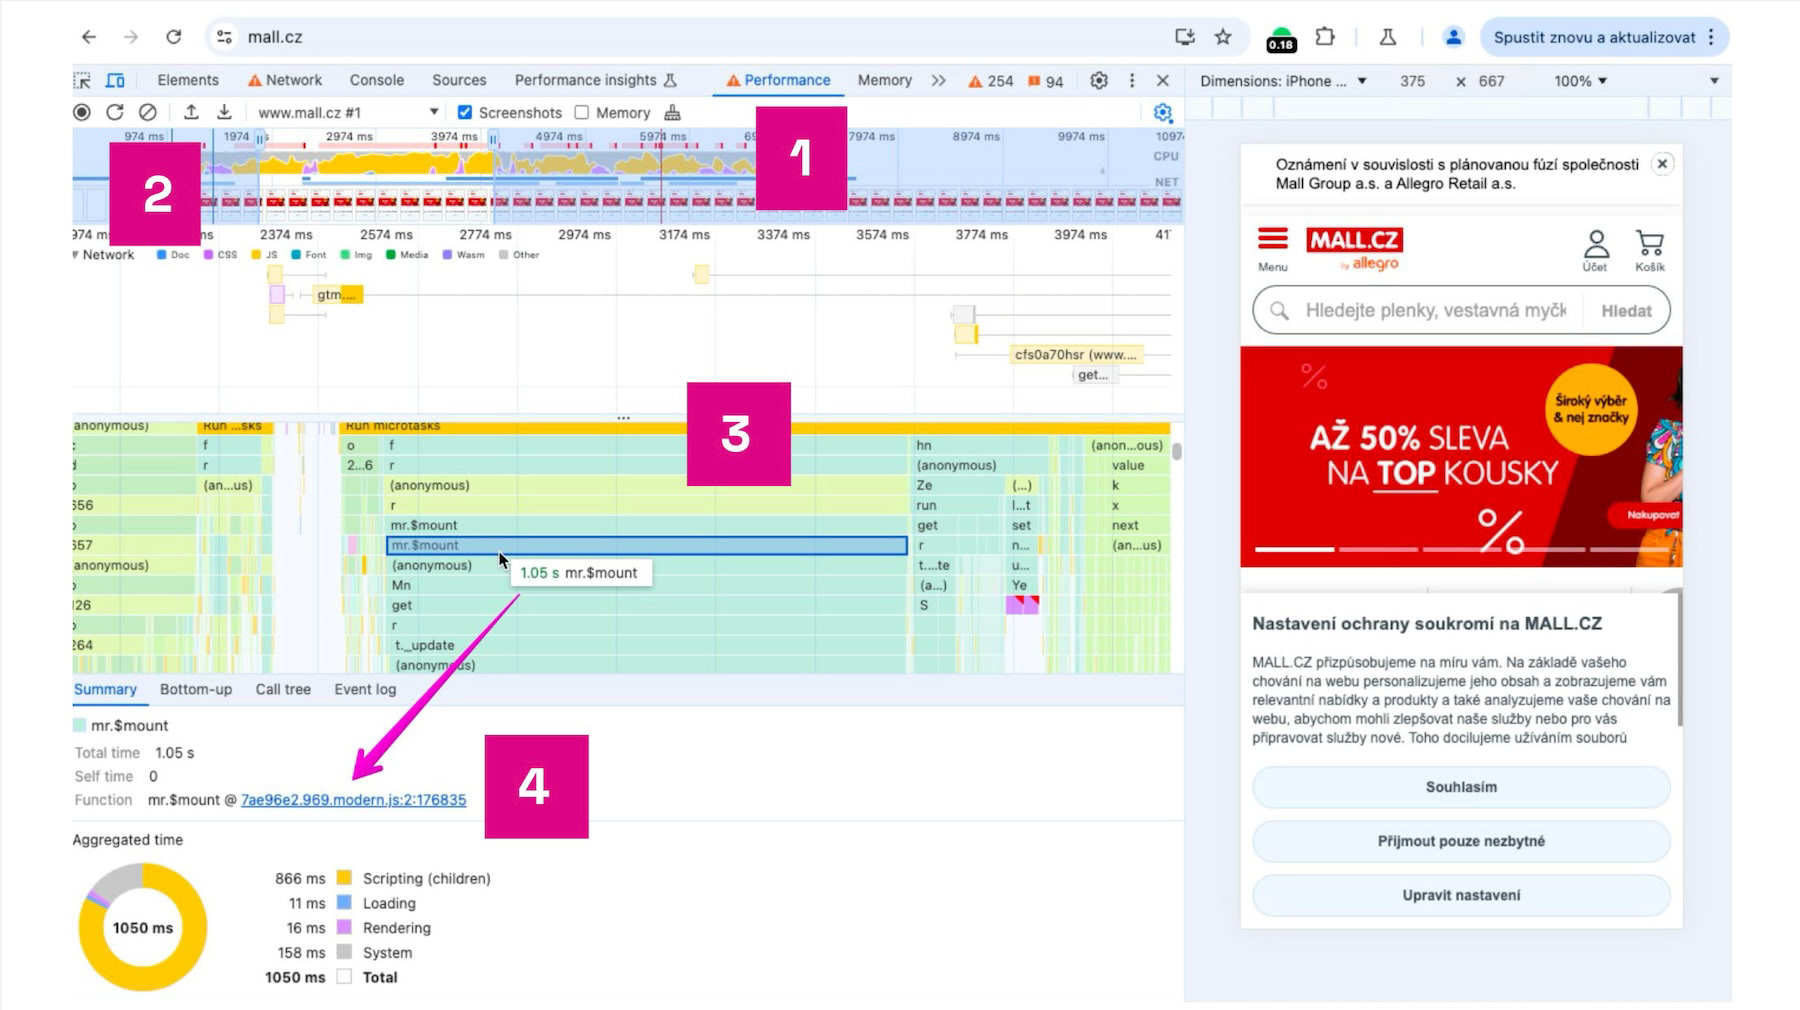 How to find long tasks in Chrome DevTools.
- Open the Chrome browser with DevTools (F12) or and display the page you want to optimize.
- Open the Performance tab (see image, step 1).
- Use the Reload and Record function to capture the page load process (step 2).
- Record the page load timeline.
- In the Main thread (work in the main thread), you can see red-hatched long tasks lasting more than 50 ms (step 3).
- By clicking within the long task, you can identify which part of the JavaScript is problematic (step 4).
For more on optimizing long tasks, see our article on optimizing the INP metric.