Core Web Vitals: All About Essential Web Speed Metrics
Core Web Vitals is a fundamental set of metrics from Google designed to reflect website loading speed and user experience.
Let’s discover what metrics it includes, why they are important, and how to measure them. Core Web Vitals are the bare minimum you should know about your website's speed.
Metrics in the Core Web Vitals Set
Core Web Vitals (CWV) provide three perspectives on web speed – loading speed, interaction speed, and visual stability.
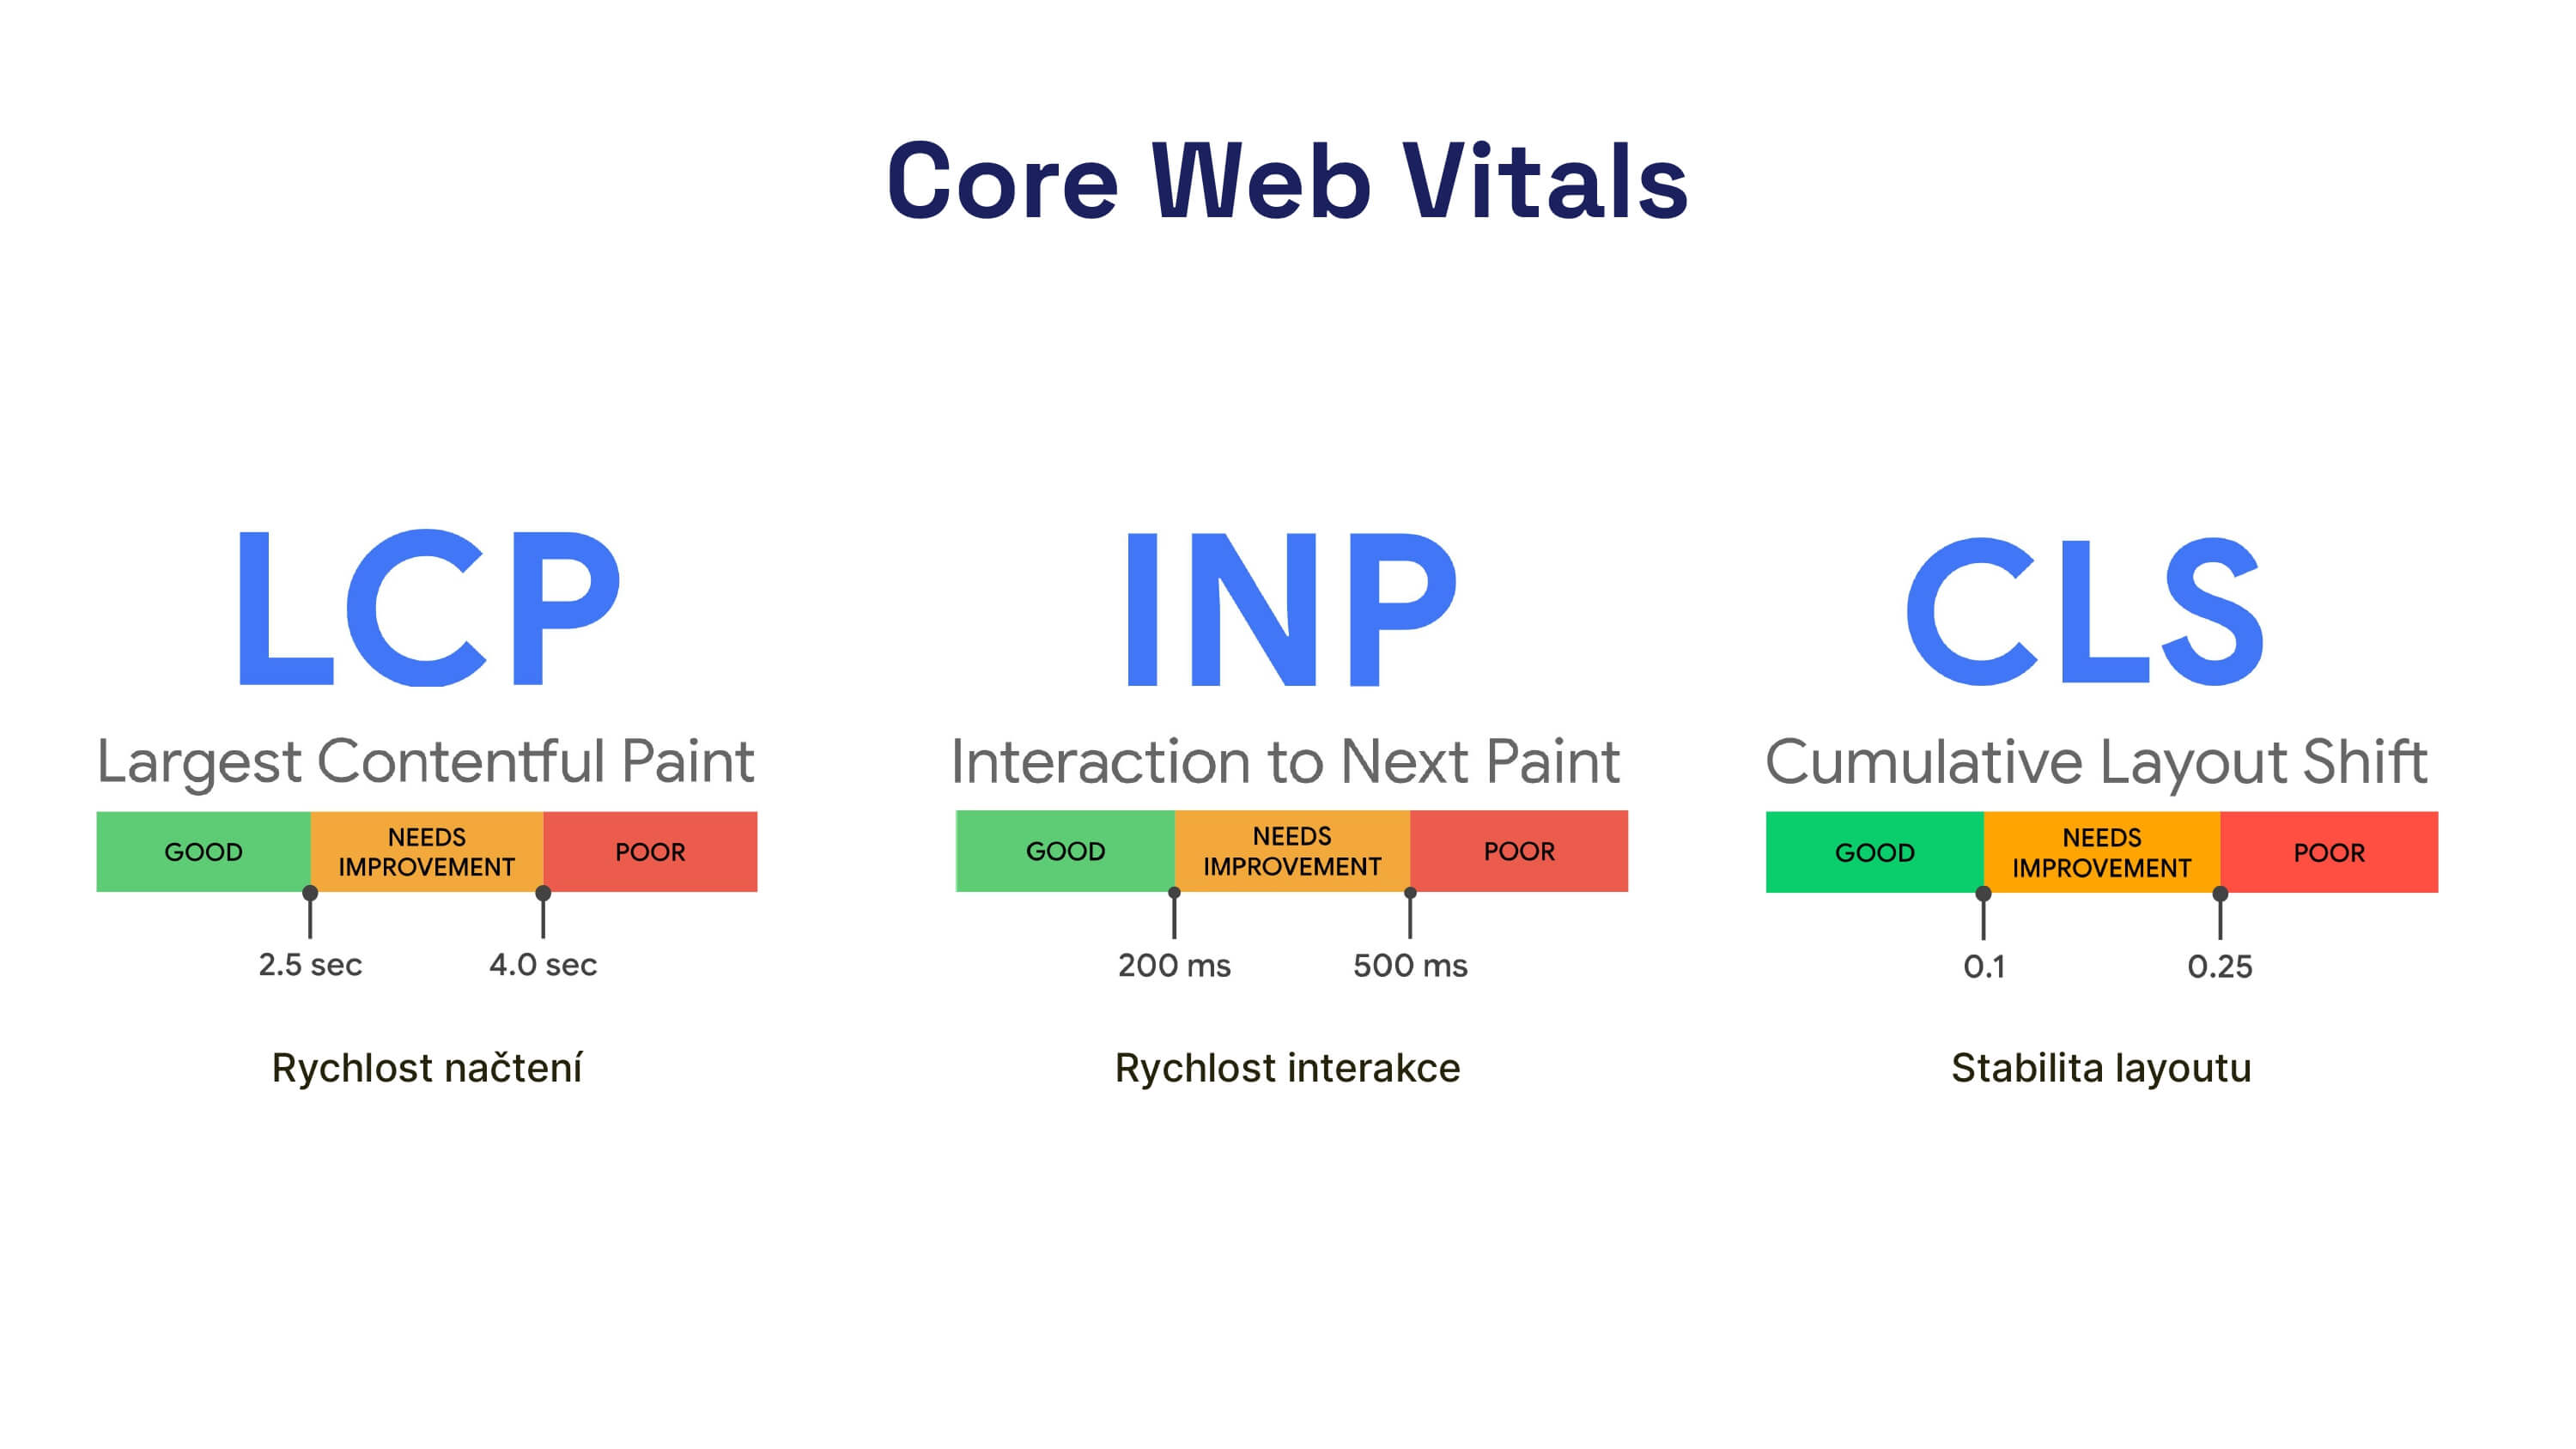
- Loading Speed (LCP) measures the time taken to load the largest visible element on a page. It answers the question, "How quickly does it load?" The threshold for passing is 2.5 seconds.
- Interaction Speed (INP) measures the time from interaction to the next frame being rendered, for all interactions on the page. It answers the question, "How quickly does it respond?" A good response time to the next frame is 200 ms.
- Visual Stability (CLS) examines the visual stability of the page during loading and browsing by the user. It answers the question, "How much does the page jump?" Google considers a CLS under 0.1 as satisfactory.
A concise table overview:
| Metric | 🟢 Good | 🟠 Needs Improvement | 🔴 Poor |
|---|---|---|---|
| Loading Speed Largest Contentful Paint (LCP) | ≤ 2.5 s | 2.5–4 s | > 4 s |
| Interaction Speed Interaction to Next Paint (INP) | ≤ 200 ms | 200–500 ms | > 500 ms |
| Visual Stability Cumulative Layout Shift (CLS) | < 0.1 | 0.1–0.25 | > 0.25 |
How and Why Core Web Vitals Were Created
Google introduced the Web Vitals initiative in May 2020. The goal was to consolidate web speed into a small set of numbers that reflect what people actually experience on a page, not just what a one-time lab test shows. The initial trio of Core Web Vitals consisted of loading speed (LCP), visual stability (CLS), and interactivity measured by the First Input Delay (FID) metric.
Google based the choice of metrics on data from the Chrome UX Report and research into human-interface interaction, summarized in the article The Science Behind Web Vitals. Since June 2021, Core Web Vitals have been part of the search ranking within the Page Experience signal. For website owners, this means speed is no longer just a technical optimization for developers but part of visibility on Google.
Behind the initiative is also Google's interest in not sending users from its ecosystem – from search, ads, or Chrome links – to slow or poorly usable pages. It prefers to prioritize websites with a good user experience (UX). Core Web Vitals thus track a basic part of UX, especially important for visitors coming from Google's ecosystem.
Another advantage of Core Web Vitals is their authority. You share a common language between the website owner, developers, and marketing. You know what to ask in reports, and you can track the same numbers.
What Do “Good” Core Web Vitals Mean?
Google considers a website as "meeting CWV" when all three metrics are in the green zone at the 75th percentile of data from the Chrome UX Report over the past 28 days, separately for mobile and desktop.
Google wants three-quarters of your users to see the site in the green zone of metrics on both types of devices.
This is a reasonable technical goal. But it is not a definition of a "fast website". Google set the thresholds to be achievable for decently built websites, not to represent top speed.
At PageSpeed.ONE, we say that meeting Core Web Vitals is the minimum from which you can venture into further speed work.
For business decision-making (conversion, retention, cart abandonment), in addition to meeting the thresholds of the LCP, INP, and CLS metrics, you also need our business analysis.
Can It Be Summarized in a Single Number?
It can – but beware of which number you choose. To know the state of your website for real users, you need to track the three Core Web Vitals metrics separately for mobile and desktop. That’s six values per domain, and across multiple domains, dozens of numbers.
A website owner, marketer, or project manager cannot easily discern success from these numbers. It's tempting to reach for a synthetic score from Lighthouse – but it doesn’t relate to CrUX data and is misleading for decisions about website speed.
At PageSpeed.ONE, we have the PageSpeed.ONE Score (SPS). It originated from consulting practice: we first show clients CrUX and CWV in monitoring, but for a quick summary, domain comparison, or management report, we need one value derived from the same source – from Google users, not from a lab test.
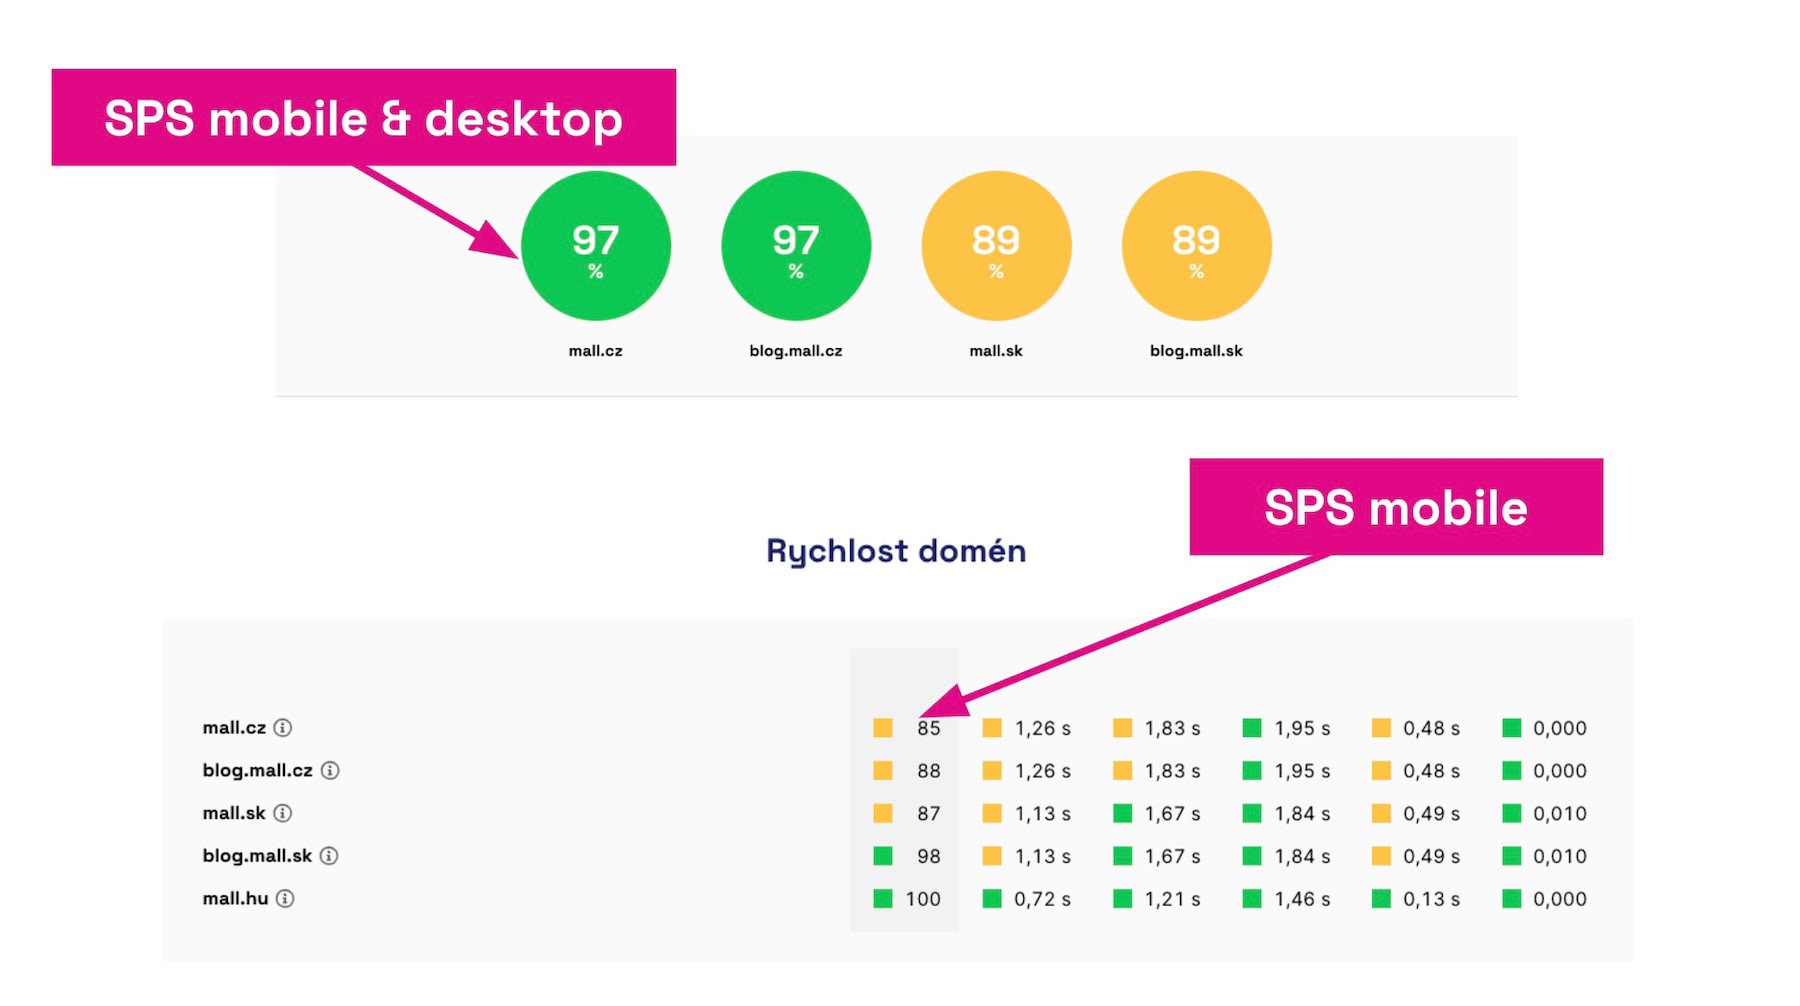 Speed Score (SPS): unify six Core Web Vitals numbers per domain into one summary from CrUX data.
SPS unifies LCP, INP, and CLS for mobile and desktop into one percentage. It considers the entire user distribution, not just the 75th percentile, and weighs metrics according to how business and real traffic respond to them. It doesn’t replace CWV in optimization; it quickly tells you how you are doing overall. Detailed calculation and interpretation can be found in the article on PageSpeed.ONE Score (SPS).
How to Measure Core Web Vitals from Users?
We must realize that Core Web Vitals metrics represent data collected from real Google Chrome users in the Chrome UX Report dataset. However, you can also obtain this data through Google's API, and it is provided by various providers.
In practice, for a one-time status check, we recommend using the PageSpeed.ONE Speed Test (Insights) as the first choice:
Measure your website speed
Enter a URL and see where you stand.
Another option is PageSpeed Insights from Google for a quick one-time check of a foreign domain. However, this tool doesn’t show trends over time; that data is available from another Google tool, CrUX Vis.
Google Search Console as an Important Supplement
An important tool is also Google Search Console for summarizing data by URL groups.
Be cautious with data interpretation! Experts at PageSpeed.ONE often explain to clients the non-intuitive reports that show the number of URLs in different color zones, not directly the metric values.
A shift of pages from orange to green might mean an improvement in LCP from 2.51 s to 2.49 s, where the color shifted but the actual speed hardly moved. Search Console counts the number of URLs in each zone. A shift of a few URLs over the threshold (e.g., LCP from 2.51 s to 2.49 s) can make the domain jump from orange to green, even if the average metric value remained nearly the same.
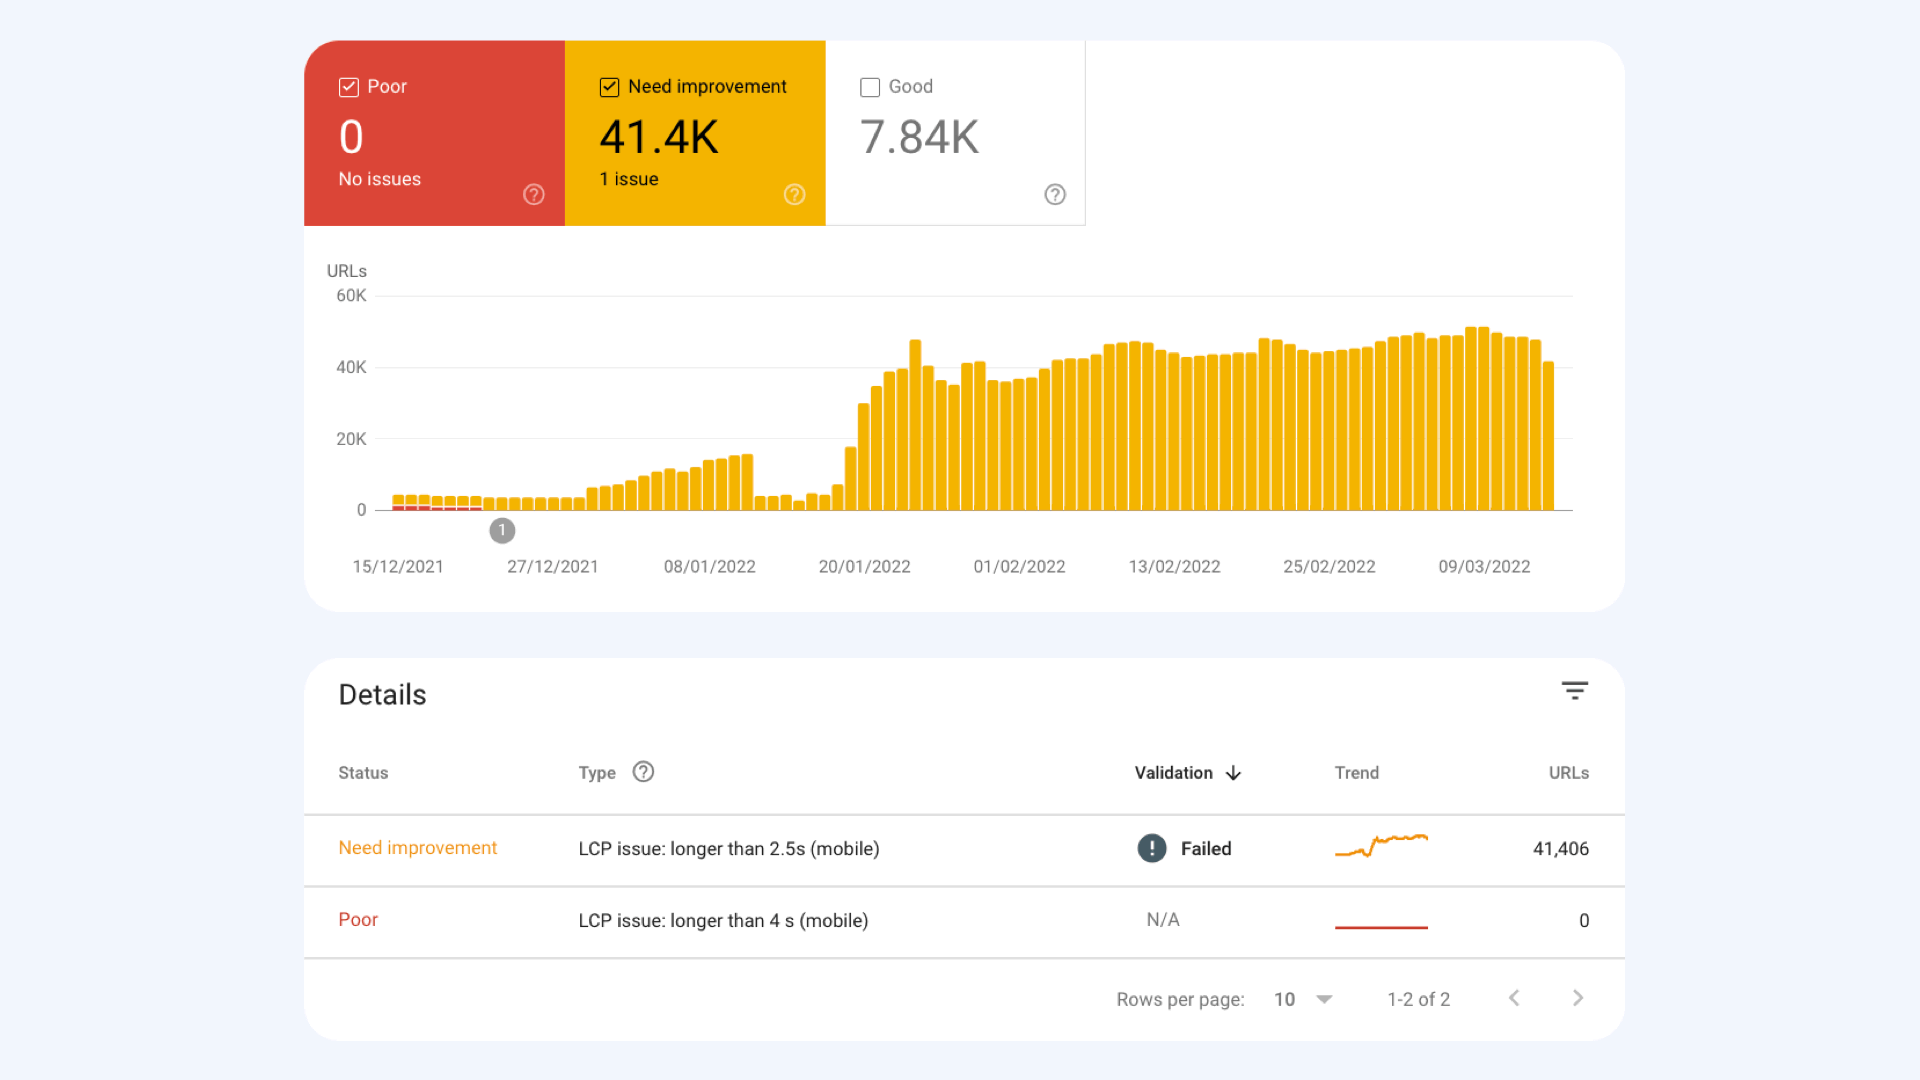 Google Search Console report shows how many URLs fall into the "needs improvement" zone, not the average value for the domain.
A detailed analysis of data collection, rules, and limitations can be found on the separate page about the Chrome UX Report.
How to Test Core Web Vitals in Synthetic?
The Chrome UX Report tells you how your site was performing for real users in the last 28 days. For checking a specific page, regression after deployment, or testing a page without user data from Google, you need another source – synthetic ("lab") measurements under controlled conditions.
Tools for synthetic CWV testing include Lighthouse, available in the PageSpeed.ONE monitoring tool or our website speed test.
PageSpeed.ONE Monitoring also offers a Watchdog function, which monitors potential speed degradations.
However, synthetic has only partial truth, beware of that.
Meeting Core Web Vitals: User Data vs. Synth
When we say "the site meets CWV", we mean user data, not synthetic data. Specifically: data from the Chrome UX Report over the past 28 days, 75th percentile, all three metrics in the green zone, separately for mobile and desktop.
The synthetic score in Lighthouse won't tell you this; it shows its own one-time result and tends to be unnecessarily strict for CWV.
Reasons why synth isn’t as accurate as reality:
- INP synth doesn’t capture
Lab tests have no user clicks, so INP is unavailable for "meeting CWV" in synth measurements. - CLS only for first load
Real shifts after interaction (sorting products, opening filter) usually don’t appear in lab measurement; in CrUX, they are collected the entire time the page is open. - One device at one moment
Synth measures a defined network and CPU profile. CrUX is a distribution of real people on different devices; aggregation "makes it kinder" towards rare fluctuations.
If you praise a green state in lab measurements, but CrUX remains orange, it doesn’t mean a tool error. Synth measures the technical potential of the page; CrUX represents user reality. It makes sense to optimize so that Core Web Vitals data from users is in order.
For a complete picture, always combine synth and CrUX, and possibly add RUM. Detailed differences are discussed in the article synth vs. CrUX vs. RUM.
The Significance of Core Web Vitals Metrics and Their Business Impact
Pages that meet these metrics generally provide a better user experience, which can lead to higher conversions, better search rankings, and cheaper PPC ads.
Google didn’t select the metrics and limit values randomly, but based on long-term work and analysis of many studies in the field of human-computer interaction. For the above reasons, we consider CWV important limits for optimizing web speed.
However, note that not all three metrics have the same business weight. From our consulting practice, we see that LCP or INP can significantly impact an e-commerce conversion rate more than CLS.
In this sense, CLS is often the least business-oriented, and its influence is often overshadowed by the page’s appearance in search results, brand campaigns, or navigation.
Meeting the thresholds is the starting line; for prioritizing optimizations, we recommend adding our business analysis (conversion flows, RUM, A/B tests).
We Often See the Impact of Core Web Vitals on SEO
From long-term PageSpeed.ONE consulting practice, we see the most significant impact of Core Web Vitals on SEO with two types of projects: e-commerce and content websites.
The competitive environment (strong longtail, balanced technical level of competition, frequent algorithmic movements in SERP) also influences this.
Where competitors haven’t ensured speed, a well-done website can gain extra positions. Where everyone has ensured it, red metrics further deepen the disadvantage.
Specific example from e-commerce:
 After addressing slow INP, we saw a gradual improvement in position. In a modeled comparison, there was an additional +17.3% of sessions from Google.
At Denatura, which we monitor long-term as an e-shop with natural cosmetics, we combined CWV optimization with ongoing analysis in Google Search Console and internal deployment logs.
After optimizing INP metrics on the product detail (especially third-party and code unnecessarily blocking the main thread), we saw stabilization of positions and a gradual improvement in speed for users. This roughly corresponds to what we see elsewhere: the effect doesn’t manifest immediately as a jump in traffic, but gradually through positions and impressions on longtail queries targeted by problematic pages.
From another anonymized e-commerce case study in PageSpeed.ONE, we see that after INP repair in February 2026, there was an almost immediate stabilization of the average position (from ~5.2 to ~4.3) and stopping large search oscillations. Impressions and clicks didn’t soar immediately; the impact went through improving the quality of longtail queries. This aligns with historical experience from September 2025, when the confluence of "green" CWV with the Google Core Update created growth that mere technicality likely wouldn’t have caused. Conversely, poor CWV acts like a hand brake. A site grows in the season thanks to marketing, but the technique constantly holds it back.
Do Core Web Vitals Still Make Sense?
Yes, and for several reasons simultaneously. Core Web Vitals are still the minimum that a website owner should understand, and from our consulting practice, we see three recurring arguments:
- Impact on SEO and PPC
Core Web Vitals metrics remain a signal for search and enter the quality score of Google Ads. Poor condition is regularly seen in the account and CPC. - Basic UX and Conversion Benchmark
The three metrics describe three real dimensions of experience that the human psyche reacts to: how quickly it appears, how quickly it responds, how much it jumps. These three questions your visitor asks, whether you want it or not. - Proxy Metrics for Other Technical Indicators
During a Core Update, many things shift simultaneously. From observing numerous projects, we see that websites in good technical condition tend to have smaller drops or even gains during updates. Loading speed (LCP) works as a proxy for backend speed (TTFB), positively influencing Google's crawl budget and website availability for AI bots (we address AI bot strategies).
What do Core Web Vitals metrics not do? They won’t tell you if your site is fast for business. For that, you need other numbers, typically a business analysis on your conversion flows, or collecting RUM data. Taking CWV as the sole measure would be as much a mistake as taking the score in Lighthouse as the speed of the web.
How to Improve Core Web Vitals
Optimizing each metric has its own rules and its own article. Here’s a brief guide we combine with experience from our projects:
- Loading Speed (LCP) Optimization:
There’s a lot to it. From backend improvement (TTFB), critical path optimization (CSS, fonts), correct formats and image sizes,fetchpriorityandpreloadfor the LCP element, lazy loading outside the viewport. Detailed steps are discussed in LCP optimization. - Interaction Speed (INP) Optimization:
Break up long tasks (setTimeout,scheduler.yield()), defer non-critical JS after interaction, limit third-party code in critical moments, provide immediate visual feedback to the user. A long-term approach on a real application is described in the Innogy case study (INP improvement by 38%). Recipe in INP optimization. - Visual Stability (CLS) Optimization:
Handle image and iframe dimensions (CLS dimensions), proper font space settings, asynchronous banners with fixed reserve, watch out for shifts after clicks. A comprehensive view in CLS optimization.
From the consulting practice of the PageSpeed.ONE team, we add some more advanced notes:
- Cloudflare
For many websites, we recommend considering installing a CDN – with proper setup (Cloudflare settings), it can help with all Core Web Vitals metrics. - Platform Limits
Shoptet as a platform requires a different approach, see Shoptet optimization (asynchronous GTM, cookie bar shifts, JS modernization).
Changes in Core Web Vitals appear in Google data (CrUX) with a delay (typically movement starts to manifest 1–2 weeks after deployment). To prevent regression from sneaking into production unnoticed, we recommend engaging in long-term web speed monitoring with alerting on degradation.
Core Web Vitals Dashboard in PageSpeed.ONE Monitoring
A summary of Core Web Vitals metrics for mobile and desktop is available in our website speed test, but also in monitoring PLUS – in the “Summary” report and others. At the same time, it is possible to track the development of metrics at the domain or URL level over months in our tool.
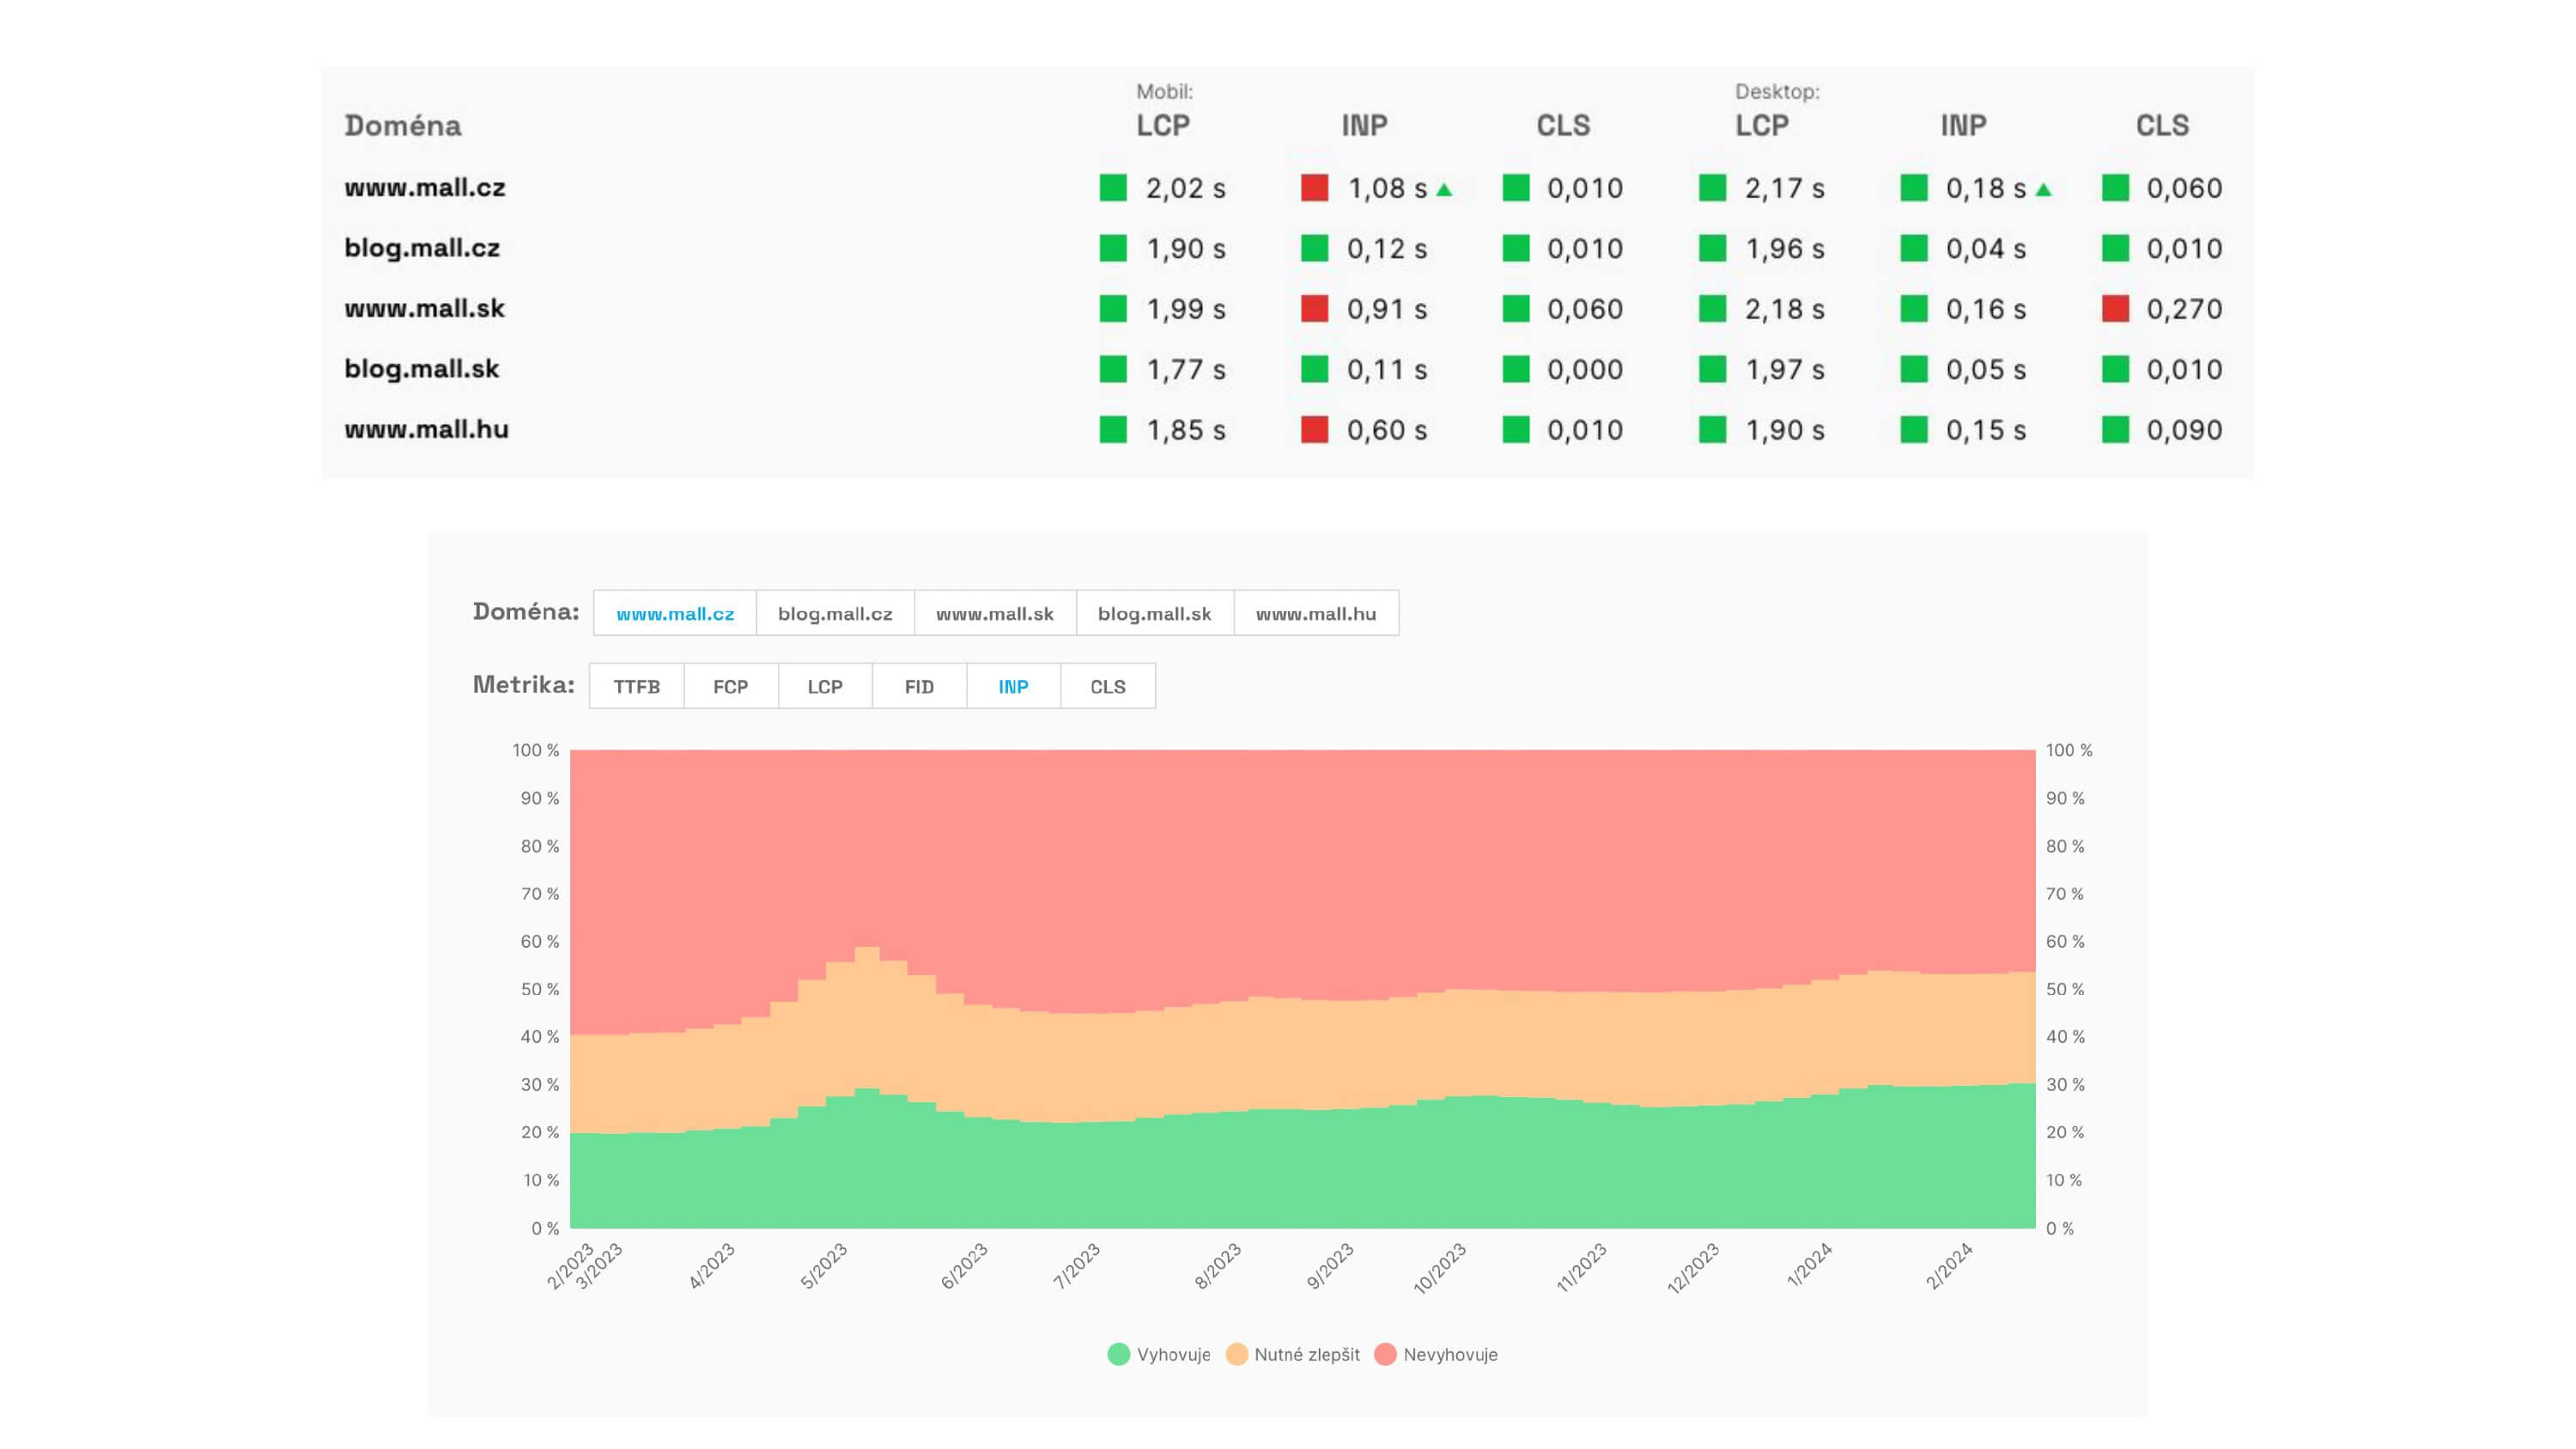
Regular monitoring PLUS then complements synthetic tests and alerts on regressions, so you don’t find yourself blind to poor conditions.