Monitoring Web Speed: Why It's Important and How to Use It Effectively
 Martin MichálekUpdated 1/26/202615 minutes reading
Suddenly, things aren't working. Conversions are dropping, visitors are vanishing, the website is slowing, and you don't know why. You've made no major changes, so what's the issue?
Perhaps your site has been slowing for months without you noticing. Perhaps a new feature implemented last week has bogged down key pages. Or maybe a third party changed their code without informing you. Without monitoring, you've no hope of understanding what's happening.
Website speed monitoring offers you insight, control, and the ability to resolve problems before they impact your business.
What does this article cover?
- Why is website speed crucial? Its impact on conversions, SEO, and overall user satisfaction.
- How can monitoring save you time and money? The return on investment and direct business impact.
- What kind of monitoring do you need? Why combining different types of monitoring is beneficial.
- Why aren't one-off tests sufficient? The difference between PageSpeed Insights and continuous monitoring.
- How to set up and use monitoring? Our methodology that saves time, money, and stress.
If you want to keep your website speed under control, read on.
You can now set up a monthly trial of our monitoring service. No credit card, no commitments.
Why Have Website Speed Monitoring? Business Value, High ROI, and Avoiding Blunders
Website speed is important because it can directly affect conversions and traffic. Let's look at some examples from our practice:
- For one of the largest sports results providers, Livesport, we improved their Google Ads positioning through speed optimization, saving significant PPC budget.
- Studies indicate that backend response speed correlates with Google search rankings, thus enhancing SEO. Some of our clients have experienced an increase in traffic following Core Web Vitals optimization.
- On a large e-commerce site, we measured that users experiencing load times around one second had 3.5 times more conversions than those with load times of 2.5 seconds.
Let's examine a graph showing the correlation between speed (LCP, in yellow) and conversion rate (CR, in blue):
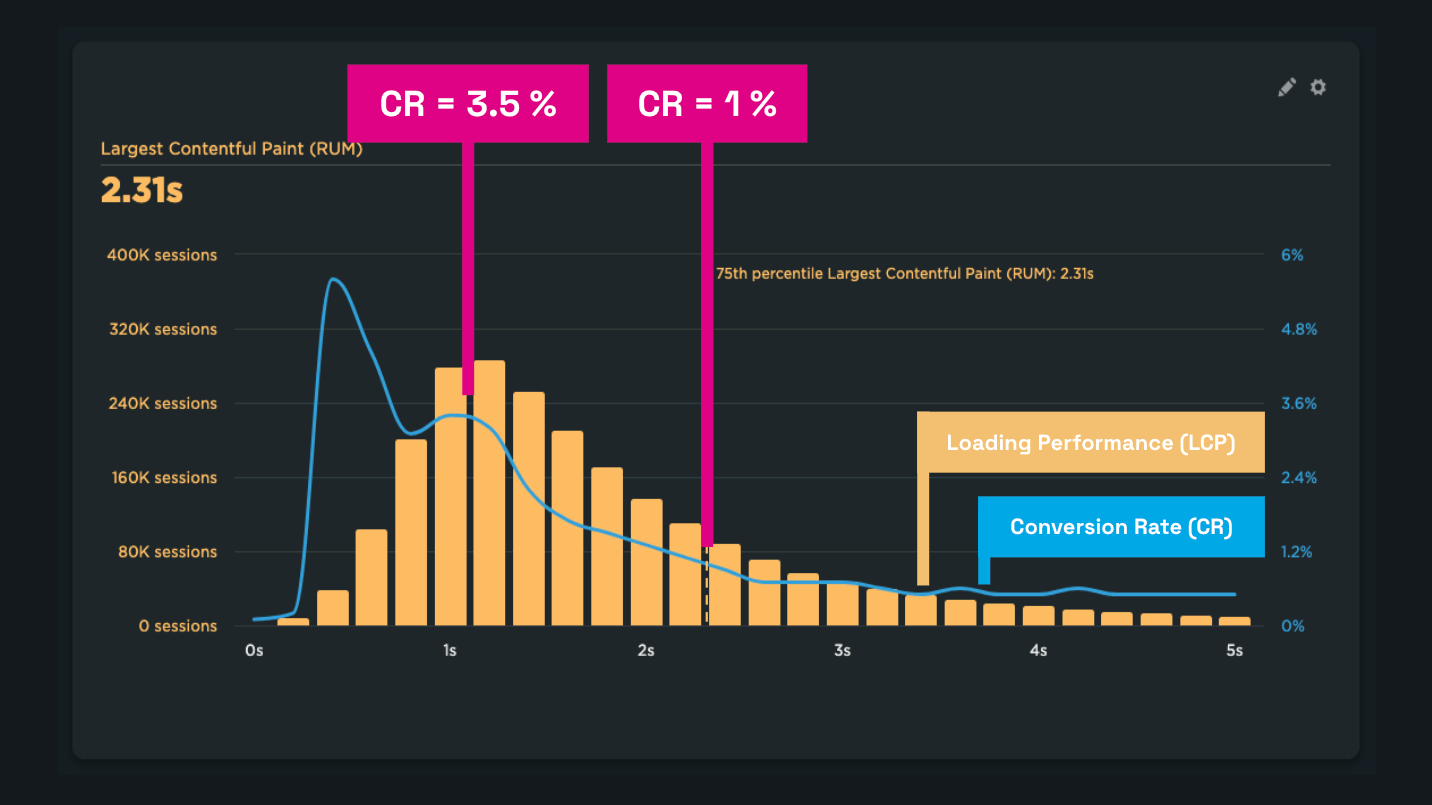 It's often the case that the faster a user experiences a webpage load, the more likely they are to convert.
In all these cases, without data, these successes cannot be achieved or measured. Lack of monitoring often leads to situations where you know there's a problem but don't understand its cause.
Blunders Stemming from Lack of Monitoring
You might think your website speed is stable because you haven't made any changes that would affect it. But usually, the opposite is true.
Website speed constantly changes, often for the worse. In our consulting practice, we've often witnessed that even seemingly innocuous changes can deteriorate Core Web Vitals metrics:
- At our client Innogy, monitoring detected a strange deterioration in the INP metric after deploying Server-Side GTM. Thanks to data from technical analysis, we could direct the client and their analytics suppliers to specific tasks for resolution.
- Monitoring allows us to timely warn our clients, like the e-shop Dr. Max. For example, when the layout stability metric (CLS) worsened due to an error on one of the pages.
- Monitoring showed a deterioration in server response time (TTFB) on a major e-commerce platform, providing our clients with precise data for communication with support.
- In the Czech podcast IT Blunders, there's a story about how, without monitoring data, a team misjudged the cause of a problem and spent two weeks rewriting an application. The issue was merely a single line in the configuration.
If bots are behind TTFB degradation, it's wise to have a strategy. Check out our Strategy for AI Bots service.
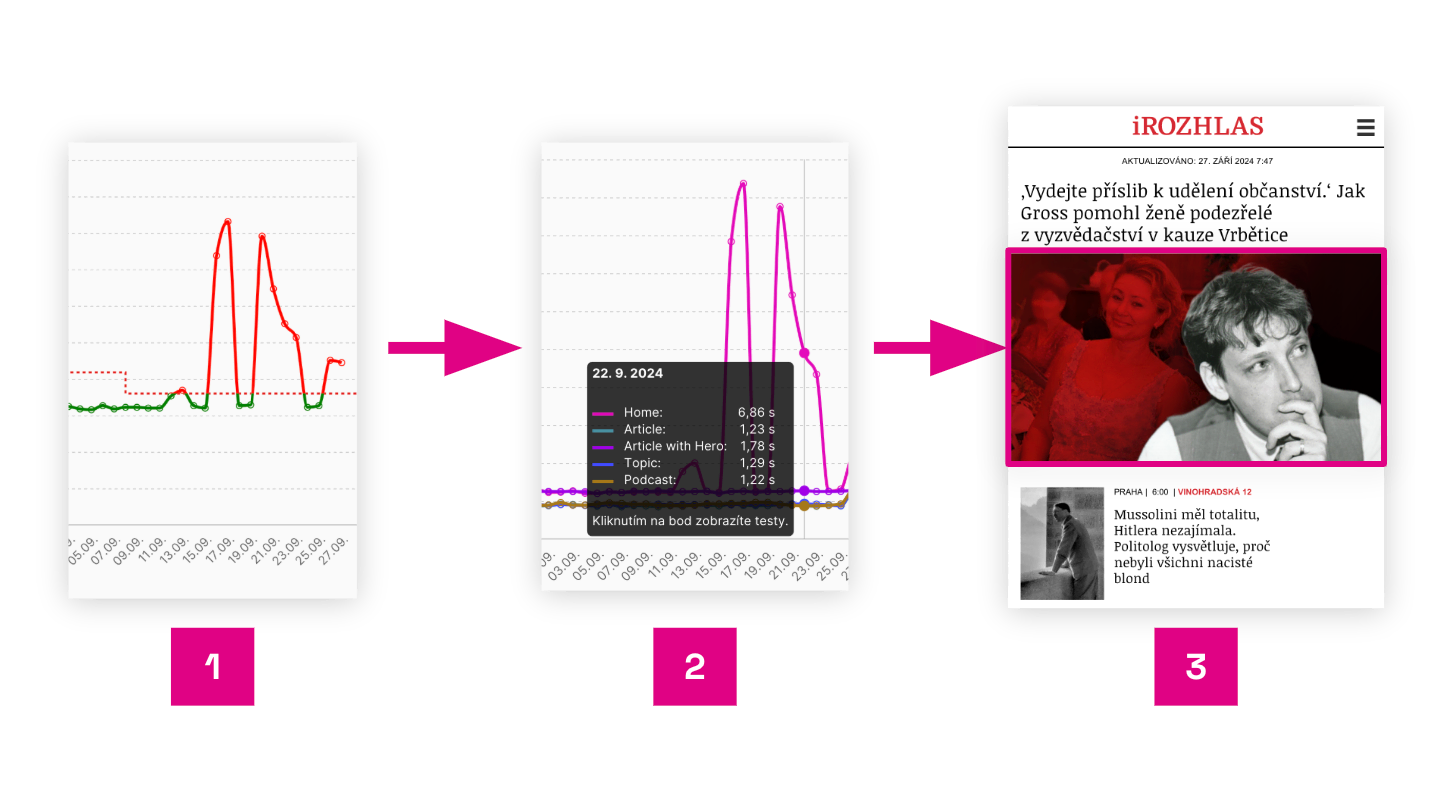 Good monitoring provides data on the causes of changes and guides you to the specific site location.
The image shows a report example from PLUS PageSpeed.ONE monitoring during incorrect image deployment on the homepage of the news site iRozhlas.cz:
- Synthetic data from Watchdog shows an LCP metric issue.
- Viewing the LCP breakdown by page reveals a problem on the mobile homepage.
- Details of a specific Lighthouse test run identify improperly set lazy loading for the first image.
Without monitoring, you won't notice changes. Without monitoring data, finding the cause of deterioration later will be very costly and slow down your work on developing new site features.
One-off Measurement Isn't Monitoring
There are many popular tools like our website speed test, PageSpeed Insights, Lighthouse, or WebpageTest.org that provide one-off metric results and a technical state analysis of a page.
However, don't confuse one-off testing with monitoring. Speed monitoring runs automatically, at least daily, providing data for periods when you might forget to check speed with one-off measurements.
Why isn't it enough to check speed occasionally in PageSpeed Insights?
- You won't learn about most mishaps.
- You lack a data history to reference when needed.
- You can't see the patterns and trends developing in the data.
- You don't have data to guide you to an easy problem solution.
- You can't celebrate improvements when they occur.
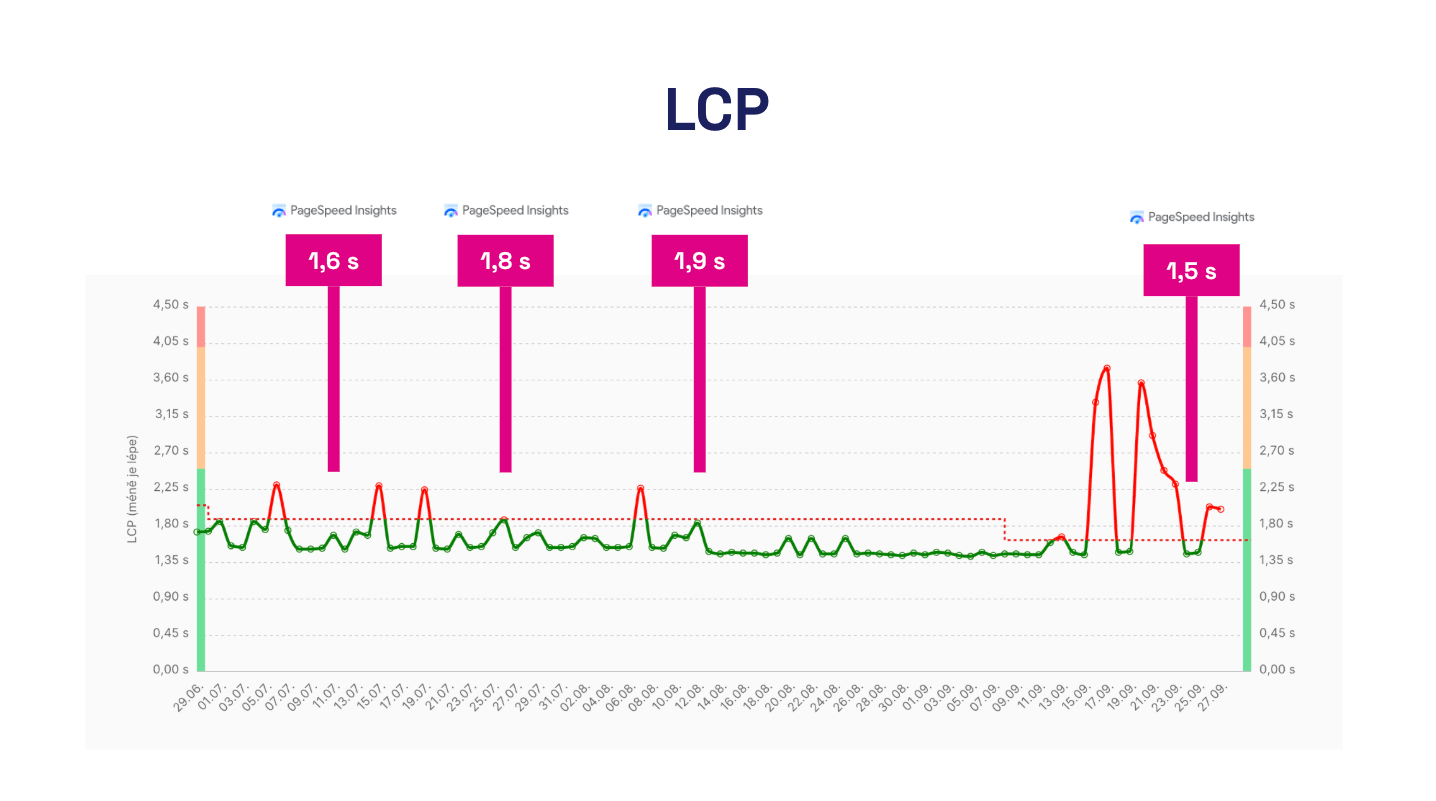 One-off tests in PageSpeed Insights, which you do only when you remember, will likely hide problems and might even mislead you into thinking your website speed is improving.
You're Not in Control of Website Speed, Even if You Think You Are
A fast website is achieved, among other things, by actively preventing it from slowing down.
Unfortunately, decreasing website speed is a common phenomenon rooted in the fact that web development teams typically have far less control than they might think.
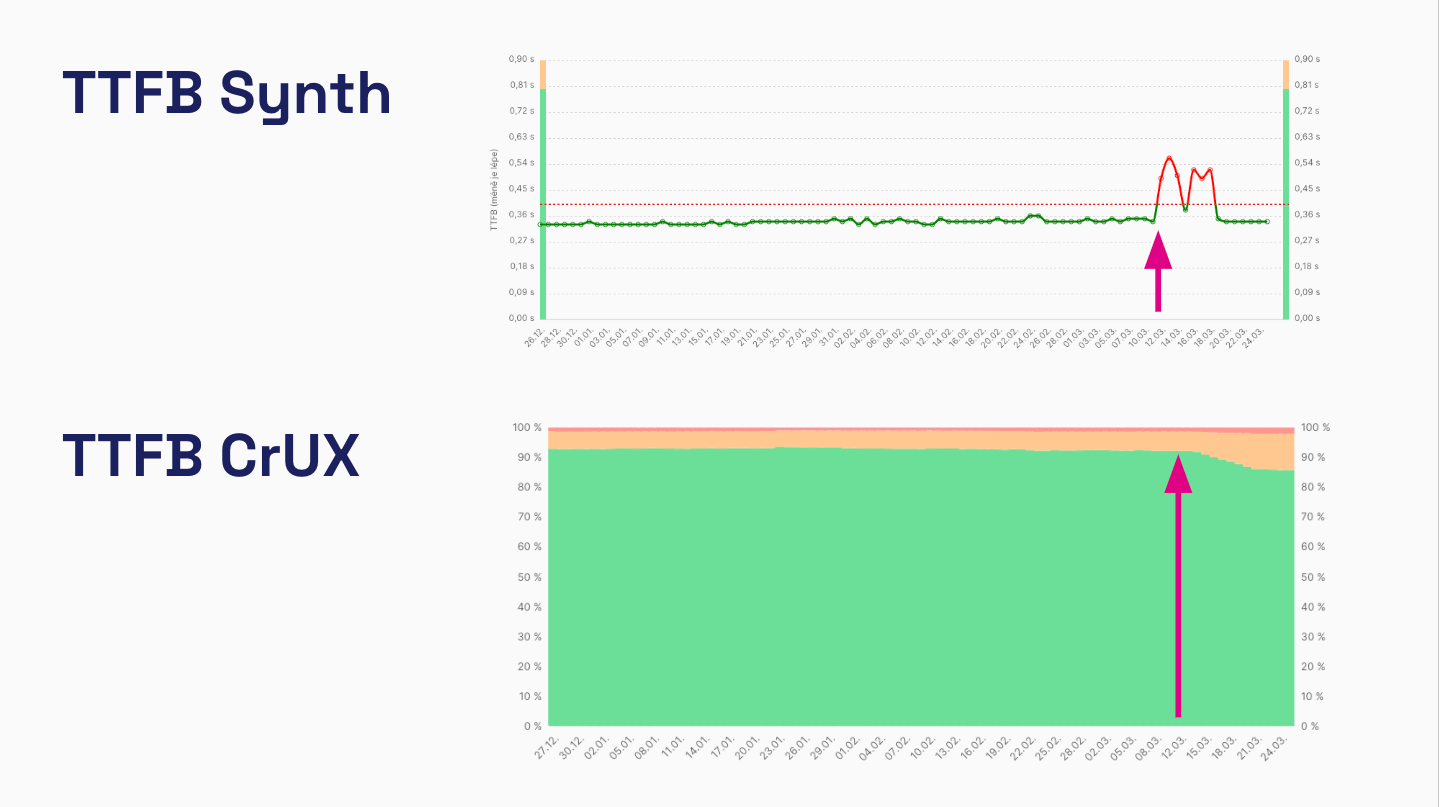 Unexpected server response time (TTFB) deterioration on a major Central European e-commerce platform. Synthetic monitoring warns in advance, CrUX provides a delayed yet more accurate picture of user impact. Now imagine planning a campaign without this information.
Let's look at some examples that demonstrate the complexity of modern web development:
- Websites consist of many parts (client-side, server-side) and components, often managed by different teams.
- Website speed can often be affected by third-party JavaScript code, inserted via GTM by analysts, marketers, or UX people. Often, these are external vendors.
- Third-party components themselves (analytics, advertising, personalization...) develop without your control and may further degrade website speed during development.
- Website speed can be impacted by one-off events like a successful marketing campaign or a DDoS attack targeting your infrastructure provider.
- Changes in speed may stem from shifts in user base distribution. Your campaigns might reach a new audience, such as users with slow Android devices, which can suddenly worsen Core Web Vitals metrics.
- Websites naturally evolve over time, continually deploying new content or features. Even those that seem harmless can negatively affect speed.
This complexity affects even relatively small websites today. Web Performance is a multidisciplinary field requiring communication and agreement among many different parties.
From our experience, speed monitoring provides clear data that prevents unnecessary team conflicts and highlights specific problems.
Monitoring Offers Excellent Return on Investment (ROI)
In our work on website speed optimization for small and large clients, we require speed monitoring as a mandatory first step for collaboration.
Few things in the field of website speed offer as good a return on investment (ROI) as monitoring.
For a few dollars a month, we prevent complex problems, investigations, and team disputes that can cost hundreds and thousands of dollars.
Different Types of Monitoring: You Need Availability, Synth, and User
We often encounter confusion between different types of website monitoring.
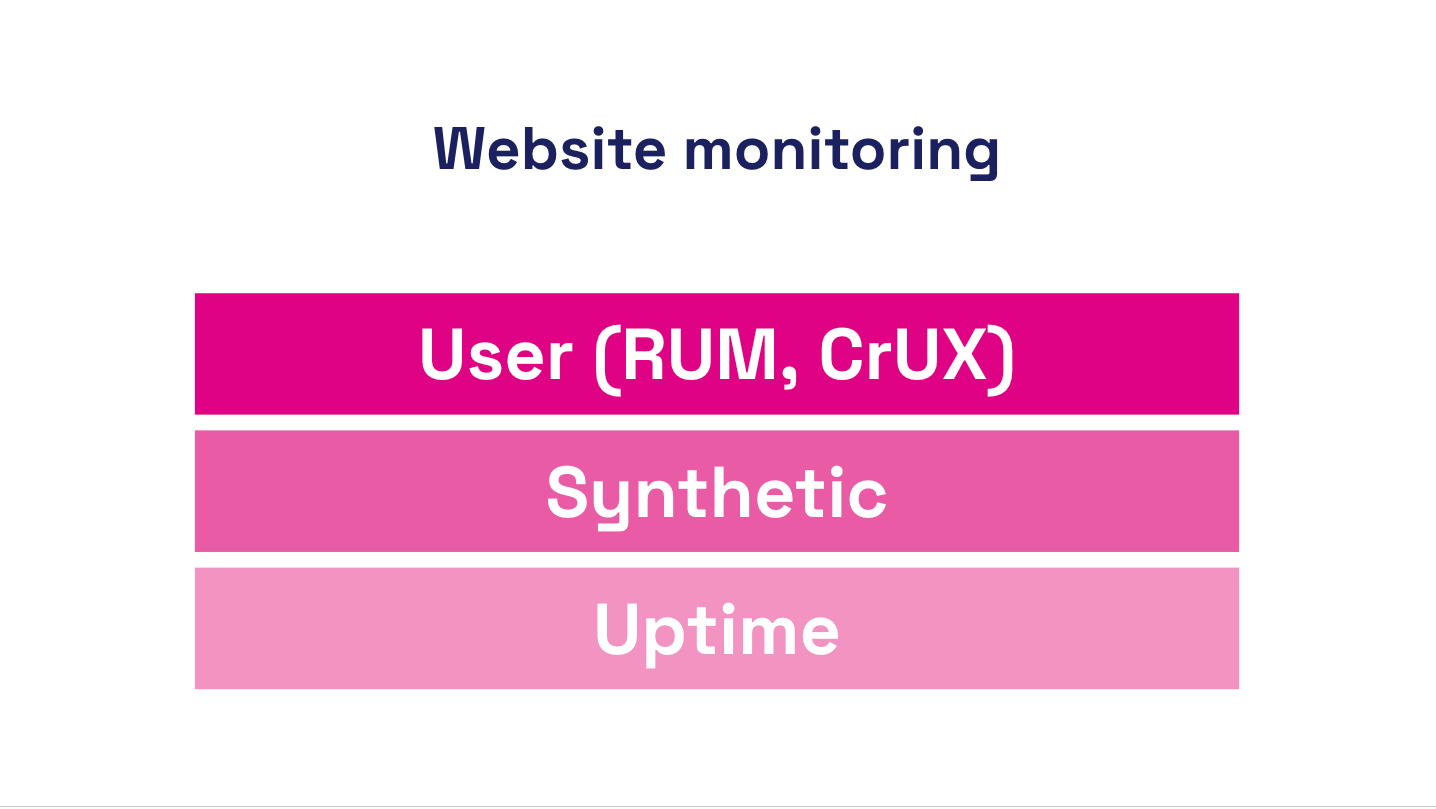 For successful website operation, you need at least three types of monitoring: availability, synthetic, and user.
Let's clarify:
Availability Monitoring
Answers the question: “Does a robot see if your website is running?”
Availability monitoring ensures your site is operational every hour, minute, and second of the day. This type of monitoring focuses on technical indicators and scans hosting and infrastructure.
Examples of this type of monitoring include UptimeRobot or BetterStack.
Synthetic Performance Monitoring
Answers the question: “How does a robot perceive your website's speed?”
Now we're in the realm of speed monitoring. Synthetic monitoring tests the website at specific intervals using software like Lighthouse or WebpageTest. It returns website speed metrics, but they may not match the user experience (limited CLS and INP metrics) or may show distorted values for other metrics.
Users might experience the website differently than a machine tests it. The advantage of synthetic monitoring is in very detailed technical data. It also allows for relatively frequent testing, providing timely warnings if changes occur on the site.
Examples of this type of monitoring include Pingdom or GTmetrix, although they unfortunately target outdated technical metrics. Our PLUS monitoring also measures synthetically but focuses on Core Web Vitals metrics and adds a user perspective.
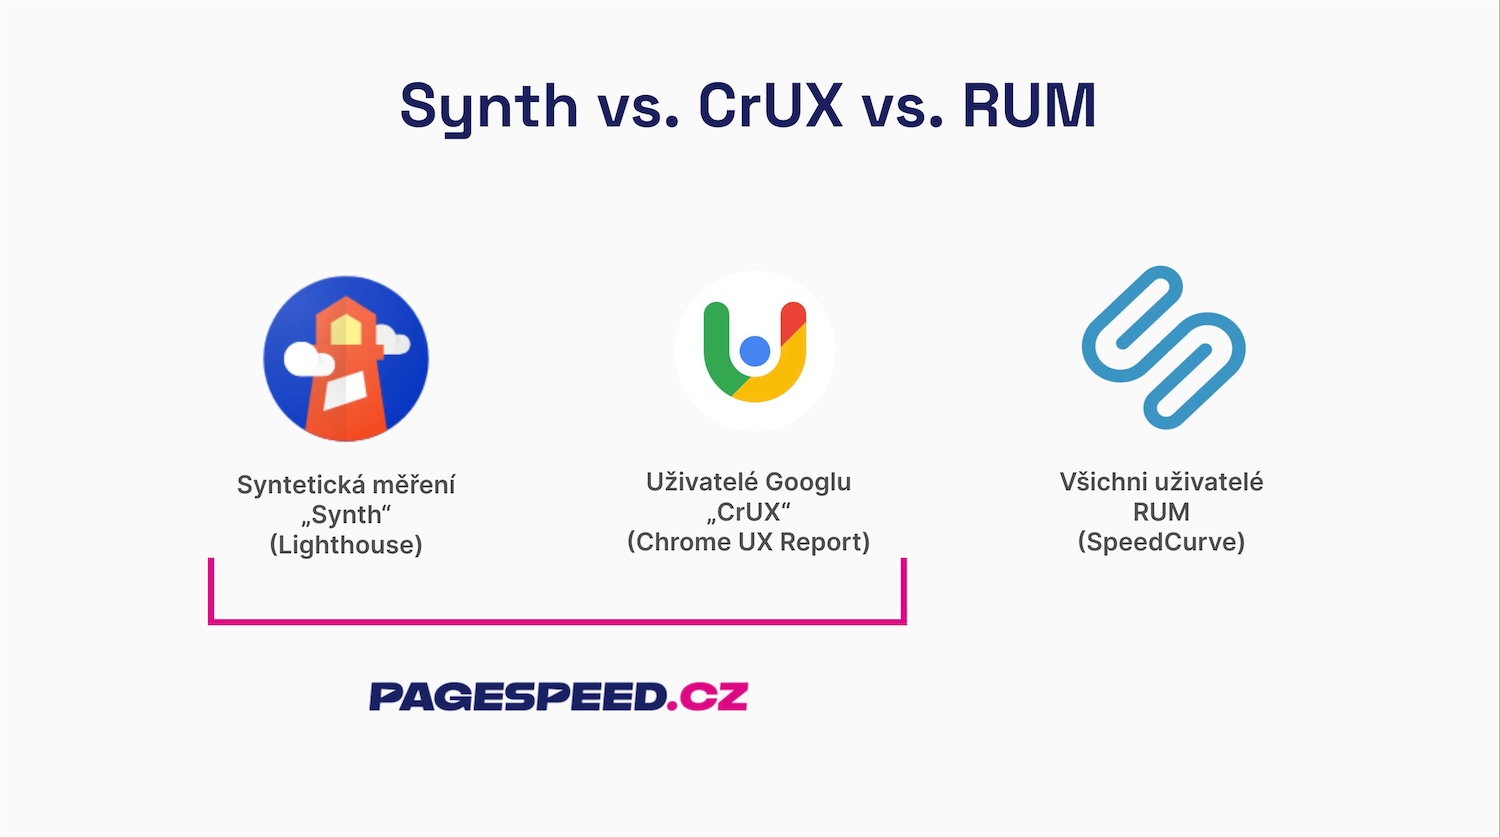 We believe every website needs synth and CrUX speed data monitoring. RUM is essential but primarily for larger websites.
User Performance Monitoring
Answers the question: “How do users perceive your website's speed?”
Core Web Vitals and other metrics allow you to see the technically measurable part of user experience (UX) on large data sets.
User measurements come in two types:
- Chrome UX Report (CrUX) – Google provides data from all Chrome users for domains or URLs with sufficiently high traffic. The downside is data aggregation (always showing the last 28 days) and thus some delay and insufficient detail. However, the advantage is that Google provides this data for free. Core Web Vitals metrics from CrUX also determine how Google evaluates your domains and URLs for search results (SERP) or Google Ads.
- Real User Monitoring (RUM) – metrics are collected from all users via custom JavaScript measurement. The advantage is that measurement isn't limited to Chrome, data is available without delay, and in detail you define. RUM monitoring can also be deployed on apps hidden behind logins. The downside is data complexity, cumbersome measurement setup, and often higher solution costs.
User measurements are, of course, ideal because we're interested in the actual experience. The downside of user measurements is that they're not always immediately available and don't always provide sufficient technical detail. Therefore, in our PLUS monitoring, we combine user measurements with synthetic data.
Let's summarize what we've covered in this section. Availability monitoring only checks if the site is functioning. Synthetic performance monitoring measures speed during machine loading. User performance monitoring then provides data on the experience of actual users. Ideally, all these types of monitoring should be in place.
Tip: Check out our comparison of different measurement types – synth, CrUX, and RUM.
Speed Monitoring by Target Audience
An interesting aspect of monitoring is that different target audiences need different performance data:
- Developers – besides website speed status for users, need change notifications, diagnostic data like technical metrics, which guide them to problem causes and optimization opportunities. Availability monitoring should also be a given.
- Website owners, marketers, UX designers, and others – need to see the current speed status, receive regular reports, and possibly change notifications. Ideally, the tool should also show the relationship between speed and business.
- Marketing and development agencies – besides the above, need the ability to manage access to multiple projects, receive regular reports, and view the status of various projects in one place.
Check out our text on how monitoring is useful for development agencies.
Always demand from your monitoring tools what aligns with your goals.
Our Methodology: How Do We Approach Performance Monitoring?
With many years of experience advising on website speed for small and large clients in Central Europe, we've developed a methodology for setting up speed monitoring, which we now present to you.
CrUX as a Foundation and Speed Score (SPS) as a Key Indicator
We consider Core Web Vitals to be very good speed metrics, and data from Google's Chrome UX Report (CrUX) to be a valuable gift for all website operators.
Metrics LCP, INP, and CLS are certainly not perfect, but they well reflect different parts of the user experience. CrUX data isn't ideal for all measurement cases, but it's a sufficient foundation for any reasonably large website.
Core Web Vitals from the Chrome UX Report also have the advantage of providing data for both main reasons to optimize for speed – user experience (UX) and Google traffic (PPC, SEO).
For clients, in our monitoring summary, we always first show the current figures for these metrics:
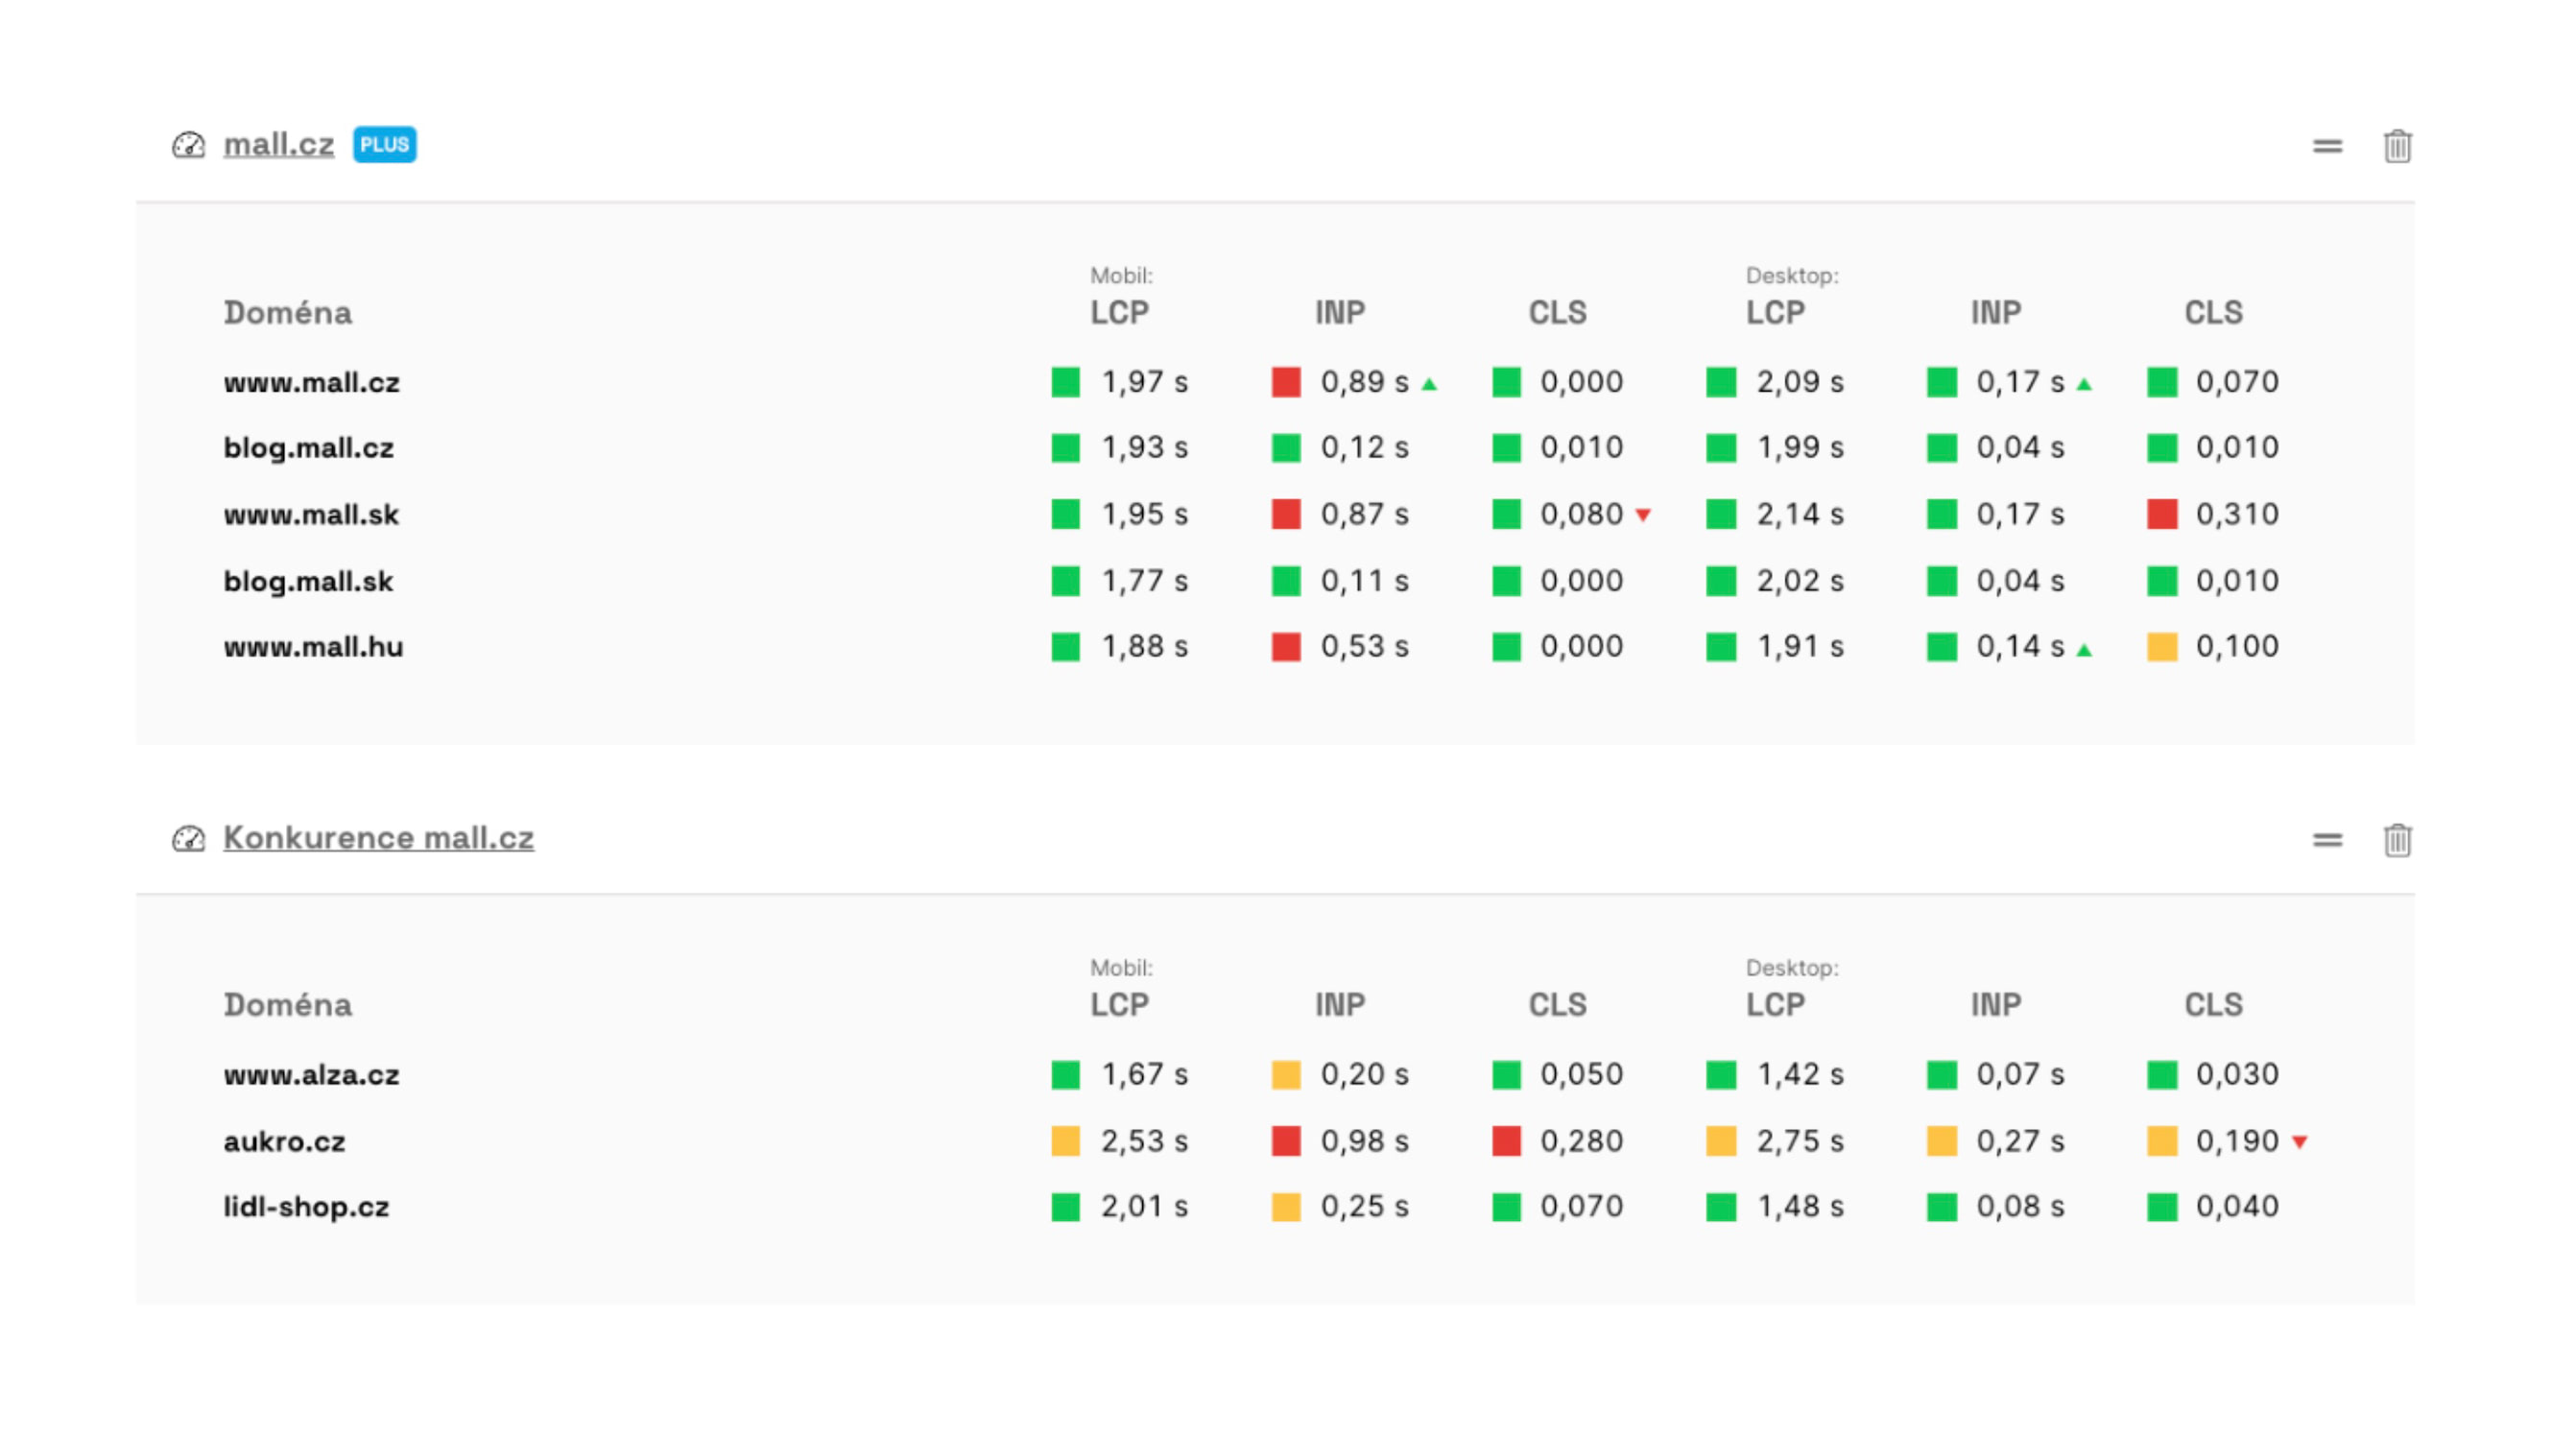 As you can see, our monitoring also provides information on metric development.
There are three metrics, and they need to be tracked for two different devices, so users often have to remember six different metrics across many domains.
That's why we've experimentally introduced a score in our monitoring that unifies these six figures into a single value, which we call PageSpeed.ONE Score (SPS):
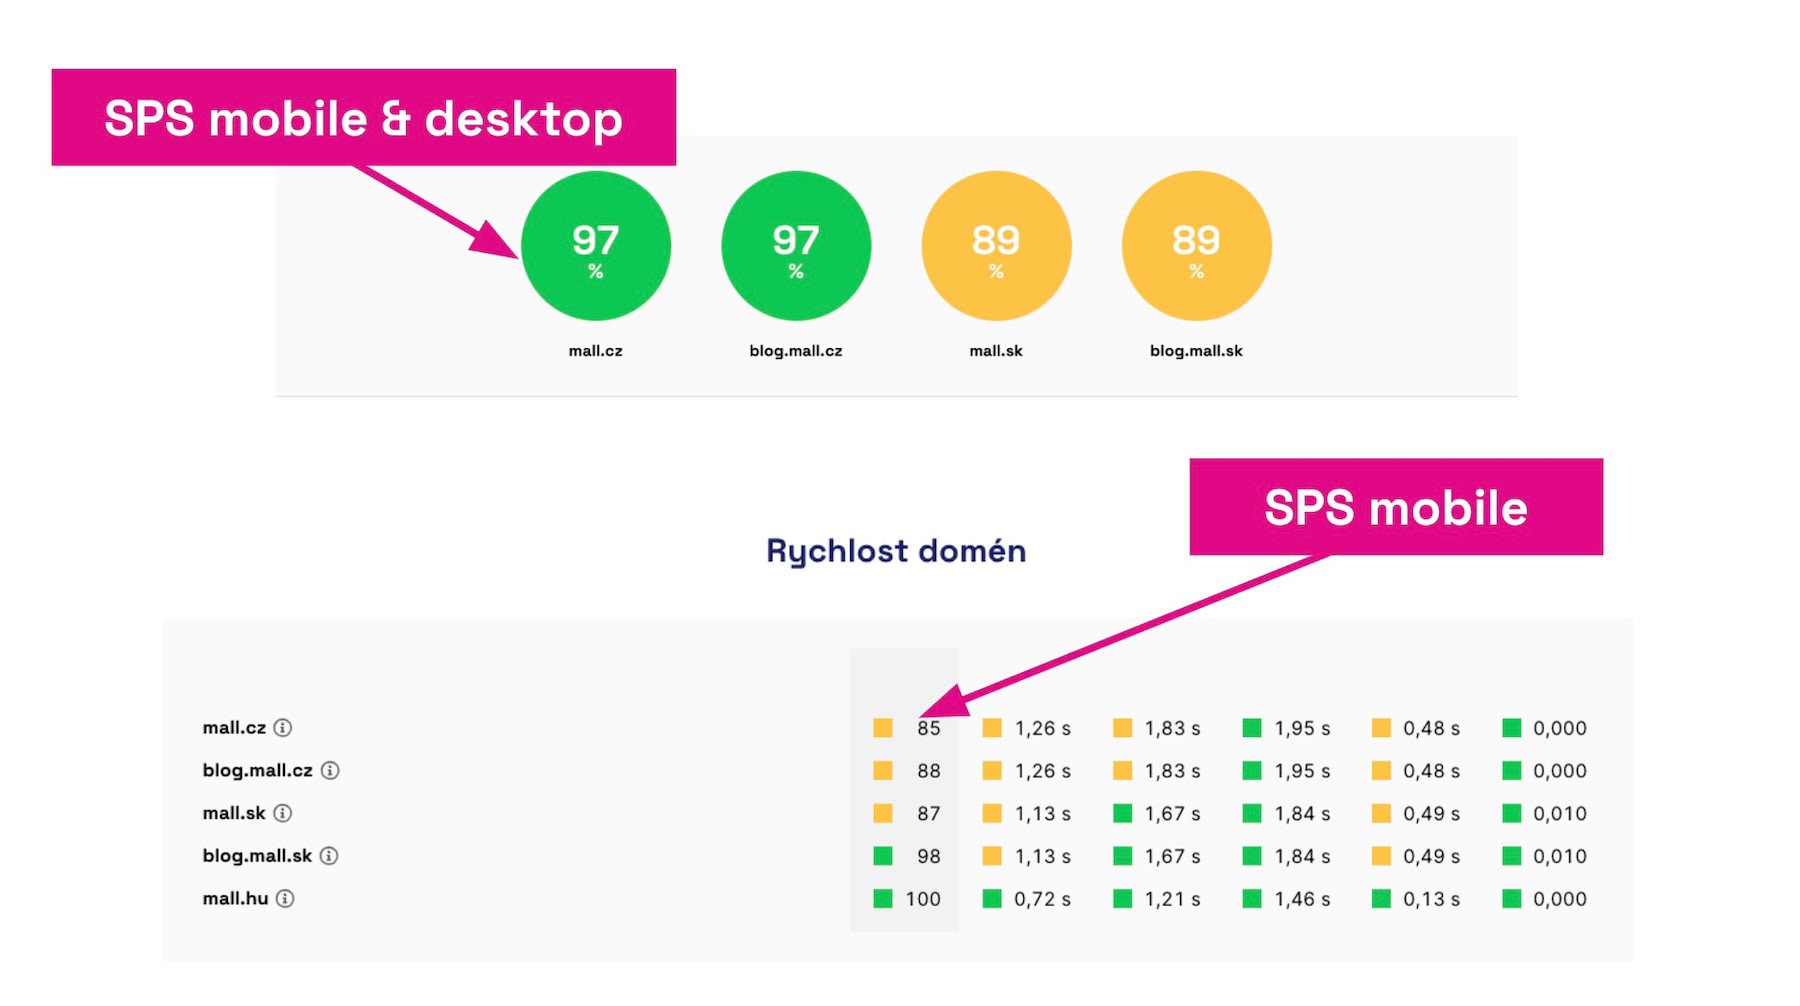 The Speed Score (SPS) helps quickly summarize the current website speed status.
For smaller websites, it may happen that the client's domain doesn't have enough data. In such cases, synthetic measurement is necessary.
Synthetic Measurements Once Daily
Synthetic testing using Lighthouse is a necessary complement to CrUX data from users. Data is available for virtually all websites, and we always get current metric values.
We experimented with running tests multiple times a day but ultimately settled on once-daily testing with a three-day cycle for possible warnings through Watchdog.
The reason is that practically all our clients work on speed optimization rather in weekly to monthly intervals. Warnings about fluctuations within hours or minutes always overwhelmed them more than they wanted. We've observed that this is how practically everyone works on website speed.
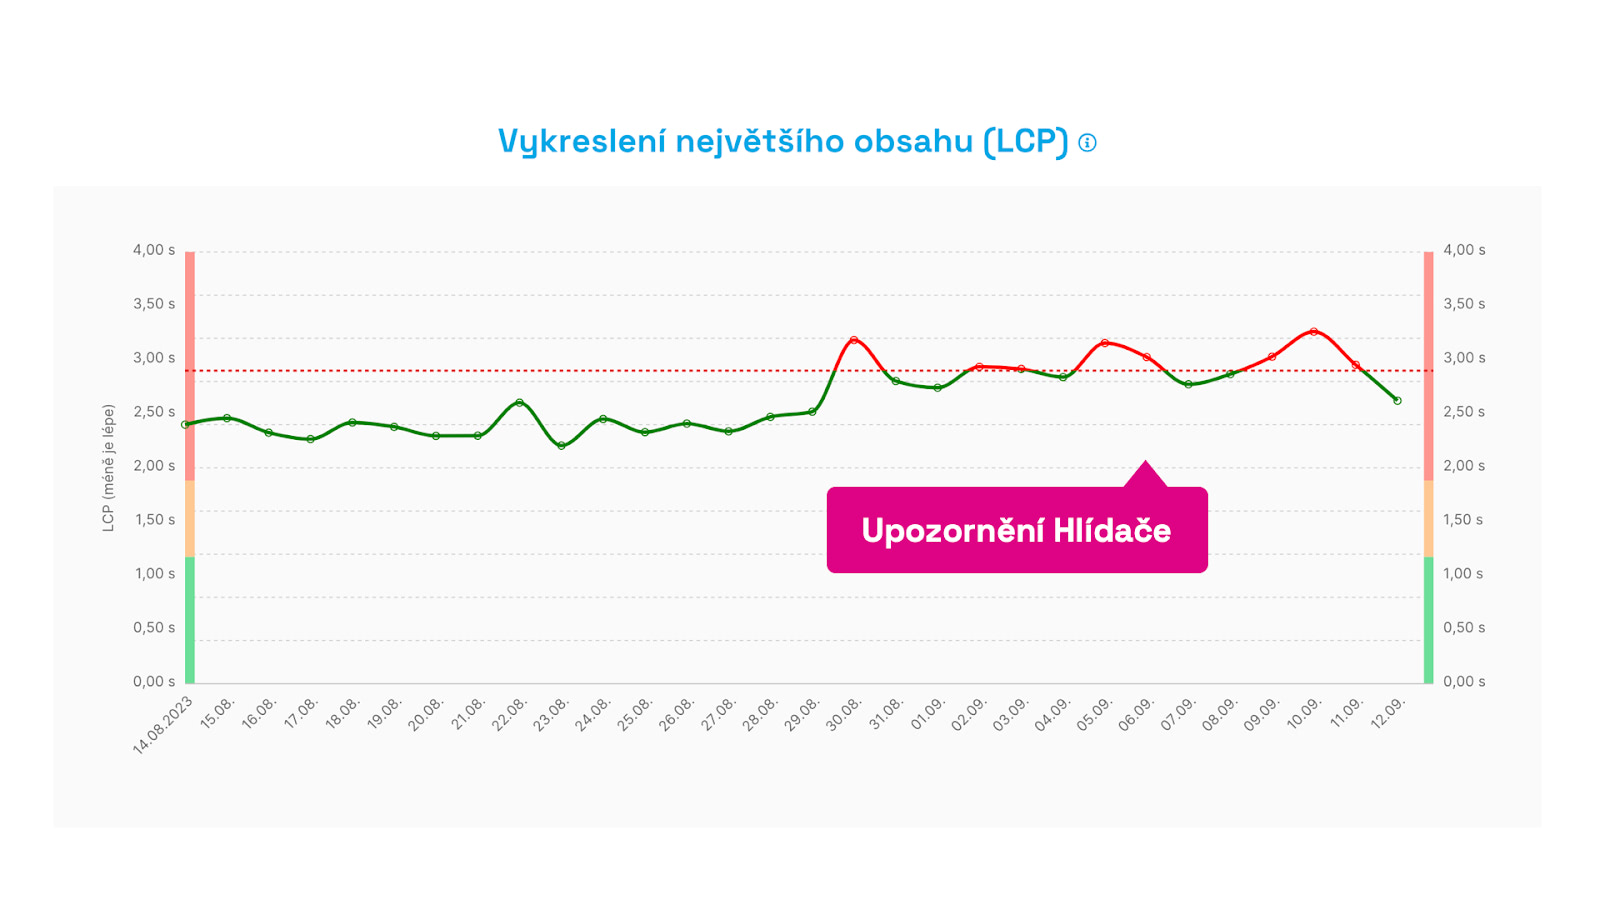 Watchdog alerts are not sent in the event of a single fluctuation but only after three days when we're sure.
For more detailed measurements on larger websites or during speed fluctuations (Black Friday and other seasons), we temporarily enable RUM measurement for clients.
RUM Monitoring for Larger Clients or During Optimizations
Having data from all users (RUM) sounds appealing, but as we've indicated, it often leads to data overload and an inability to properly evaluate it. RUM measurement isn't easy to set up correctly, especially for SPA applications, and it's not exactly cheap.
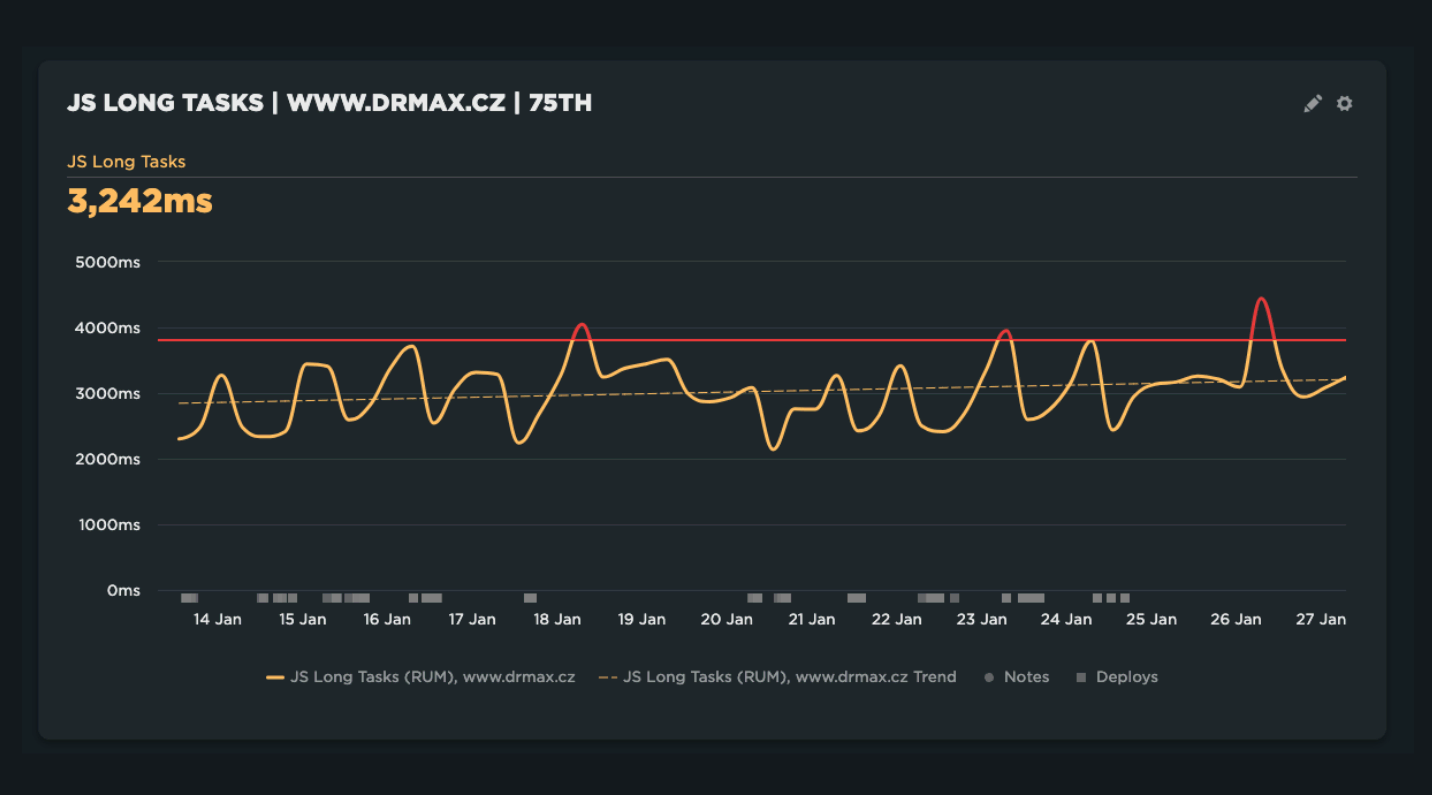
We offer our clients help with implementing SpeedCurve RUM, and we enable these measurements for smaller clients when we're intensively working on optimizations or when a season that could impact website performance is underway.
We also recommend RUM measurement to anyone monitoring private web applications, such as SaaS (Software as a Service).
Where to Monitor: Production Server, Staging...?
We often face the question of where to run monitoring. Just production? Staging or test servers? Locally during development or within the CI/CD pipeline?
Ideally, the answer is: monitor speed at all levels.
However, in practice, this ideal state encounters many problems. The first is the instability of staging environments, which often don't even match the actual website in terms of data or settings. In this, a so-called pre-production environment is better, but not all companies have it.
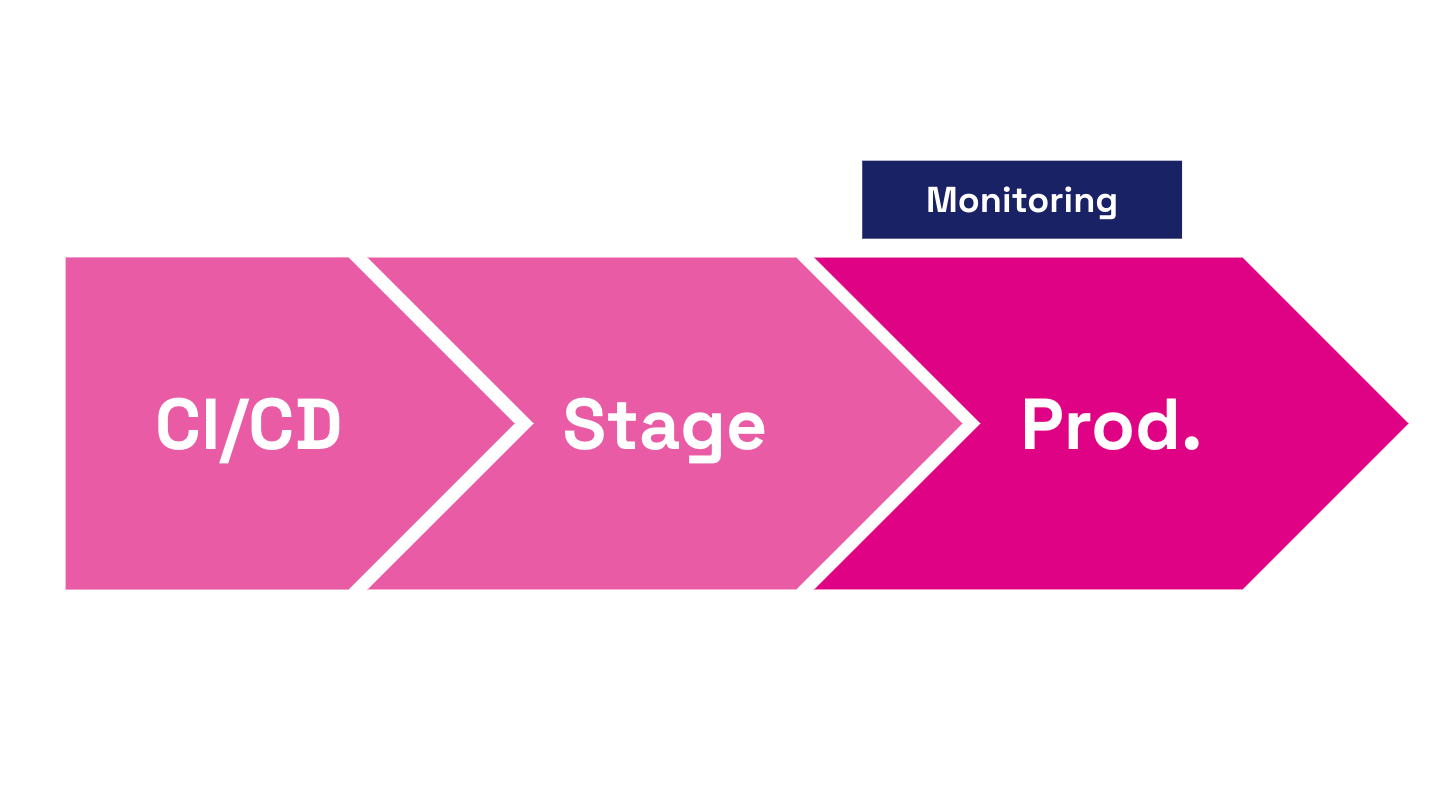 Ideally, have monitoring everywhere, but in any case, always on production websites.
CI/CD pipeline or testing on localhost is also important, but developers and testers don't have user data (CrUX or RUM) available at this part of the process. Again, we encounter localhost instability, so even synthetic tests often don't provide comparable numbers.
The pragmatic answer to the question of where to have monitoring is: primarily on the production server.
However, adjust your development cycle so you can quickly roll back problematic releases or fix issues with hotfixes.
Pay Special Attention to Notifications
You'll recognize good performance monitoring by its ability to communicate well with you.
Monitoring applications often send nonsensical notifications, false negative messages, leading to so-called alert fatigue, causing notifications to be ignored.
Performance monitoring applications also often require manual setting of so-called Performance Budgets (limit values for individual speed metrics). This again requires attention and time from someone on the client's side.
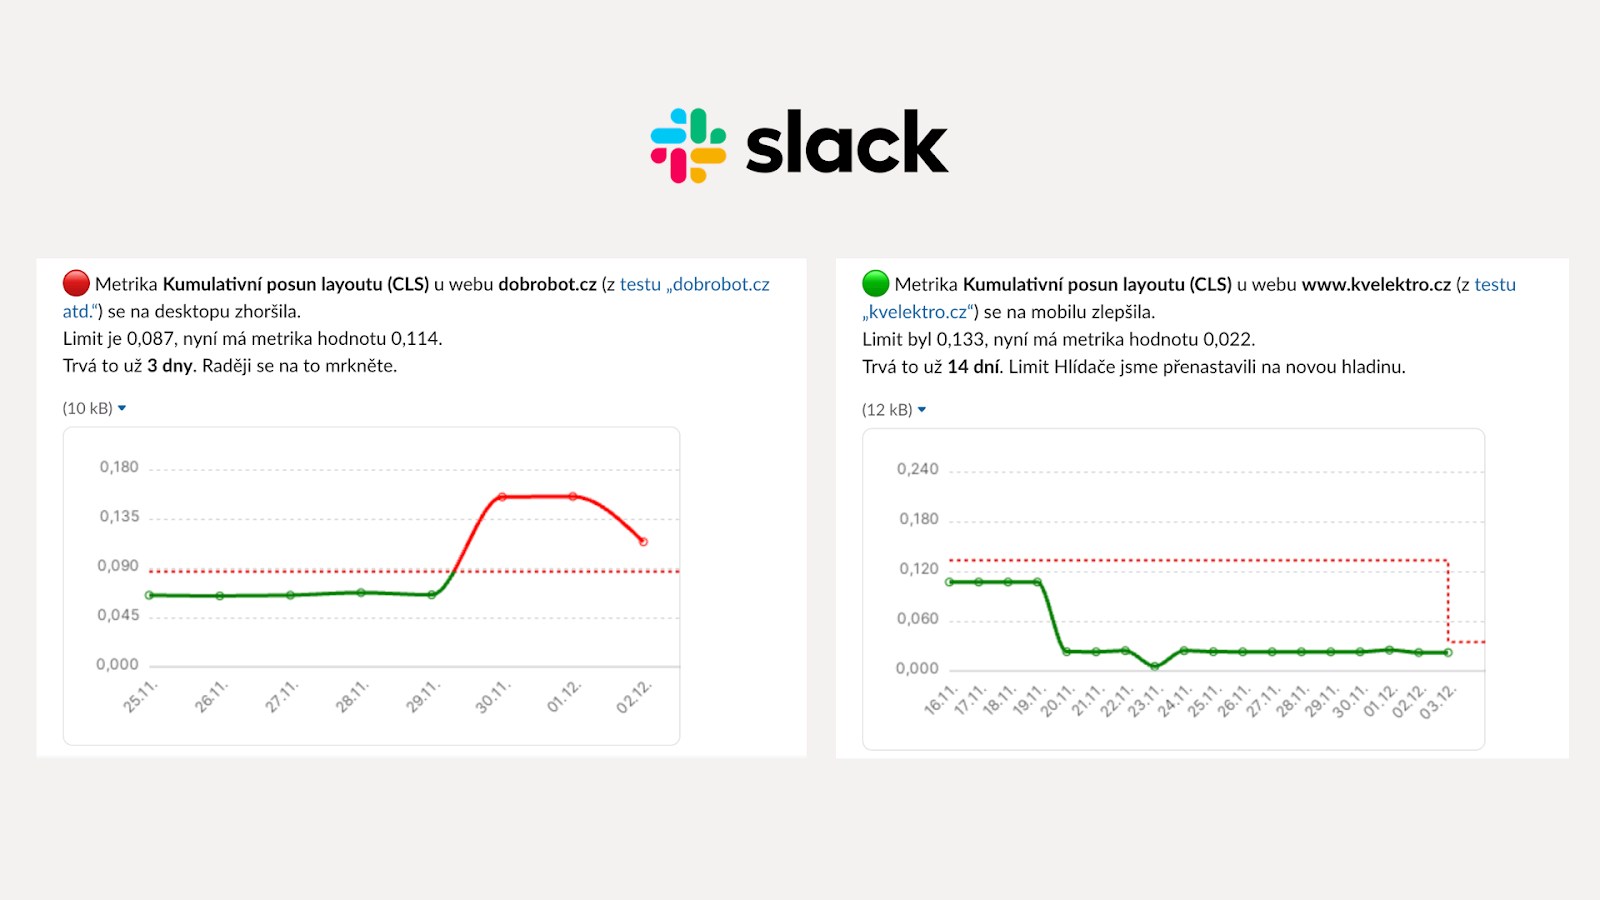 Watchdog alerts can be received in Teams, Slack, or email.
We've designed our Watchdog alerts to eliminate both problems. So, notifications are only sent if the deterioration isn't a one-off.
The limits for individual metrics are then set automatically according to best practices we've developed over many years of speed consulting.
We also provide our clients with know-how on how to evaluate Watchdog alerts and the technical data needed to find the cause of metric changes.
In Conclusion
If you don't measure, you don't improve. That's a phrase you should remember.
If you consider website speed important, rush to set up some Core Web Vitals monitoring.
It's worth it because the annual costs of a tool that helps you find errors are a fraction of the costs of detecting errors blindly and without data.
Speed Monitoring PLUS
Try our monitoring app free for a month.
5,400 CZK annually per website. Invoice only, no credit card needed.
Speed optimization isn't a sprint; it's a marathon, a continuous effort to improve website UX or positions in SEO or PPC. Speed optimization is a marathon, where you'll need a partner with data in their pocket, which speed monitoring can become.
Case Study of Svět Svítidel Redesign
Read about how measurement data helps in the real world in the case study of the Svět Svítidel redesign. For clients with stable speed, we measure using PLUS monitoring only synthetically and with CrUX data from Google. In cases of significant changes, however, we conduct detailed measurement from all users (RUM), which we did shortly before the redesign launch, providing real-time data.