Report "Summary"
 Martin Michálek8/19/20254 minutes reading
The introductory page, known as the "Summary", provides a quick overview of the current state of web speed across various contexts and types of measurements:
- From measured domains to specific pages.
- From speed for Google users (Chrome UX Report, CrUX) to synthetic measurements.
The "Summary" page offers an immediate snapshot of the state and also highlights where optimization priorities lie.
Speed Data in Tables
For each tested domain and URL, we present available speed data in a clear table that many of our users have come to appreciate:
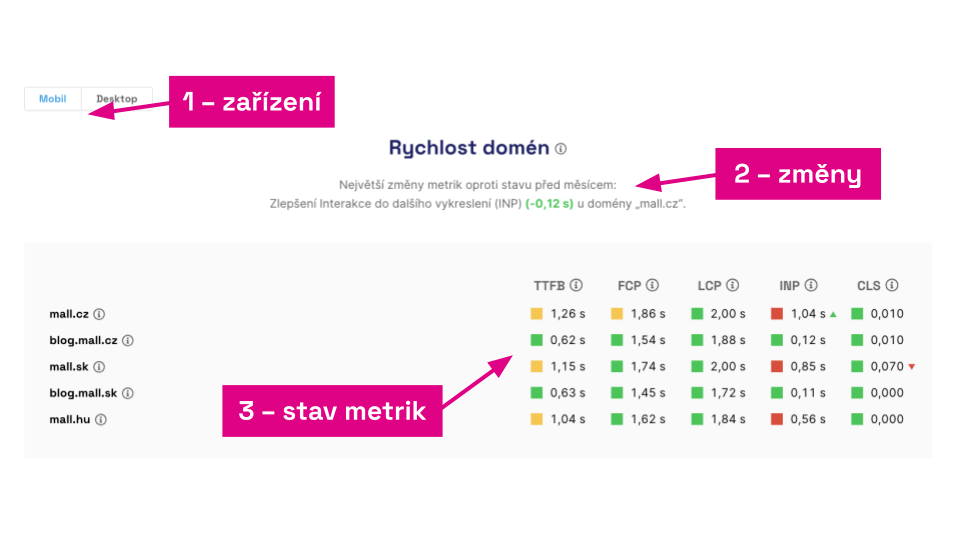 Data of all essential metrics for Mall.cz in a clear format.
As you can see in the image, we display all the Metrics that are part of the Core Web Vitals set or auxiliary metrics to them, available from Google in the Chrome UX Report.
This is useful for immediate comparison of your website speeds or potential comparison with competitors.
Metric Changes in Graphs and Text
In all cases, next to graphs, you'll find a textual summary of the current state and changes over the past month. You can see this under point (2) in the image above.
Our users have grown fond of the arrows in the dashboard that indicate the metric's trend compared to the previous month. This is also available directly in the "Summary" report, but naturally, only if you've been measuring for at least a month.
If you monitor your website's speed regularly, this display quickly shows you the state and what is changing, and what to watch out for.
Specific Tables in the "Summary"
Let's take a closer look at the specific sections of the page and what they can be useful for.
Domain Speed
The most crucial view of speed, as it shows the state of the entire website for users. The data is from Google's Chrome UX Report. You see the 75th percentile of data from all Chrome browser users over the past 28 days. Not every domain has data from Google, as it's determined by monthly traffic. More details are in the Domains report.
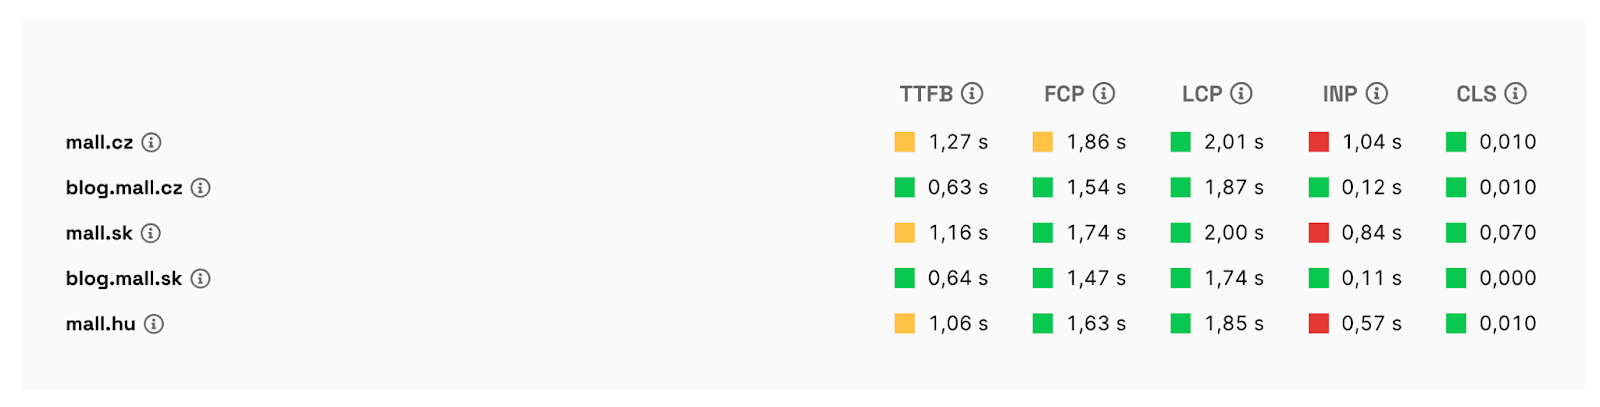 Domain speed status.
Watchdog
The state of daily synthetic measurements of all pages. Here, we're not interested in the specific Metric value, but changes for the worse that persist for three or more days. If a metric meets the limits, it's green; currently non-compliant is red. In settings, you can arrange alerts for changes in state via email, Slack, or Teams. More details are in the Watchdog report.
 When the Watchdog is green, all is well.
🔐 Watchdog is a feature available only in PLUS tests.
Page Speed for Users
Here you'll see the speed of specific measured pages. The data is again from Google's Chrome UX Report and shows the 75th percentile of data over the past 28 days from all Chrome browser users. These data are available only for the most visited URLs. Even the largest websites have data for only a few dozen pages.
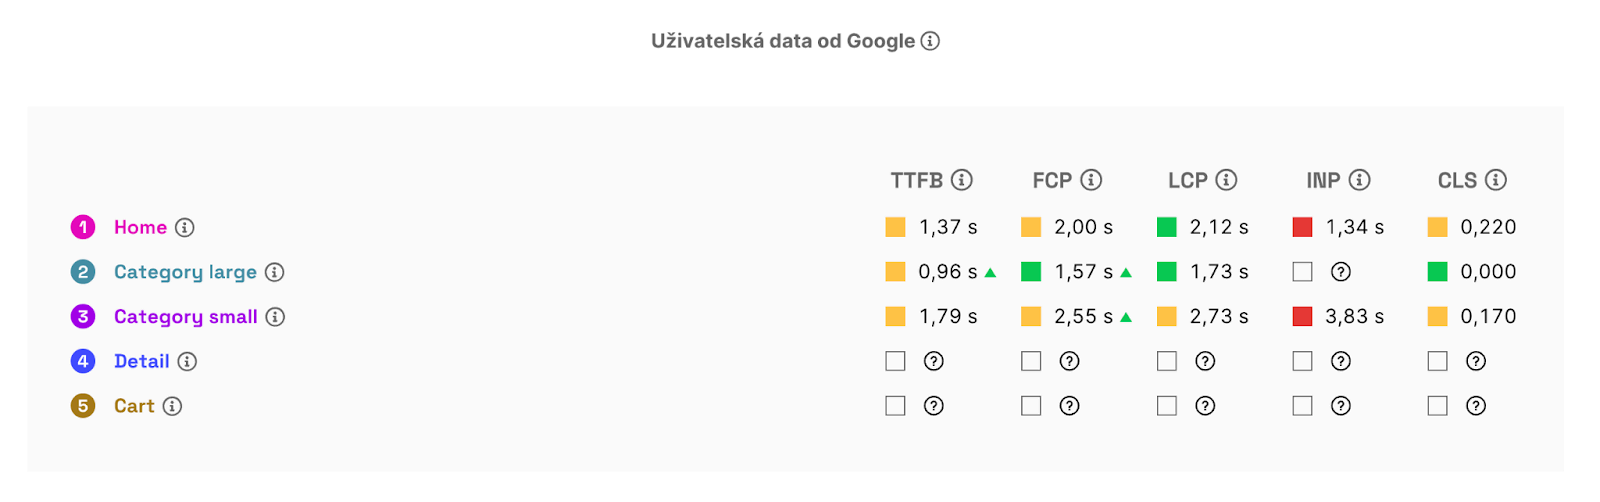 User data might not be visible for all measured URLs.
Page Speed from Lighthouse Measurements
Data from Lighthouse tests. It's less precise machine measurement but provides more metrics, and we usually have data for virtually every page. From an optimization priorities perspective, these are the least important data, as they often don't match user measurements. They are values for monitoring and optimization needs, not target metrics.
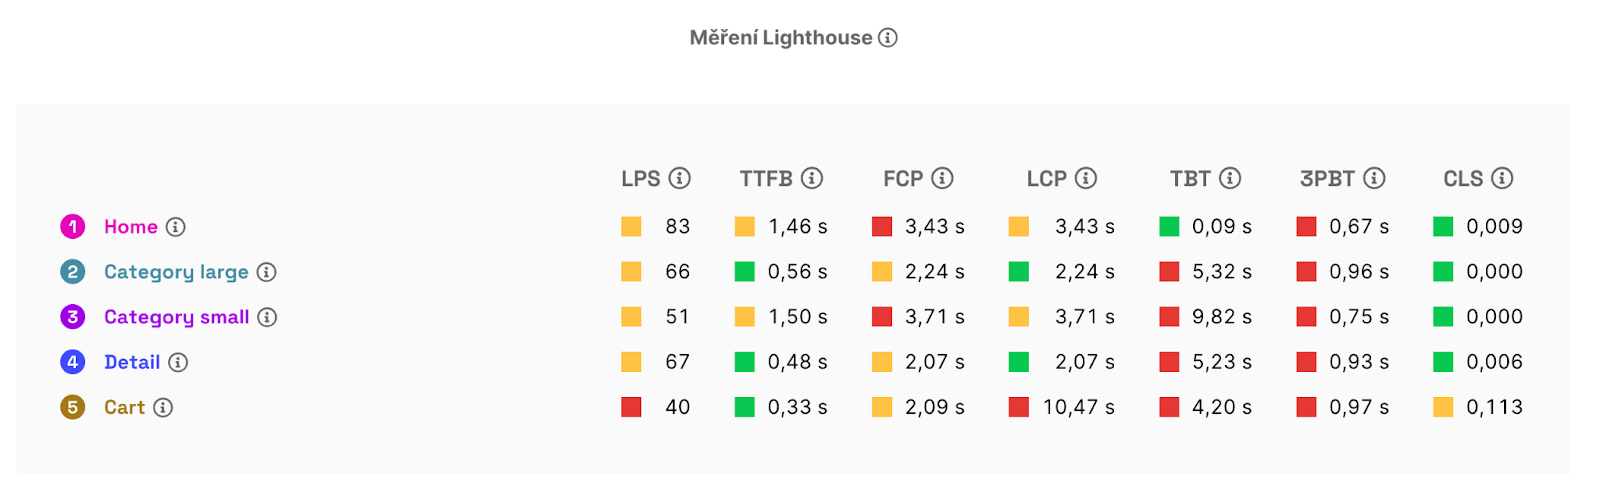 Metrics from Lighthouse can be seen for all pages, but they're not as precise.
How to Read the "Summary" Report for Optimization Planning?
Here are a few tips on how to think about the data:
- The most important thing is having green values for Core Web Vitals, namely LCP, INP, and CLS, at the domain level. If your website doesn't meet these metrics in the "User Domain Speed" graph, focus primarily on them. Optimize the red ones first, then the orange ones.
- The "User Page Speed" graph (if it contains data) or the "Synthetic Page Speed" graph shows the state of metrics for individual pages. Again, focus on meeting the three Core Web Vitals, and prioritize the red metrics.
- Remember that Lighthouse measurement data ("Synthetic Page Speed") are only indicative and may not reflect how real users experience your site.
- If you don't have enough user data for pages, focus more on the Core Web Vitals report in Google Search Console than on synthetic data. It will show you groups of URLs that may be problematic for your users. How to read it can be found in the Google Search Console and Core Web Vitals guide.
A detailed view of your websites' speed can then be found in specific reports, such as “Pages”, “Domains”, and others.
Speed Monitoring PLUS
Try our monitoring app free for a month.
5,400 CZK annually per website. Invoice only, no credit card needed.