Speed Monitoring: Why Every Development Agency Should Have It
 Martin MichálekUpdated 9/29/20258 minutes reading
Website speed impacts conversions, SEO success, and PPC costs. By utilizing monitoring, development agencies can guarantee clients regular hours for speed optimization or offer new service packages.
In this article, we'll explain why speed monitoring is beneficial for development agencies and what our Speed Monitoring PLUS has to offer.
Why Accelerate and Monitor Websites?
How does website speed benefit your business?
- Increased conversion rates.
- Improved Google SEO rankings.
- Reduced PPC costs in Google Ads.
In one large e-commerce site, we measured that users experiencing load times around one second had a 3.5 times higher conversion rate than those with load times around 2.5 seconds.
TIP: Read more about why speed matters and why speed monitoring is crucial.
If you don't measure, you won't accelerate. Monitoring is the essential first step in addressing website speed:
- It alerts you when things go wrong.
- It provides data for targeted optimizations and improvement tips.
- It gives you feedback after implementing changes.
Occasional speed tests in PageSpeed Insights might give you the impression that everything is running smoothly. However, you need long-term monitoring of speed metrics to catch issues and keep you informed.
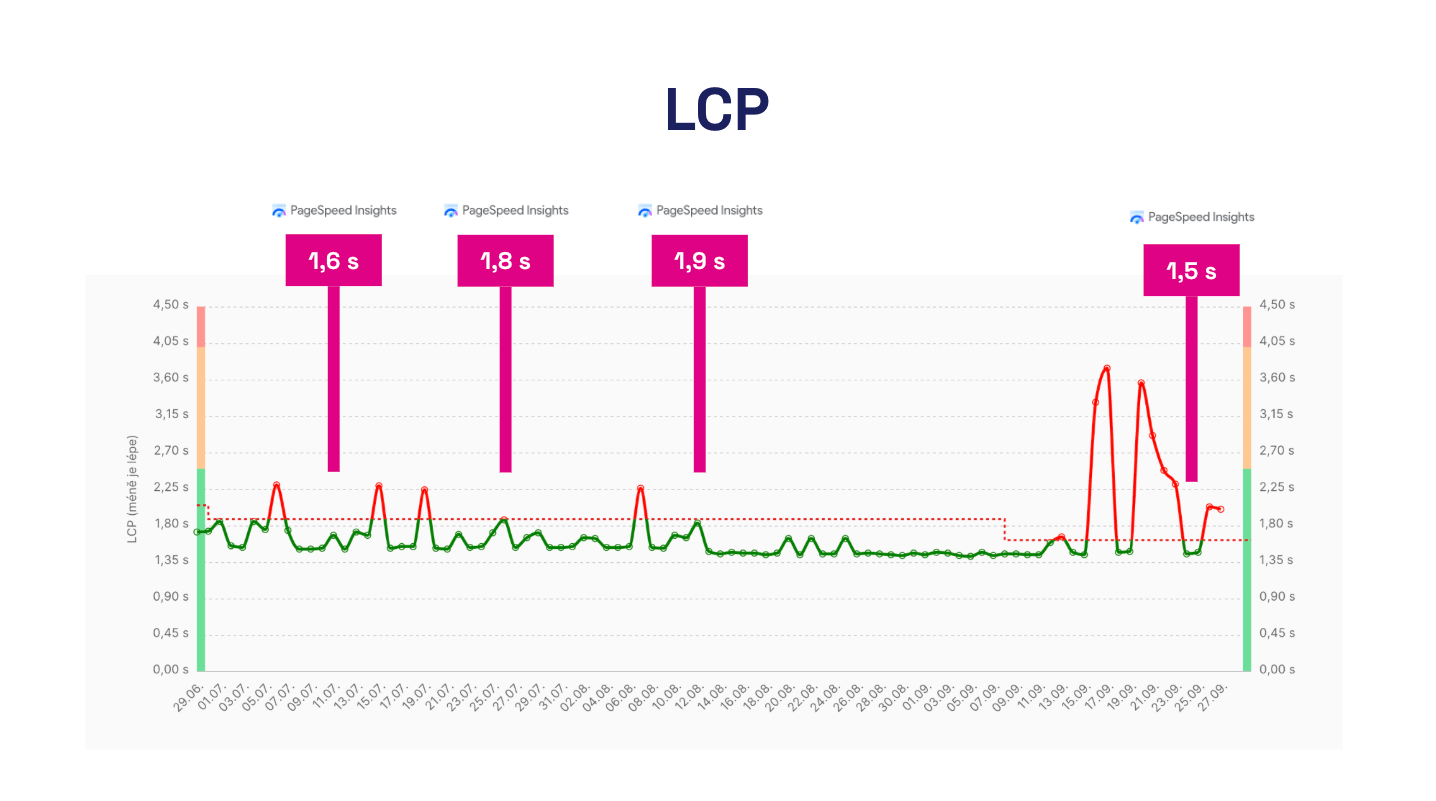 Measuring speed sporadically can create the illusion that everything is going smoothly. That's rarely the case.
How Does the Speed Topic Benefit Development Agencies?
We work with companies like PragueBest, SUPERKODERS, PeckaDesign, and Programia, and we see that speed monitoring helps them serve clients better:
- Speed as a Business Improvement for Clients
A faster website and higher conversion rate mean a happier client and more funds for development. - Better Client Retention
A development agency that monitors speed provides another reason to maintain collaboration. - Long-term Client Relationships
The agency monitors speed, continuously engages with the project, and optimizes it. At the same time, it’s work that developers usually enjoy.
How do development agencies evaluate our website speed monitoring?
"We appreciate the ability to check data daily and receive email notifications with PageSpeed.ONE PLUS. We find it useful to annotate changes in the tool and track their impact."
— Eduard Beneš, PragueBest
Why Should the Agency Pay for Monitoring?
When an agency pays for monitoring itself, it retains full control. It sees all the data, can react quickly to changes, and uses monitoring as a tool for managed optimization.
This way, the agency has an overview of website speed and can propose improvements to clients instead of passively waiting for requests.
Advantage for the Agency in Contract Negotiations
Monitoring can easily be included in web maintenance contracts:
- SLA and Maintenance
Monitoring as part of regular maintenance and reporting. - Service Packages
Part of premium services along with other optimizations. - Performance Guarantees
If the agency guarantees website performance, it needs tools to monitor it.
Through monitoring, the agency shifts from being a supplier to a strategic partner, helping clients maintain optimal website performance.
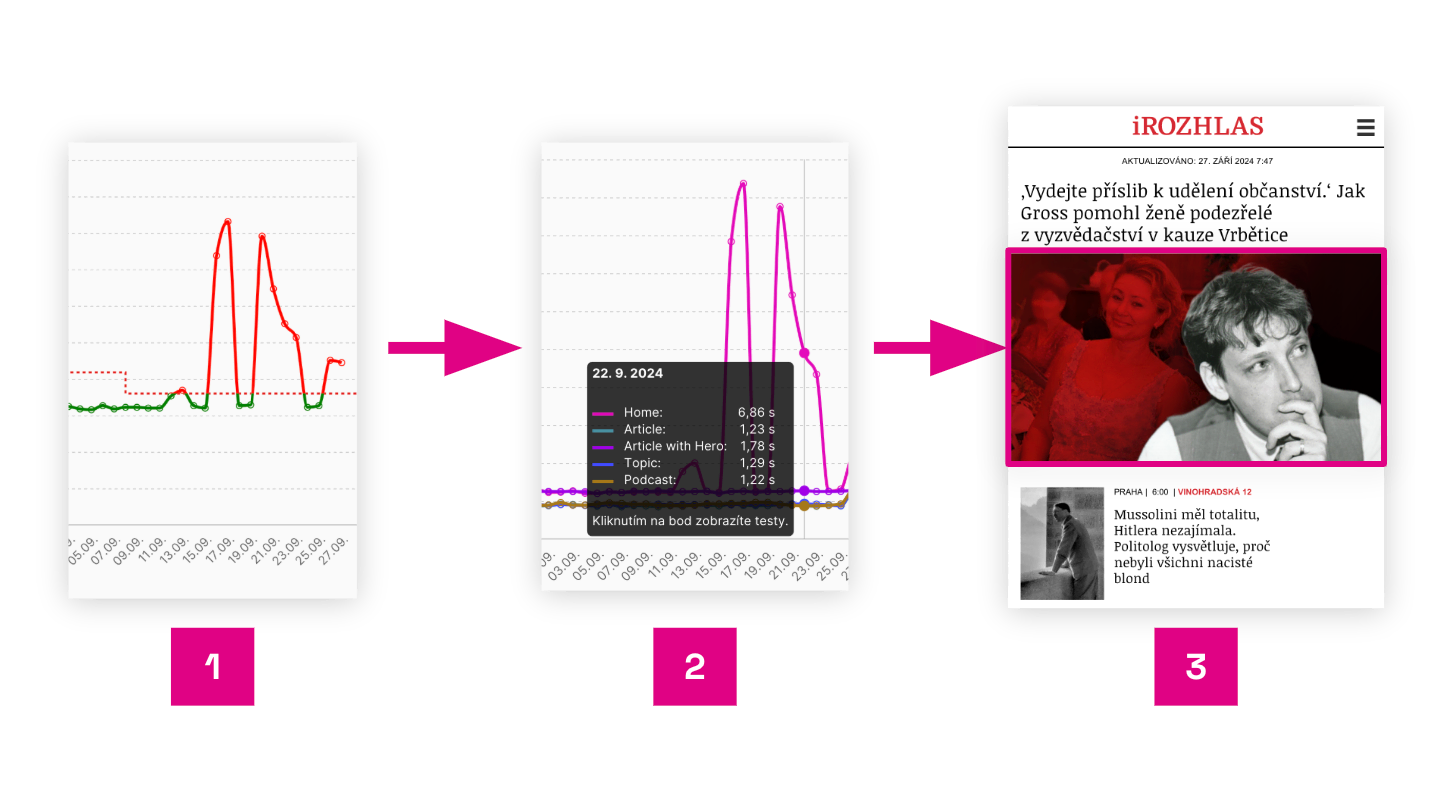 Identifying the cause of speed deterioration using PLUS monitoring on iRozhlas.cz.
TIP: Besides the speed monitoring application in PageSpeed.ONE, we also offer assistance with website speed optimization or training your developers.
What Is and Isn't Website Speed Monitoring?
The market today is flooded with tools, and development agencies sometimes confuse different types of monitoring. We often see them using tools that address different issues. The most common include:
- Sentry – excellent for tracking JavaScript and frontend application errors, but not ideal for measuring website speed from the user's perspective.
- Grafana – great for visualizing backend and server metrics (CPU, RAM, API latency), but doesn't address frontend and actual user experience with page loading.
- CrUX Dashboard – provides aggregated data from real users via the Chrome UX Report, but lacks daily insights and deeper analysis of specific issues.
- Pingdom/UptimeRobot – primarily monitor server availability and can run simple synthetic tests, but don't focus on website speed.
- Lighthouse in DevTools or PageSpeed Insights – a one-off local development test, but doesn't provide continuous monitoring and performance comparison over time.
Most of these tools either address code errors, backend monitoring, or aggregated browser data. For website speed monitoring, you need more:
- Long-term Metric Monitoring
How does performance evolve over time? When did regression occur? - In-depth Analysis of Specific Pages and Issues
How does speed differ between desktop and mobile? Which pages are the slowest? - Immediate Feedback
When you deploy a new version of the website, do you know if it slowed down or sped up?
PageSpeed.ONE's speed monitoring fills these gaps precisely.
What Does Monitoring PLUS from PageSpeed.ONE Offer Development Agencies?
Our monitoring was developed directly from practice – based on consultations with clients and cooperation with both development and marketing agencies. As a result, it provides data that holds real value for website speed optimization.
Let’s take a look at what our tool can offer you.
For each client, you see a dashboard with the test suites and speed metrics:
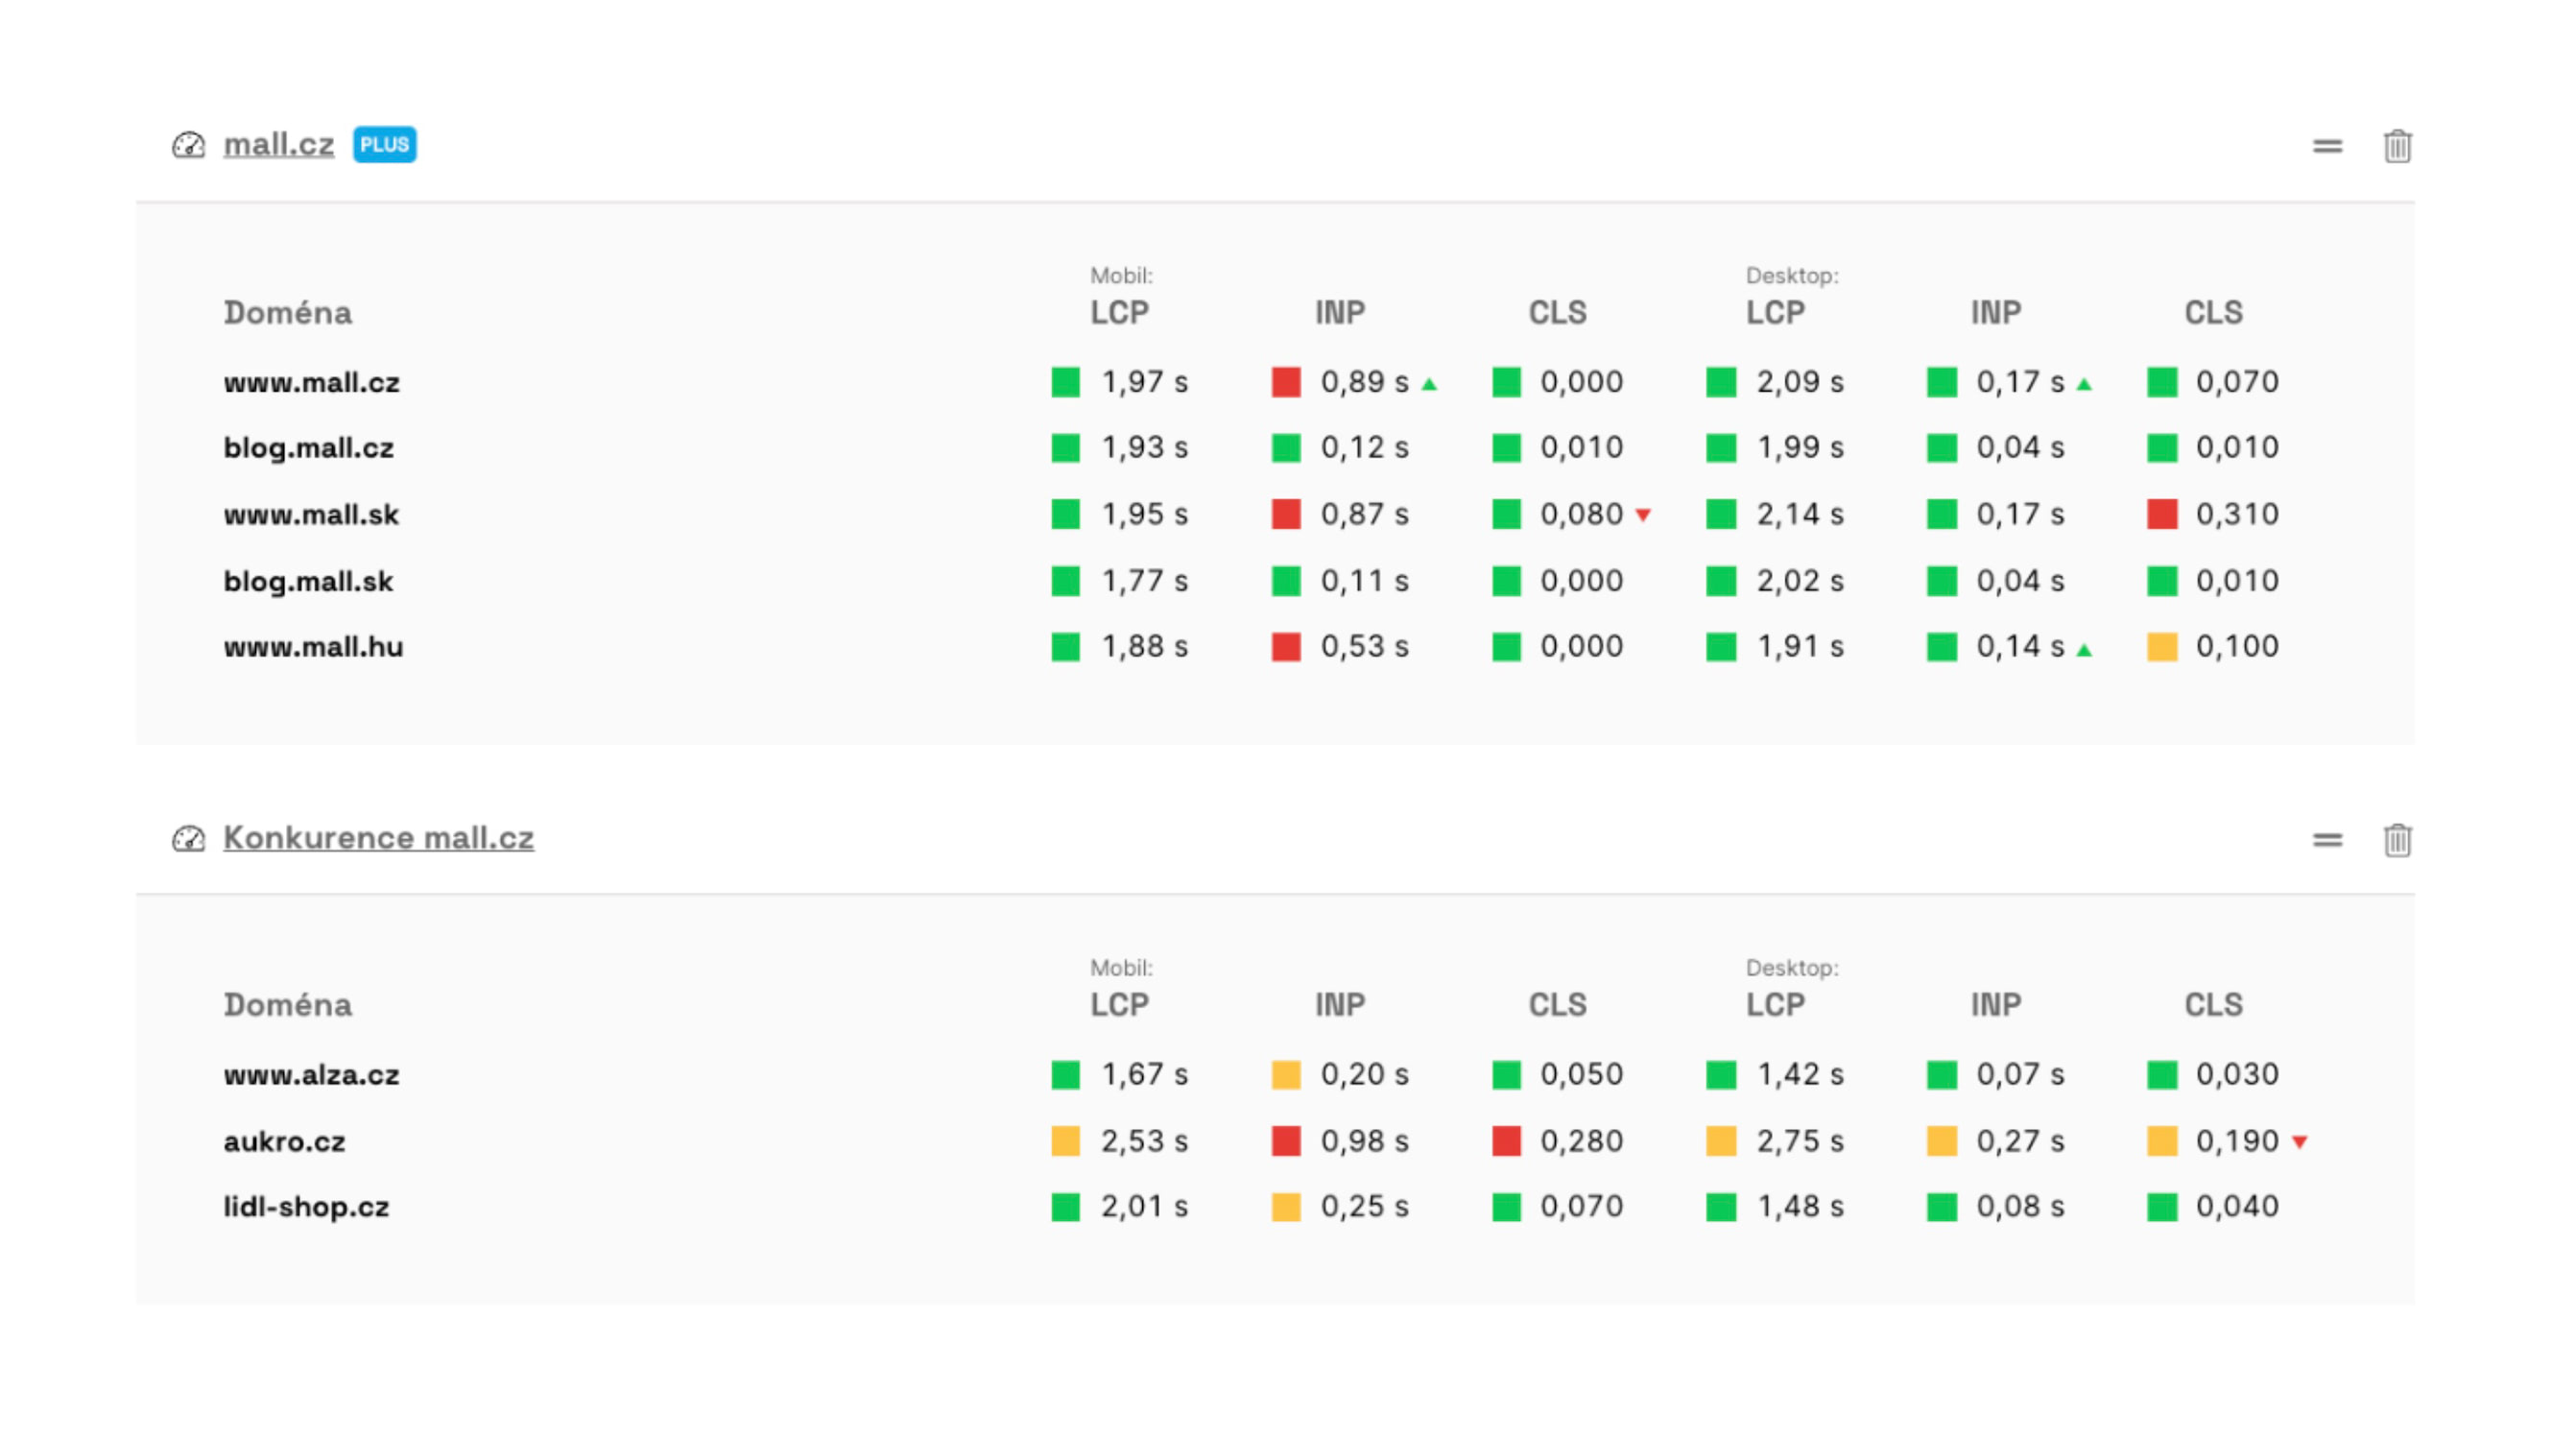 The image shows a client's dashboard with two tests.
Team and client management is "included" in the solution, but of course, it’s not the main part of the application. That is the testing itself, its outputs, and regular reports.
Watchdog, Notifications, and Regular Reports Keep You Informed
Every month, you'll receive a summary of the most important developments for each client:
In monthly reports, you get an overview of what's new in performance (1), as well as the client website status (2) and metric evolution.
Your developers will appreciate the Watchdog, which monitors daily synthetic tests:
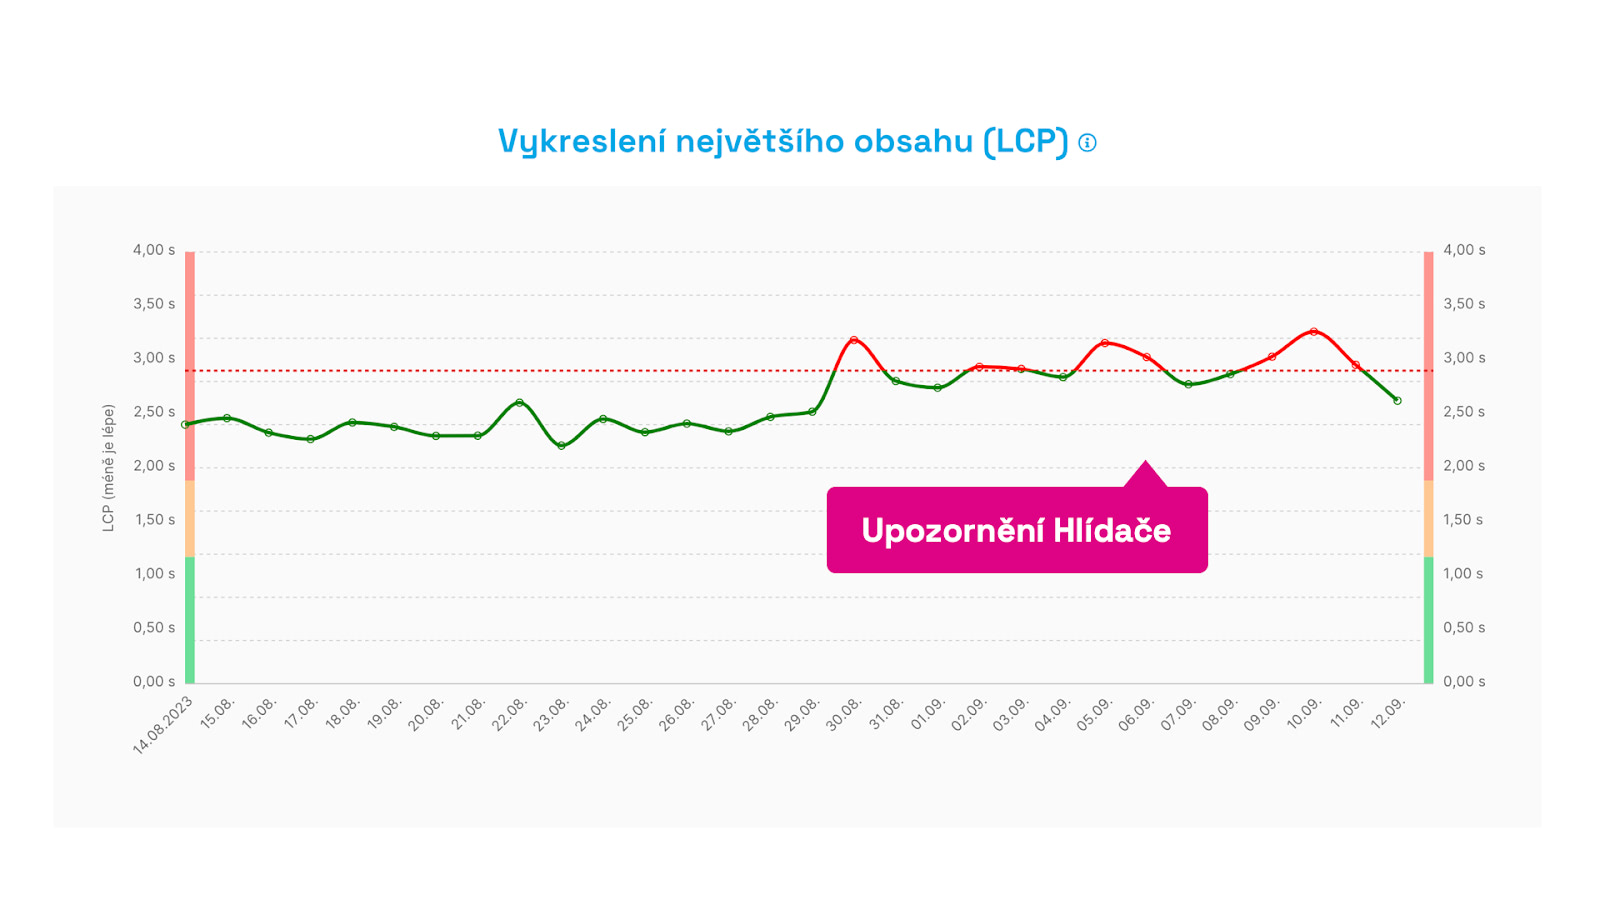 Watchdog sends notifications if a crucial metric shifts positively or negatively for three consecutive days.
If something goes wrong (or improves), you, your project managers, or developers will receive a message via email, Slack, or Teams:
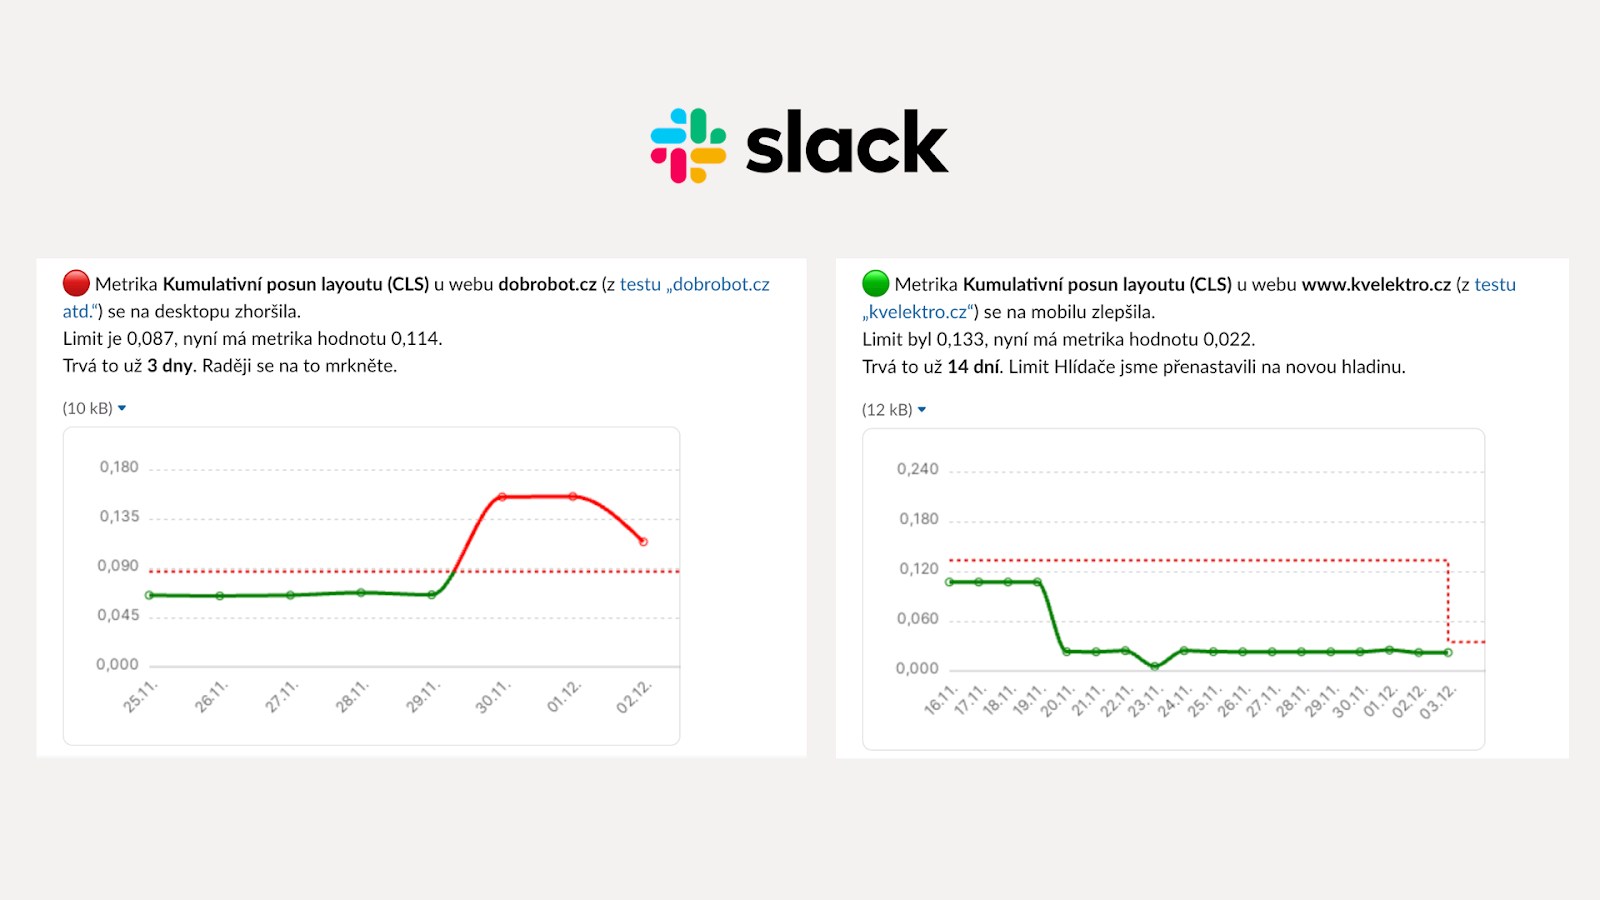 Watchdog notifications to Teams.
Tip: Our monitoring displays data from Google users (CrUX) and we also conduct our own synthetic tests. Discover why you need both types of measurements.
Detailed Technical Data for Fine-tuning Needs
Your developers will appreciate detailed technical reports that facilitate finding errors or optimization opportunities.
The Pages Report shows metric evolution for measured page types, making it easy to identify which part of the website is problematic:
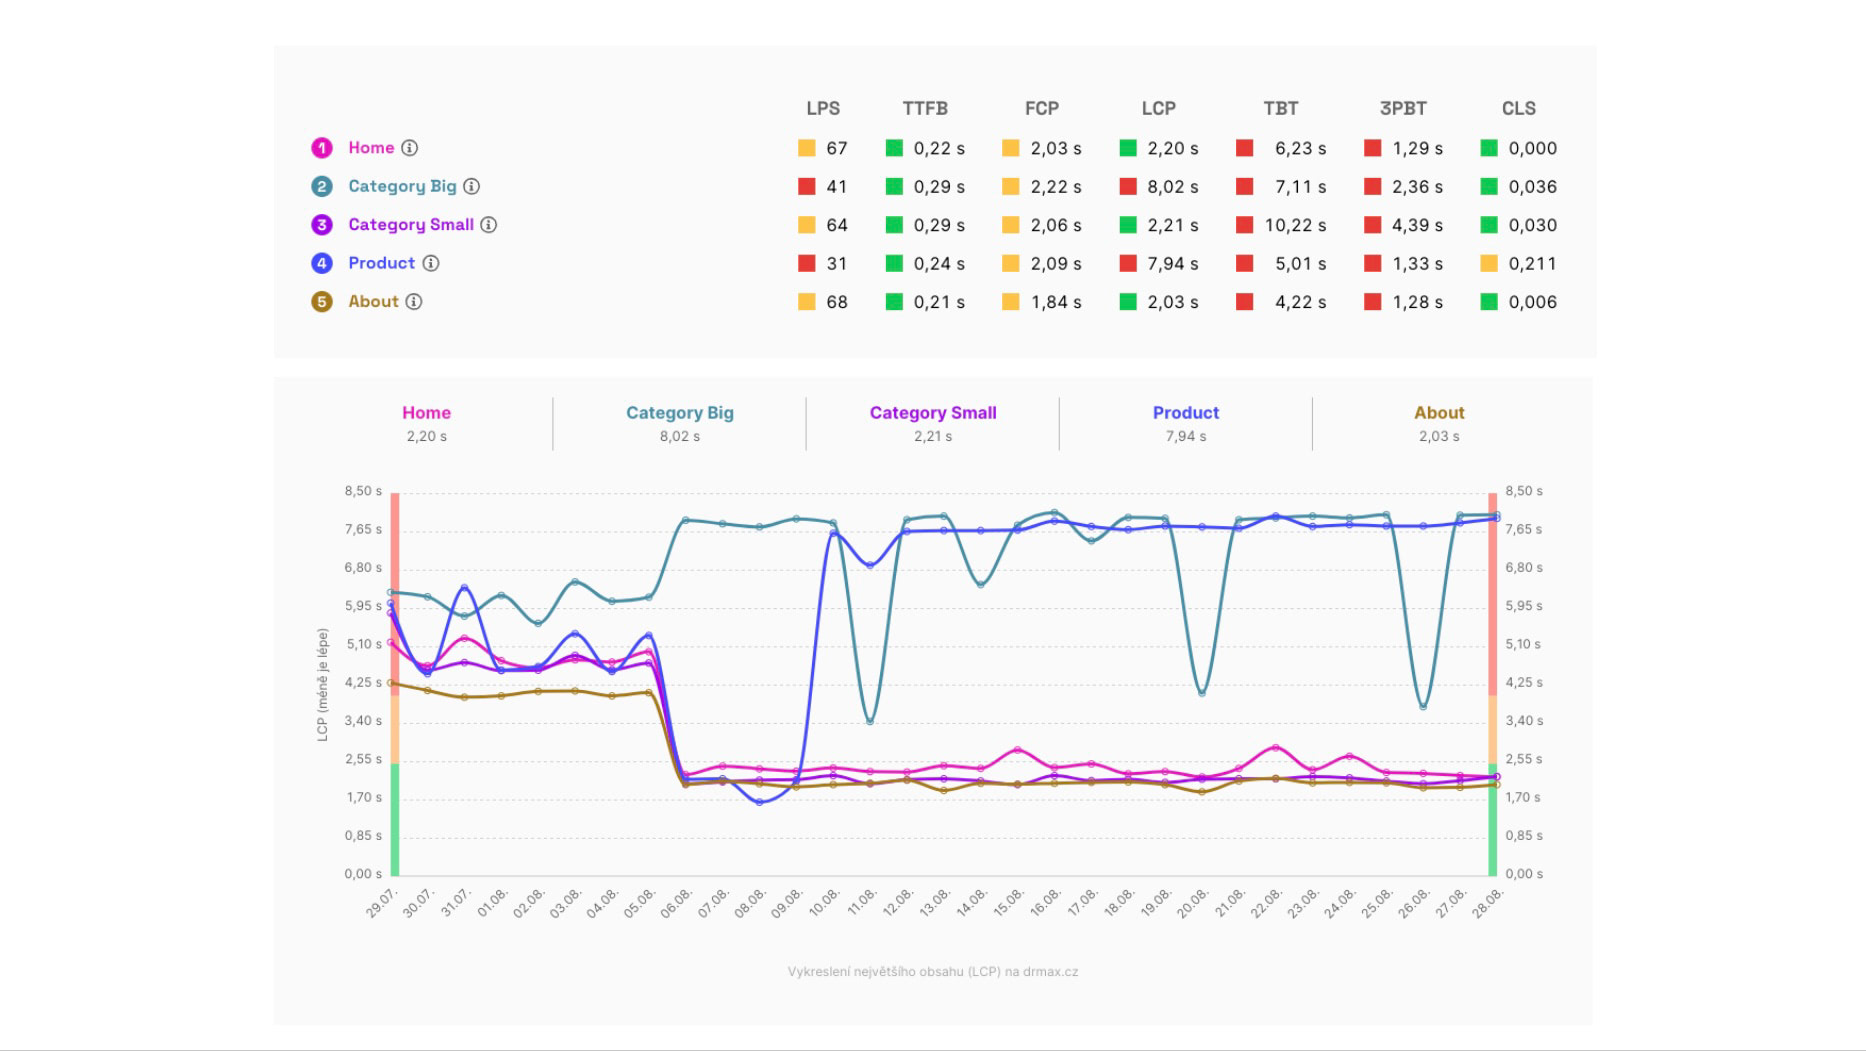 Detailed metric status and evolution for critical landing pages on an e-commerce site, as shown by the Pages Report.
The Technical Report further displays technical indicators for each page, such as the data volume of individual elements that might be causing metric deterioration:
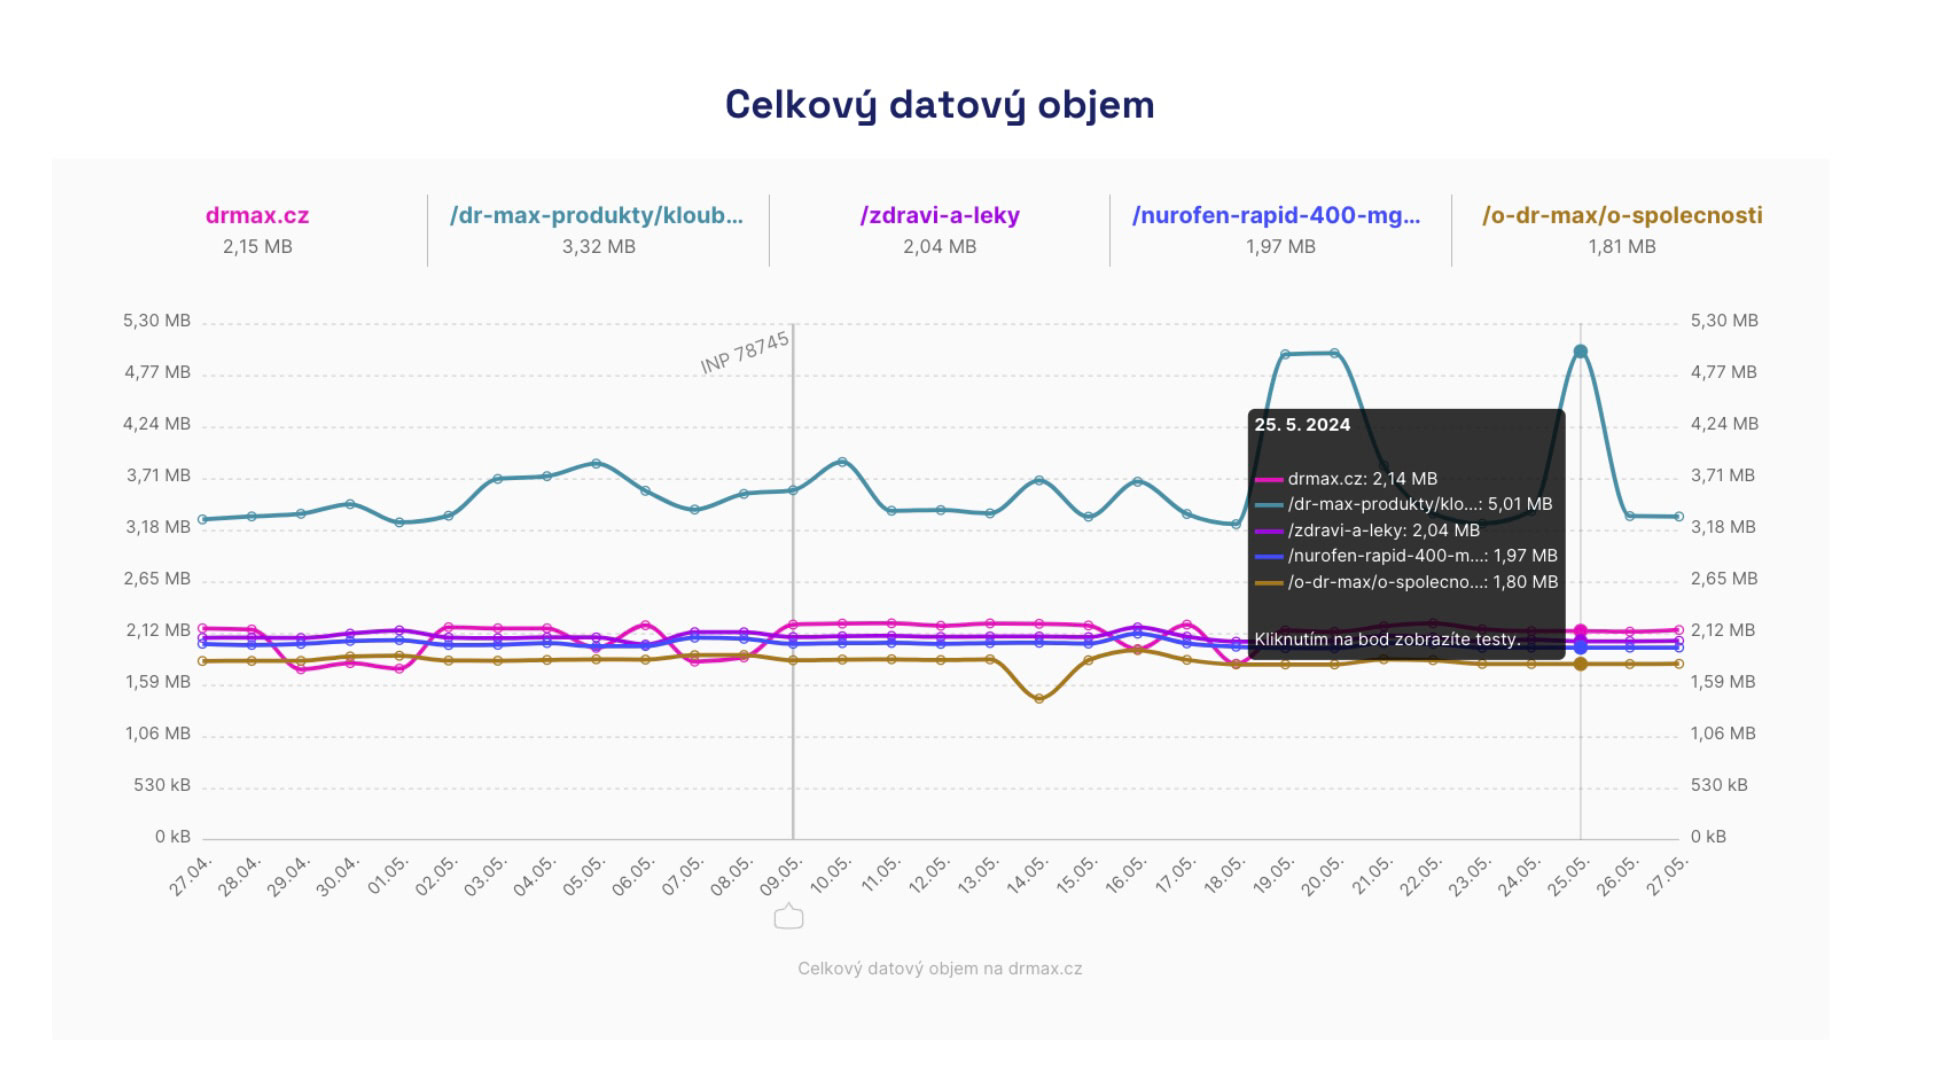 Technical indicators, like total data volume, often reveal what's causing metric and user experience degradation.
The Test Run Detail provides developers with even greater detail in the form of a complete Lighthouse report or profiling reports, which can be opened in Chrome Devtools:
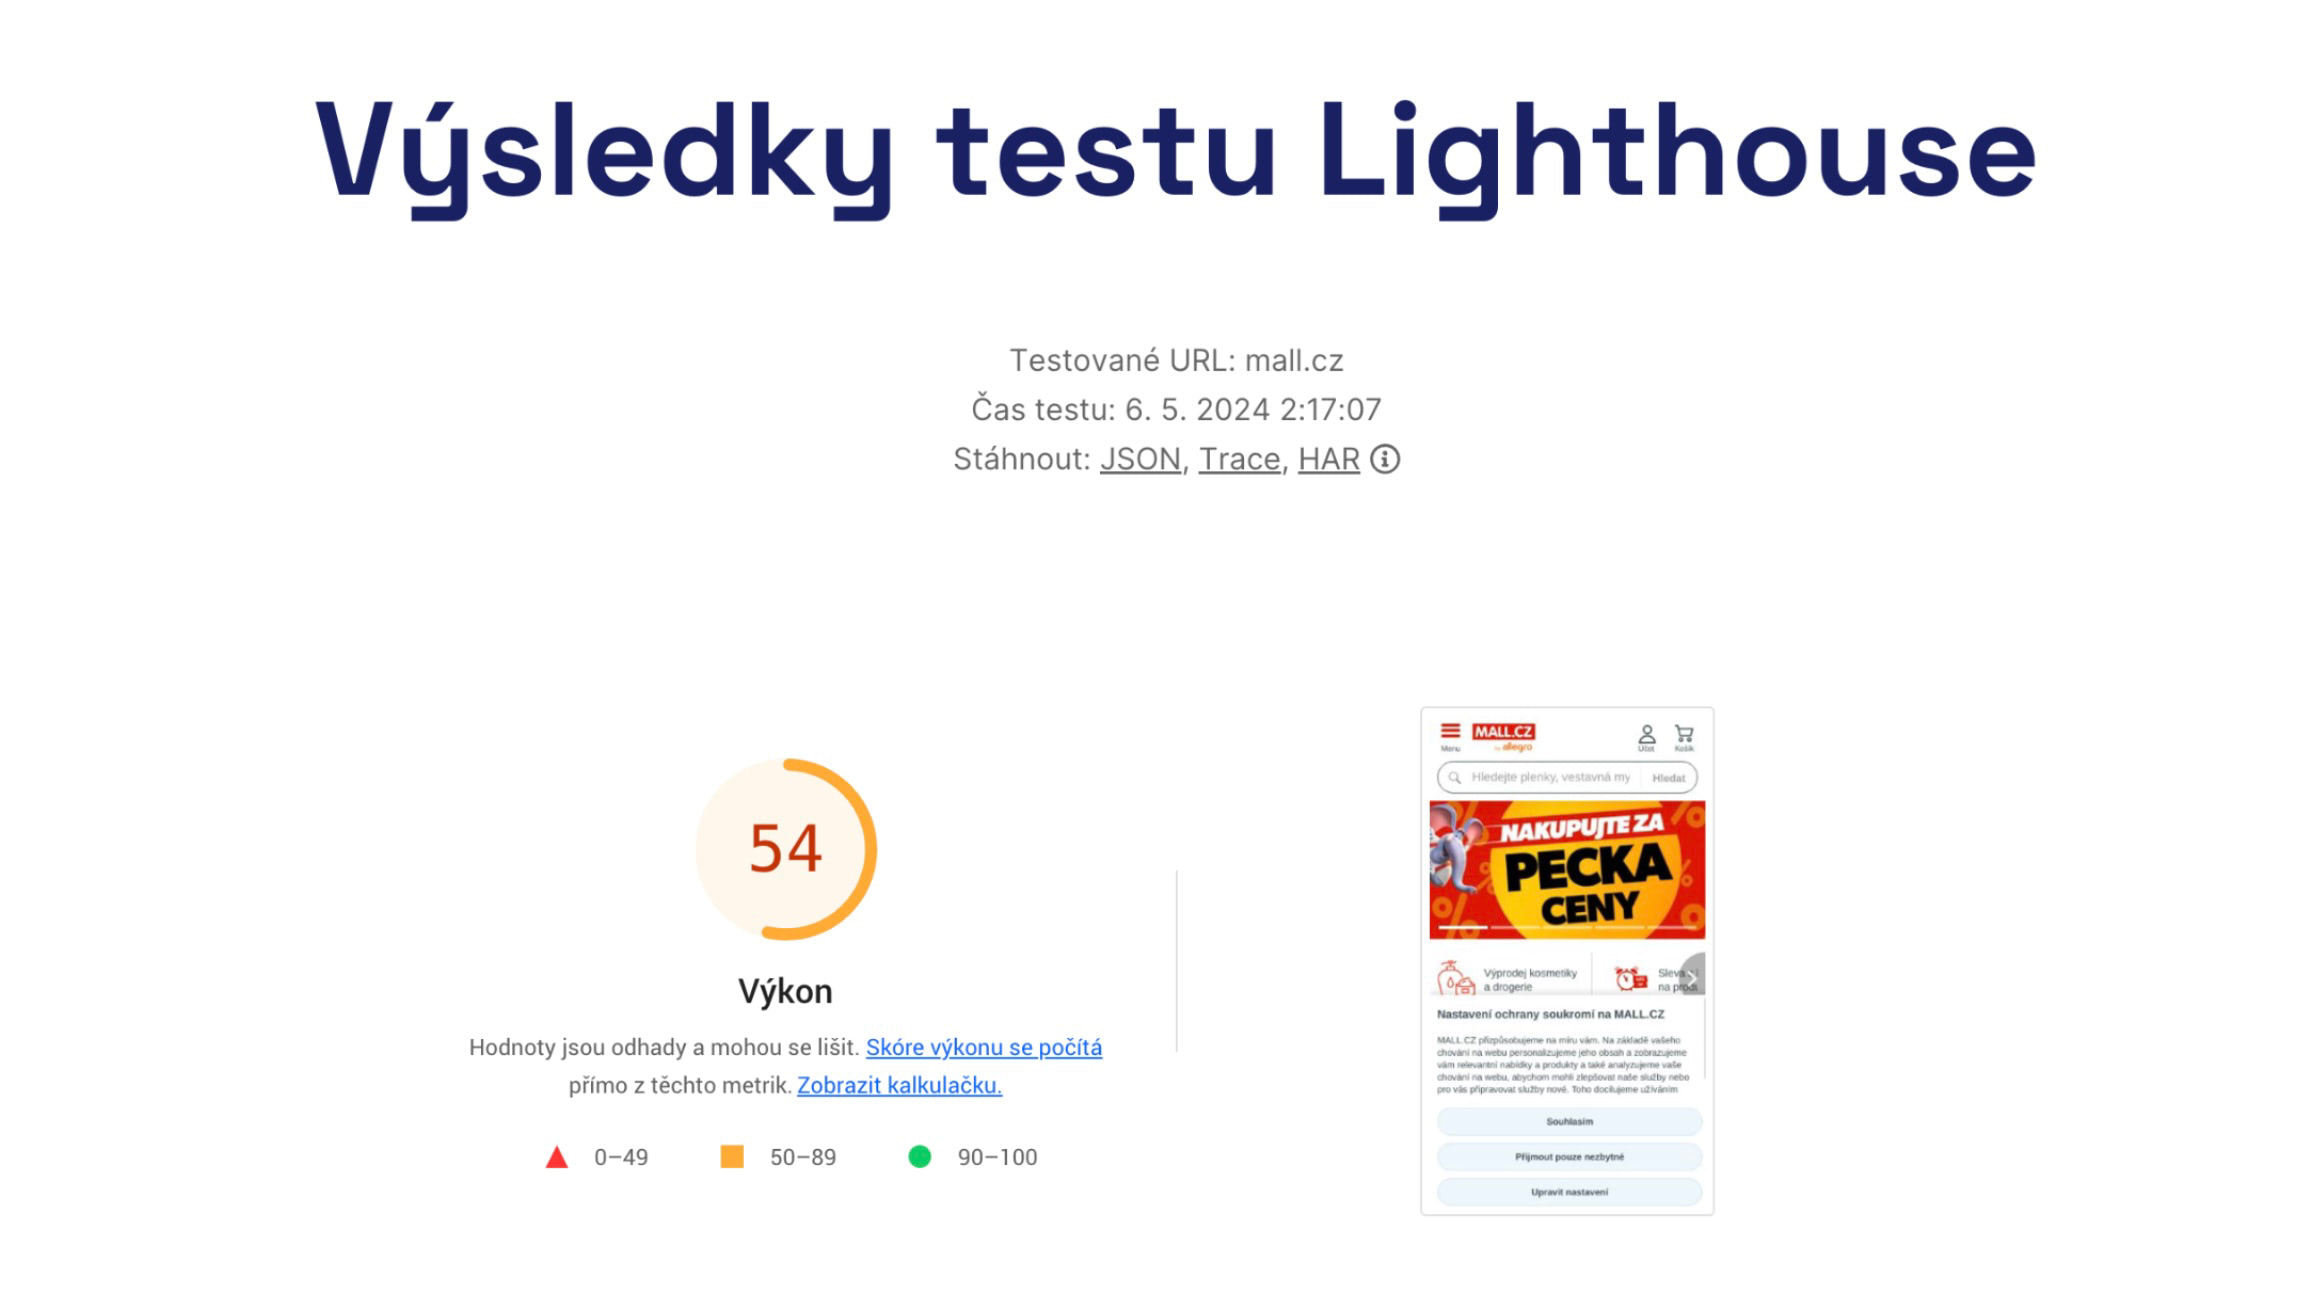 Web performance geeks can download Trace or HAR results for use in Chrome Developer Tools from the test run results.
The Opportunities Report is the main place where we display tasks that can help with speed optimization:
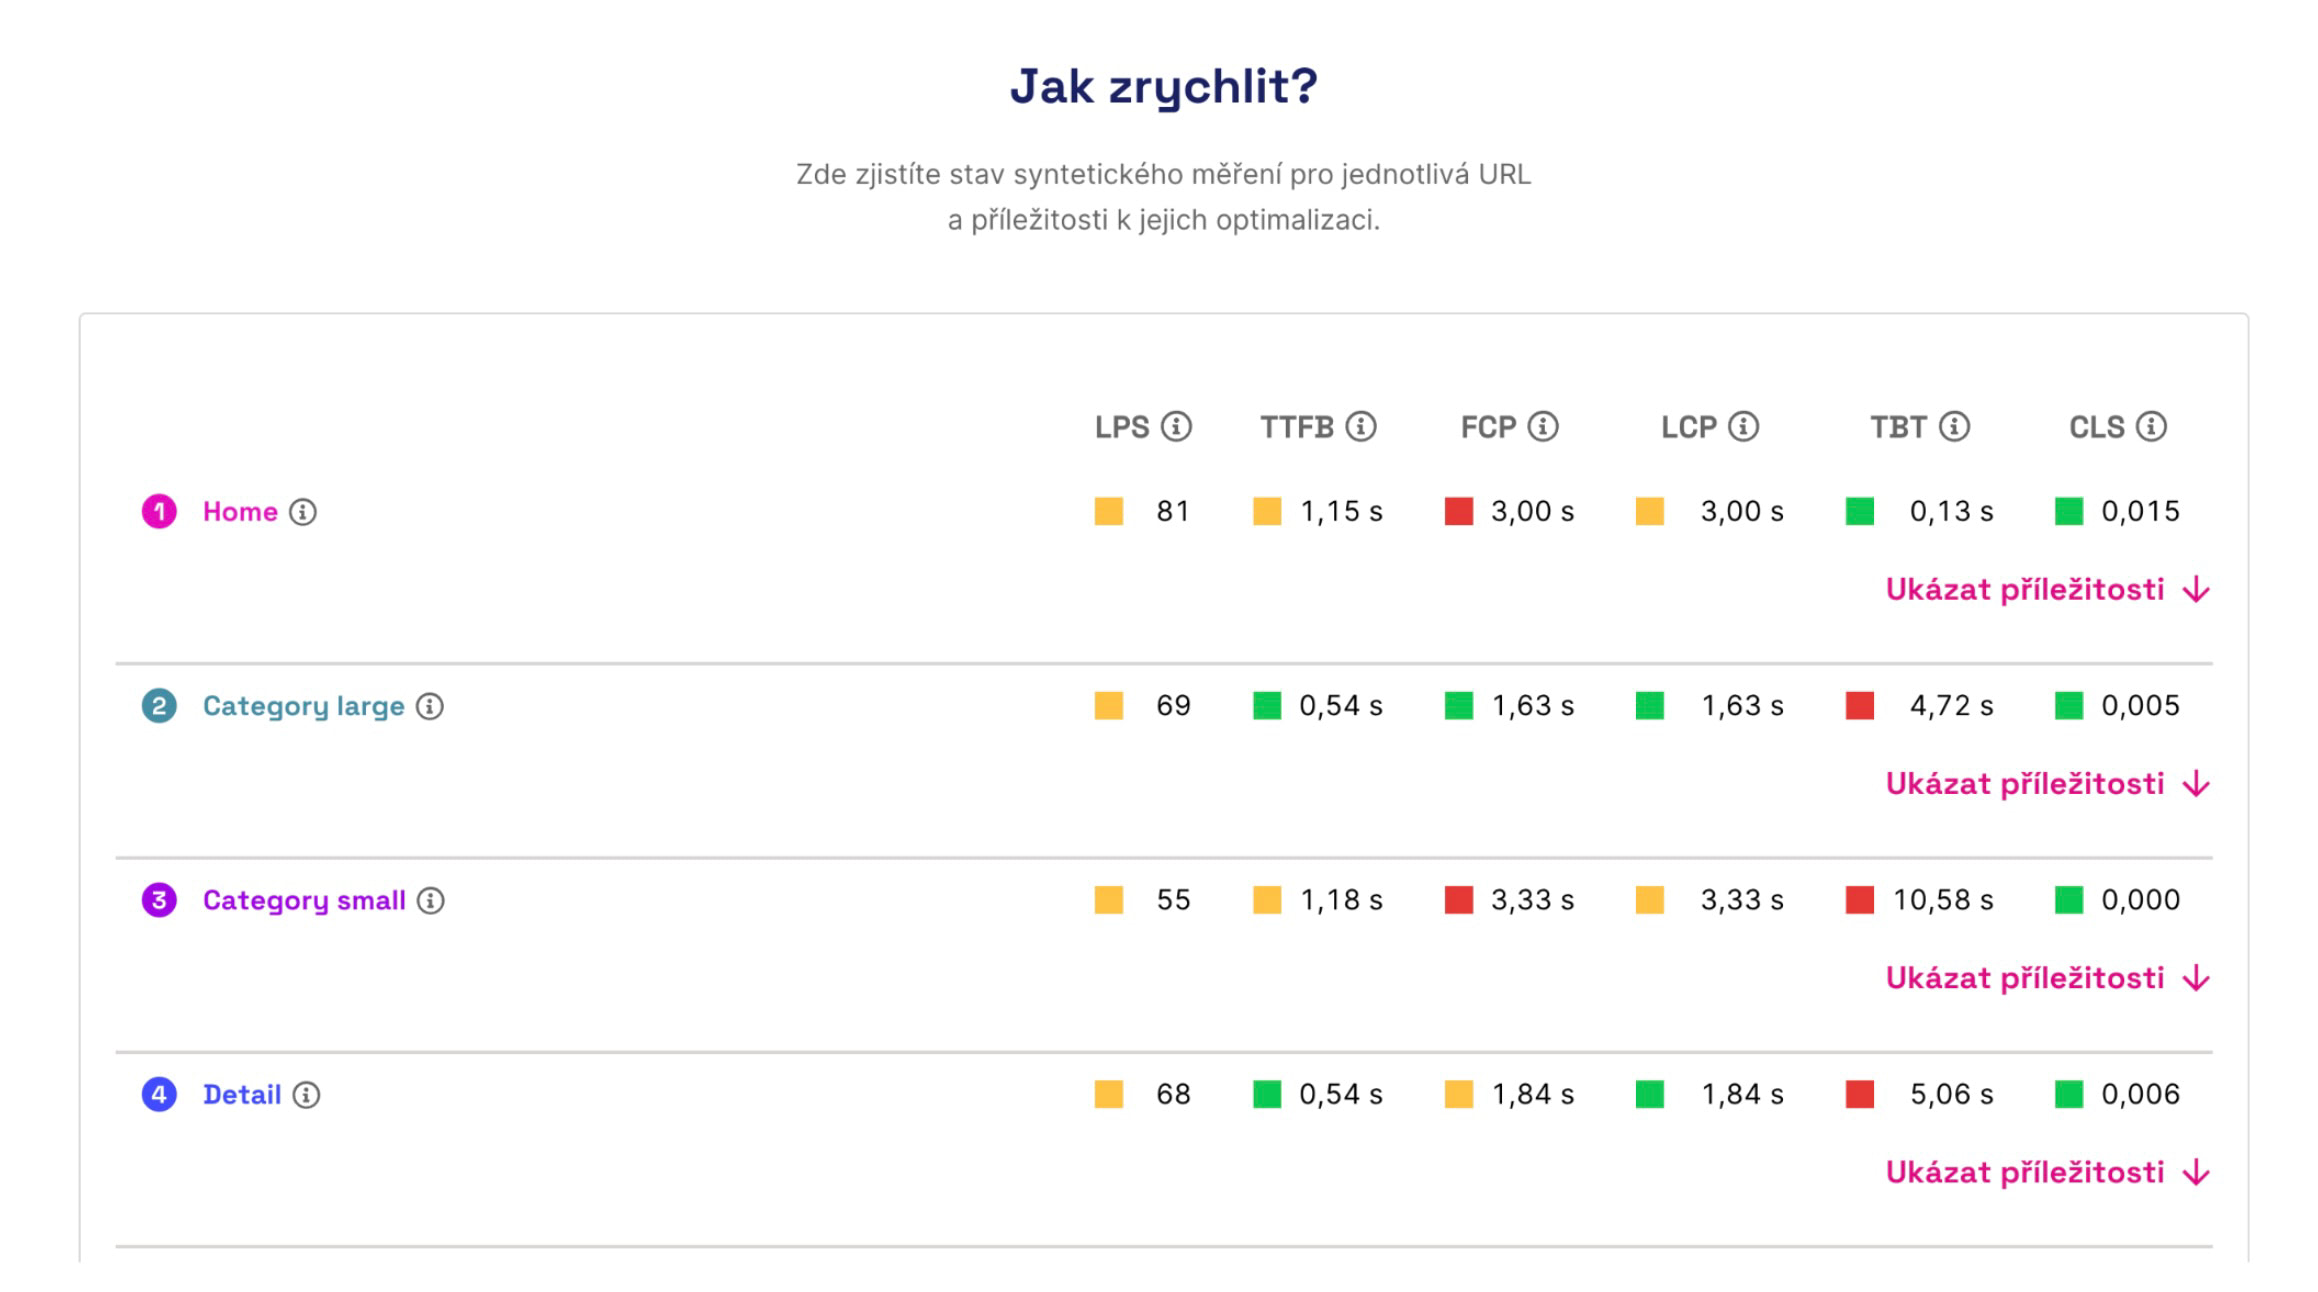 What is the status of metrics for specific page types and what can be improved on them?
In the PLUS monitoring, developers will also find many other features based on our experiences. One of them is the ability to add annotations to the graphs, allowing you to mark important deployments on the website:
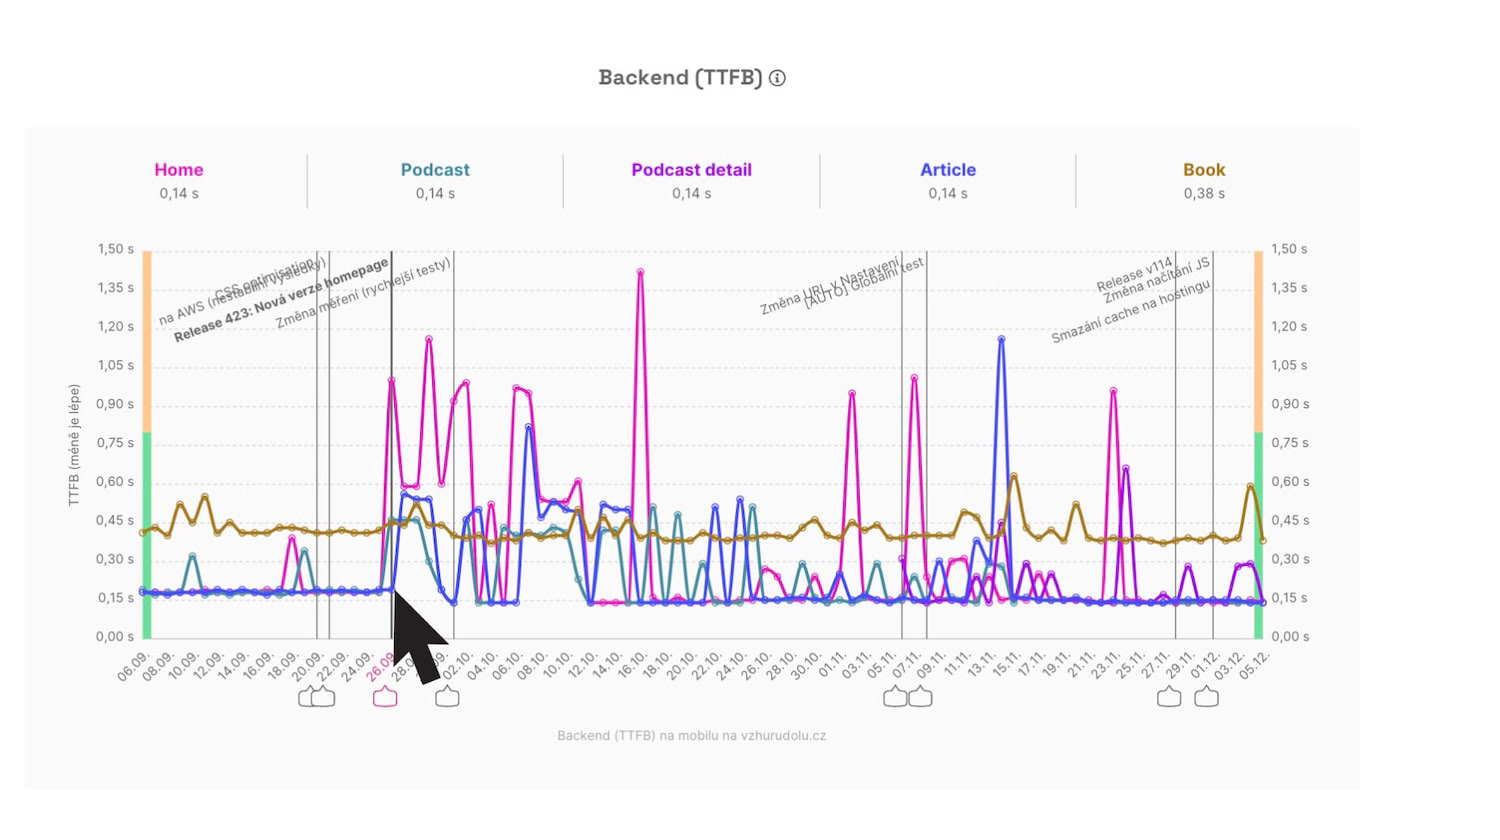 Annotations are also added automatically, for instance, when URL settings change in the test or when we modify something in the testing infrastructure.
Monitoring data can be exported or connected to custom dashboards via public API. A read-only key can be created for an external team or agency.
Of course, in monitoring by PageSpeed.ONE, you can count on an unlimited number of clients and users.
There's much more. Check out the monitoring documentation, where we are gradually adding new articles.
How to Get Started with PLUS Monitoring?
The prices for PageSpeed.ONE's speed monitoring are currently lower than those of similar tools:
- 5,400 CZK annually for one comprehensively monitored website (a "test suite" containing 5 URL synth and 5 CrUX domains).
- 1,200 CZK annual supplement for 5 additional URLs or 10 domains for larger websites.
- Discounts or commissions for agencies from 10% for 5 or more test suites.
Price examples:
- For a client with a small e-shop and two language versions of the website and two competitors to monitor, you'll pay 5,400 CZK annually.
- For a larger client where you want to monitor 2 websites comprehensively, each with 10 URLs and a total of 20 domains, you'll pay 15,600 CZK annually ((5400 + 2 _ 1200) _ 2).
Find more in the pricing list.
Interested, or do you want to discuss speed monitoring further?
- Visit the landing page or view a sample project.
- Schedule a monitoring demo.
For serious interest, we offer agencies a two-month trial.
Try the monitoring on your own project and see how seamlessly it fits into your workflow.
Speed Monitoring PLUS
Try our monitoring app free for a month.
5,400 CZK annually per website. Invoice only, no credit card needed.
…or simply order the PLUS monitoring.