Chart Notes: The Key to Evaluating Website Speed Changes
 Martin MichálekUpdated 9/29/20254 minutes reading
Chart notes allow you to more easily evaluate the impact of changes you've made to your website.
Our PLUS speed monitoring even adds some notes automatically.
In this text, you will learn not only how to add and edit notes but also our recommendations on how to approach them.
From version 4.10, notes are part of the unified Measurement History (Log) view: besides notes, you will also see synthetic measurements, manual measurements (beta), and other new features. The overview is available on the Measurement History (Log) page; a summary of the changes can be found in the 4.10 release changelog.
Why Keep a Log of Website Changes?
During website development, many changes occur that can affect speed.
Chart notes in our speed monitoring allow you to record these important moments, making it easier to trace the causes of any improvements or deteriorations in metrics.
These could include events such as:
- Deploying a redesigned version of the website or a regular release.
- Making significant changes to the backend.
- Implementing a specific speed optimization.
- Adding a third-party component to the website (analytics, A/B testing, chat).
Other important events include changes to measurements themselves, such as changing the measured URLs. However, PLUS monitoring handles this automatically, as you will learn below.
Adding Notes to Charts
In PLUS monitoring, you can add a note to any day in any chart:
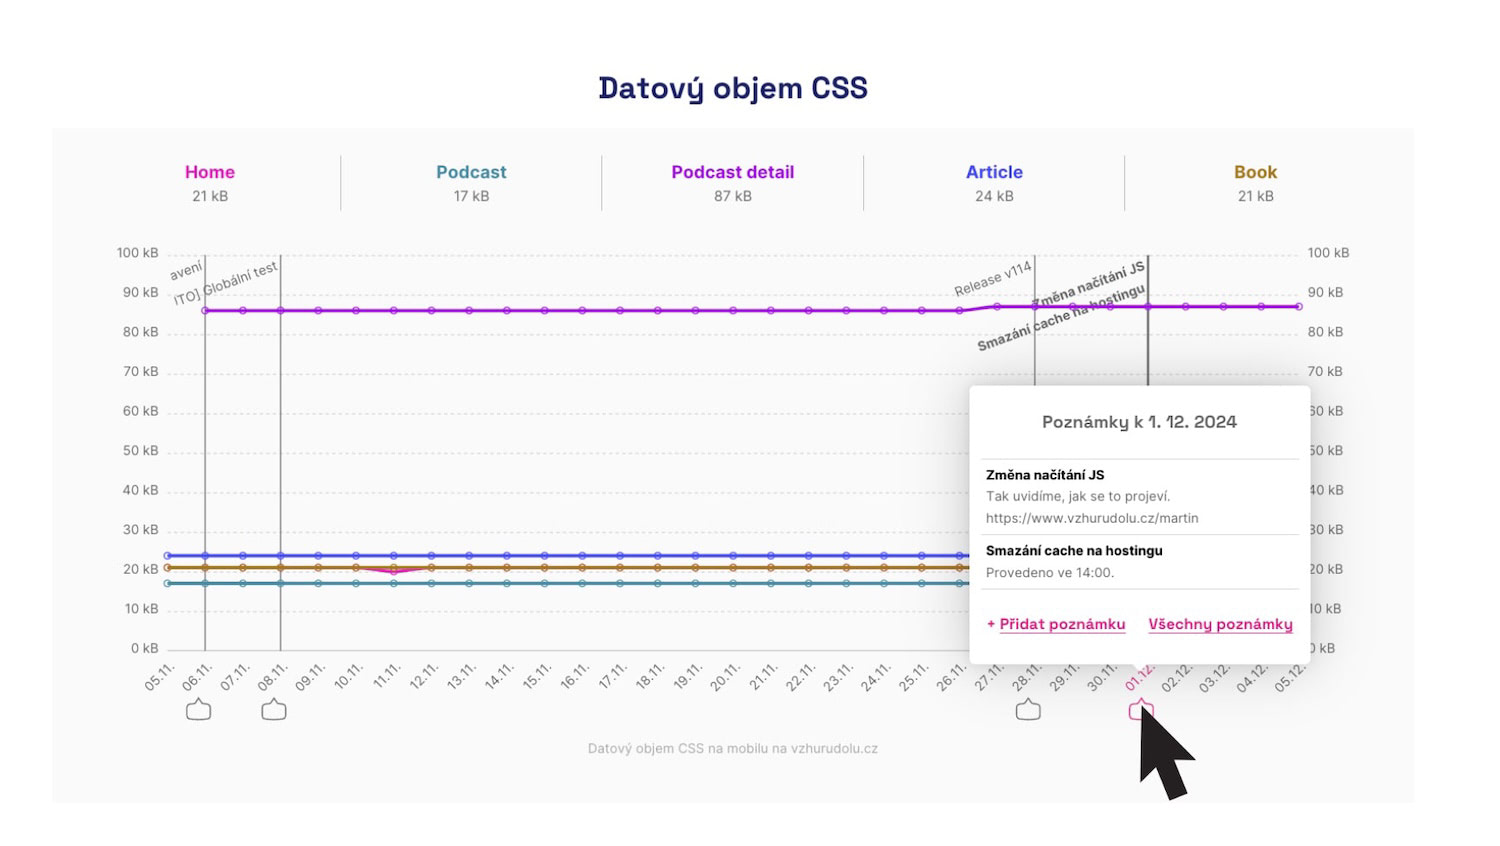 Notes can be added by hovering over dates in the timeline of all charts.
Clicking below the chart opens a modal window where you can add (or edit an existing) note for that day.
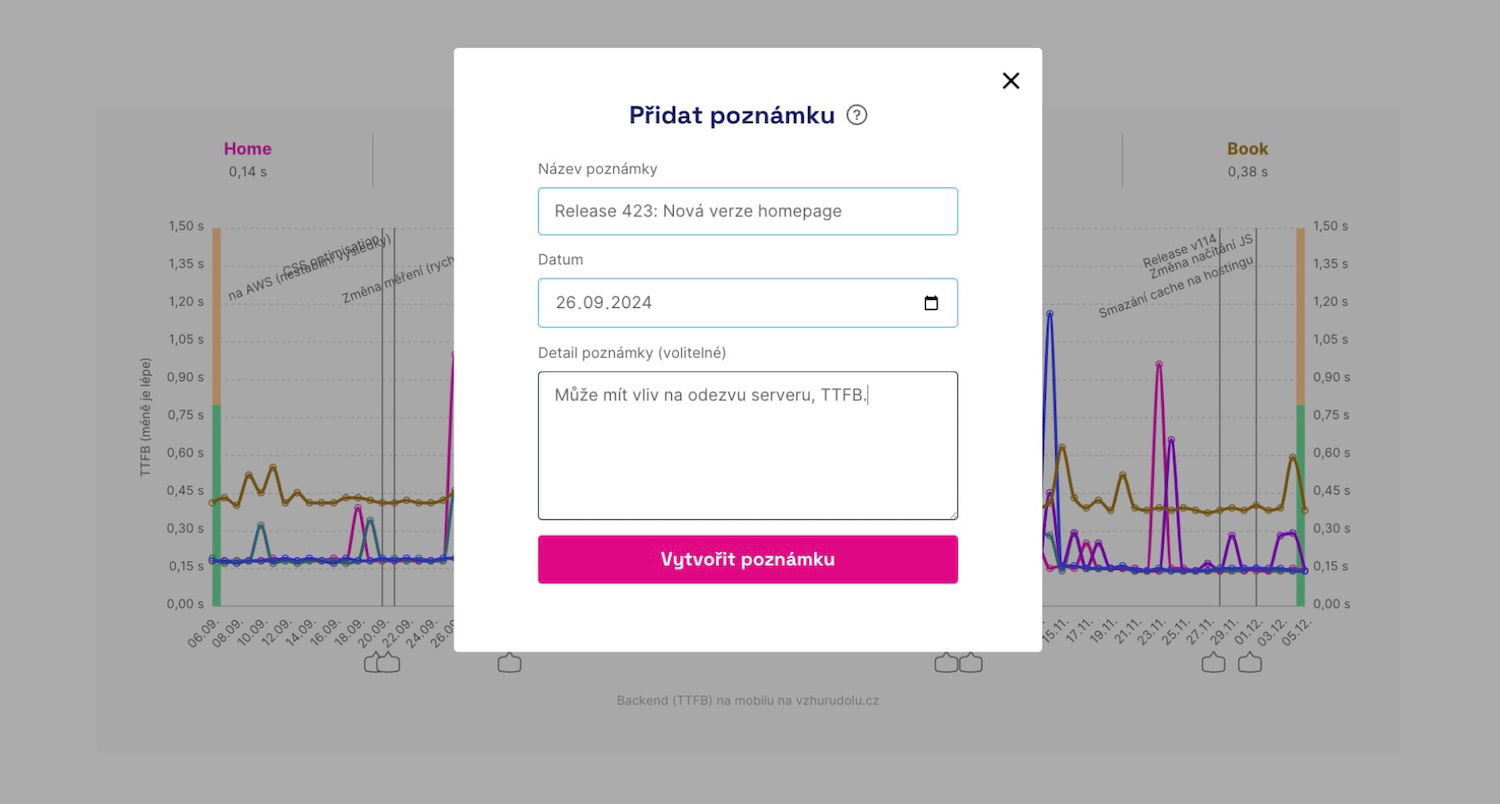 Deployed a new version of the website? Add a note to the chart.
These important changes will then be visible in the charts, providing context for further work and evaluating changes.
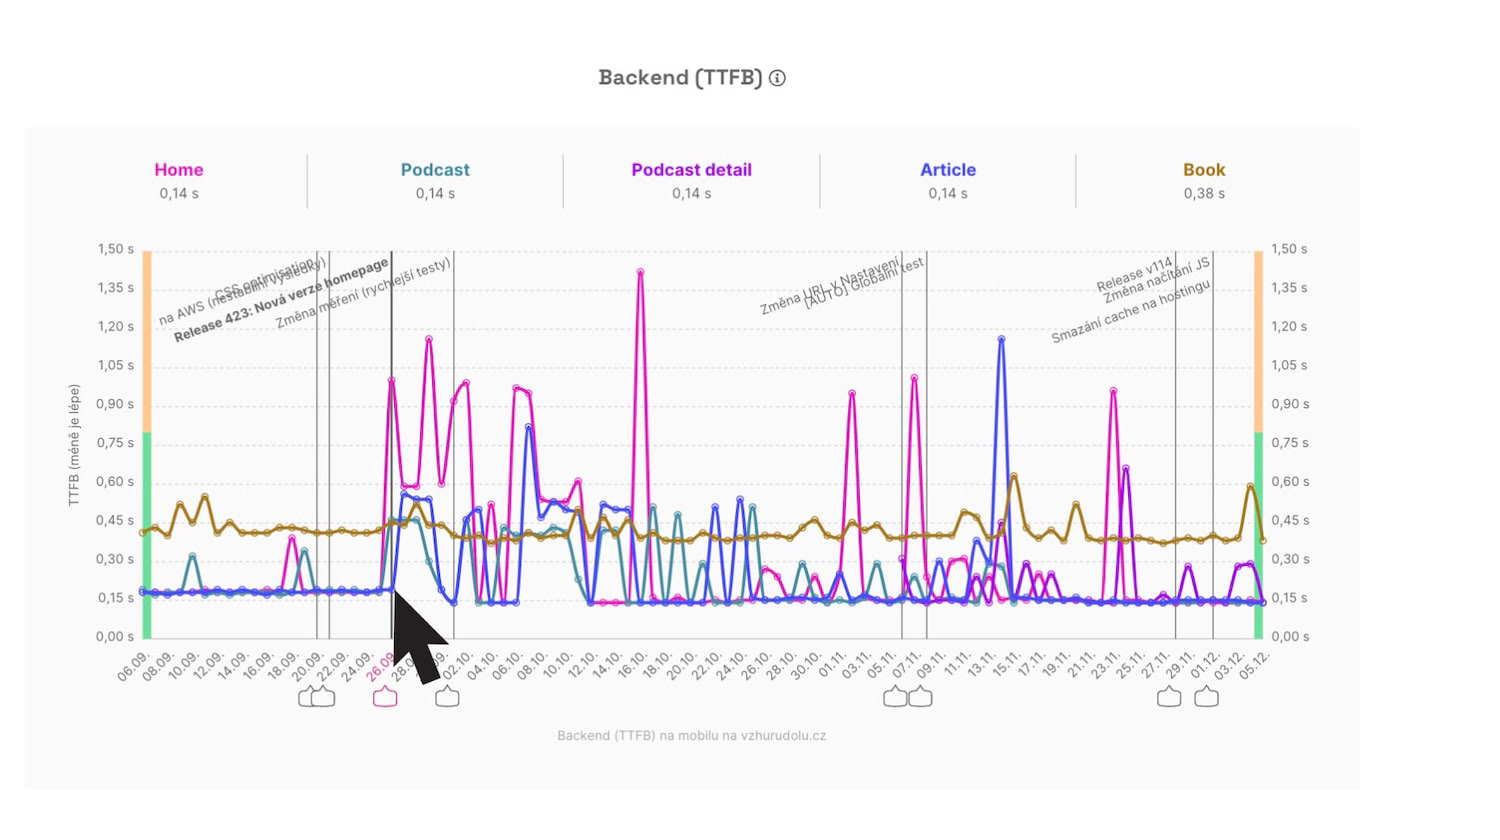 Notes will then appear in all charts, so you won't miss a potential impact on any of the speed metrics.
Automatically Added Notes
The aim of PageSpeed.ONE PLUS monitoring is to resolve as much as possible for you. Therefore, in some cases, we add notes automatically:
- Change in synthetic measurement settings When you change the URL in Settings, we add a note to the charts reading “Change in measured URLs”.
- Change in testing technology For example, when we upgrade to a new version of the Lighthouse tool, we add a note to that effect, such as “Lighthouse 12.1”. We also inform you about this in our changelog.
These notes are global for all PLUS monitoring clients.
You will recognize them by the label [Auto] in the title or the Automat flag in the note list.
The “Notes” Page
You can view all notes on the Notes page, accessible from the main navigation of each test:
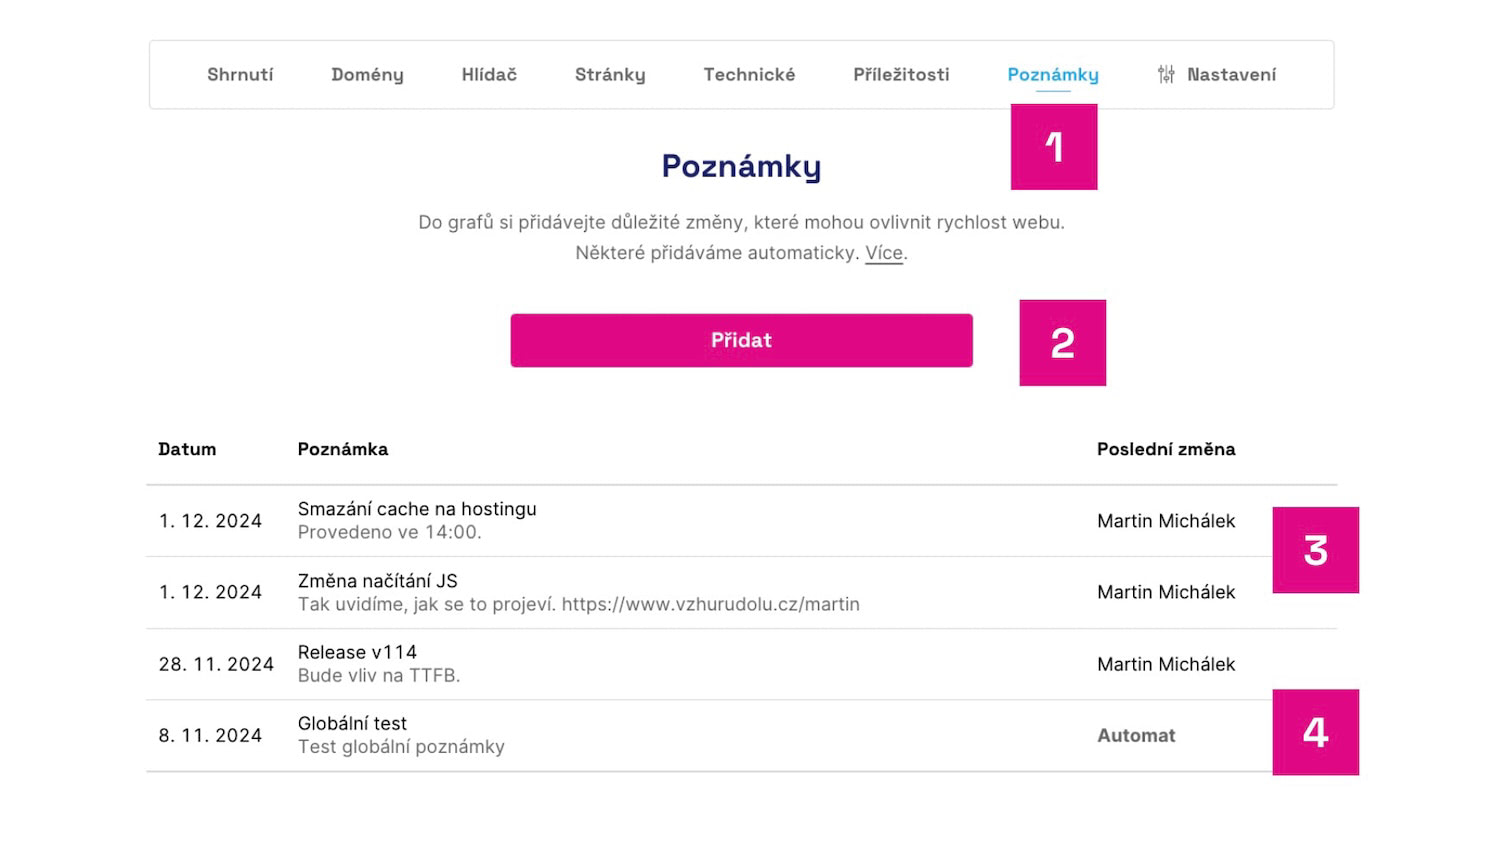 The “Notes” page is the home of all changes to the website or measurements.
What do you see in the image?
- The “Notes” page in test navigation.
- Option to add a note.
- User notes with the last change author.
- Automatic notes added by PLUS monitoring.
Here you can again add, remove, or edit existing notes. Of course, except for those added automatically. All notes and measurements are also neatly organized in the Measurement History.
A Few Tips for Notes
Finally, we offer a few recommendations on how to work with notes:
- Only log significant changes that impact speed If you publish a new version of the website several times a week, it is not necessary to add a note every time. Soon, you would lose track of the data in the charts. Only add those that may affect speed.
- Remember changes beyond the technical development of the website Design changes often affect the CLS metric, implementing third-party components, conducting A/B testing again the INP metric. More such cases may occur. Always include important changes in the Notes.
- Don't hesitate to add notes retroactively Notes best explain the impact of each change and teach you to evaluate the impact of future changes. Therefore, do not hesitate to add notes retroactively in case of a change you discovered some time later.
You can also add notes automatically via the public API — for this, you need an API key with read and write permissions.
Notes, along with the charts themselves, are a relatively unobtrusive but very useful tool for anyone who cares about the speed development of their websites.
Speed Monitoring PLUS
Try our monitoring app free for a month.
5,400 CZK annually per website. Invoice only, no credit card needed.