Test Run Detail Report
The test run detail provides results of a specific test of one of your website's URLs.
The test run detail is designed for technically savvy individuals interested in the specifics of a particular speed test we conduct using the Lighthouse tool.
What can you find in the test run detail?
- Status of metrics for this test run.
- Files with detailed logs.
- Recommendations for speed optimization.
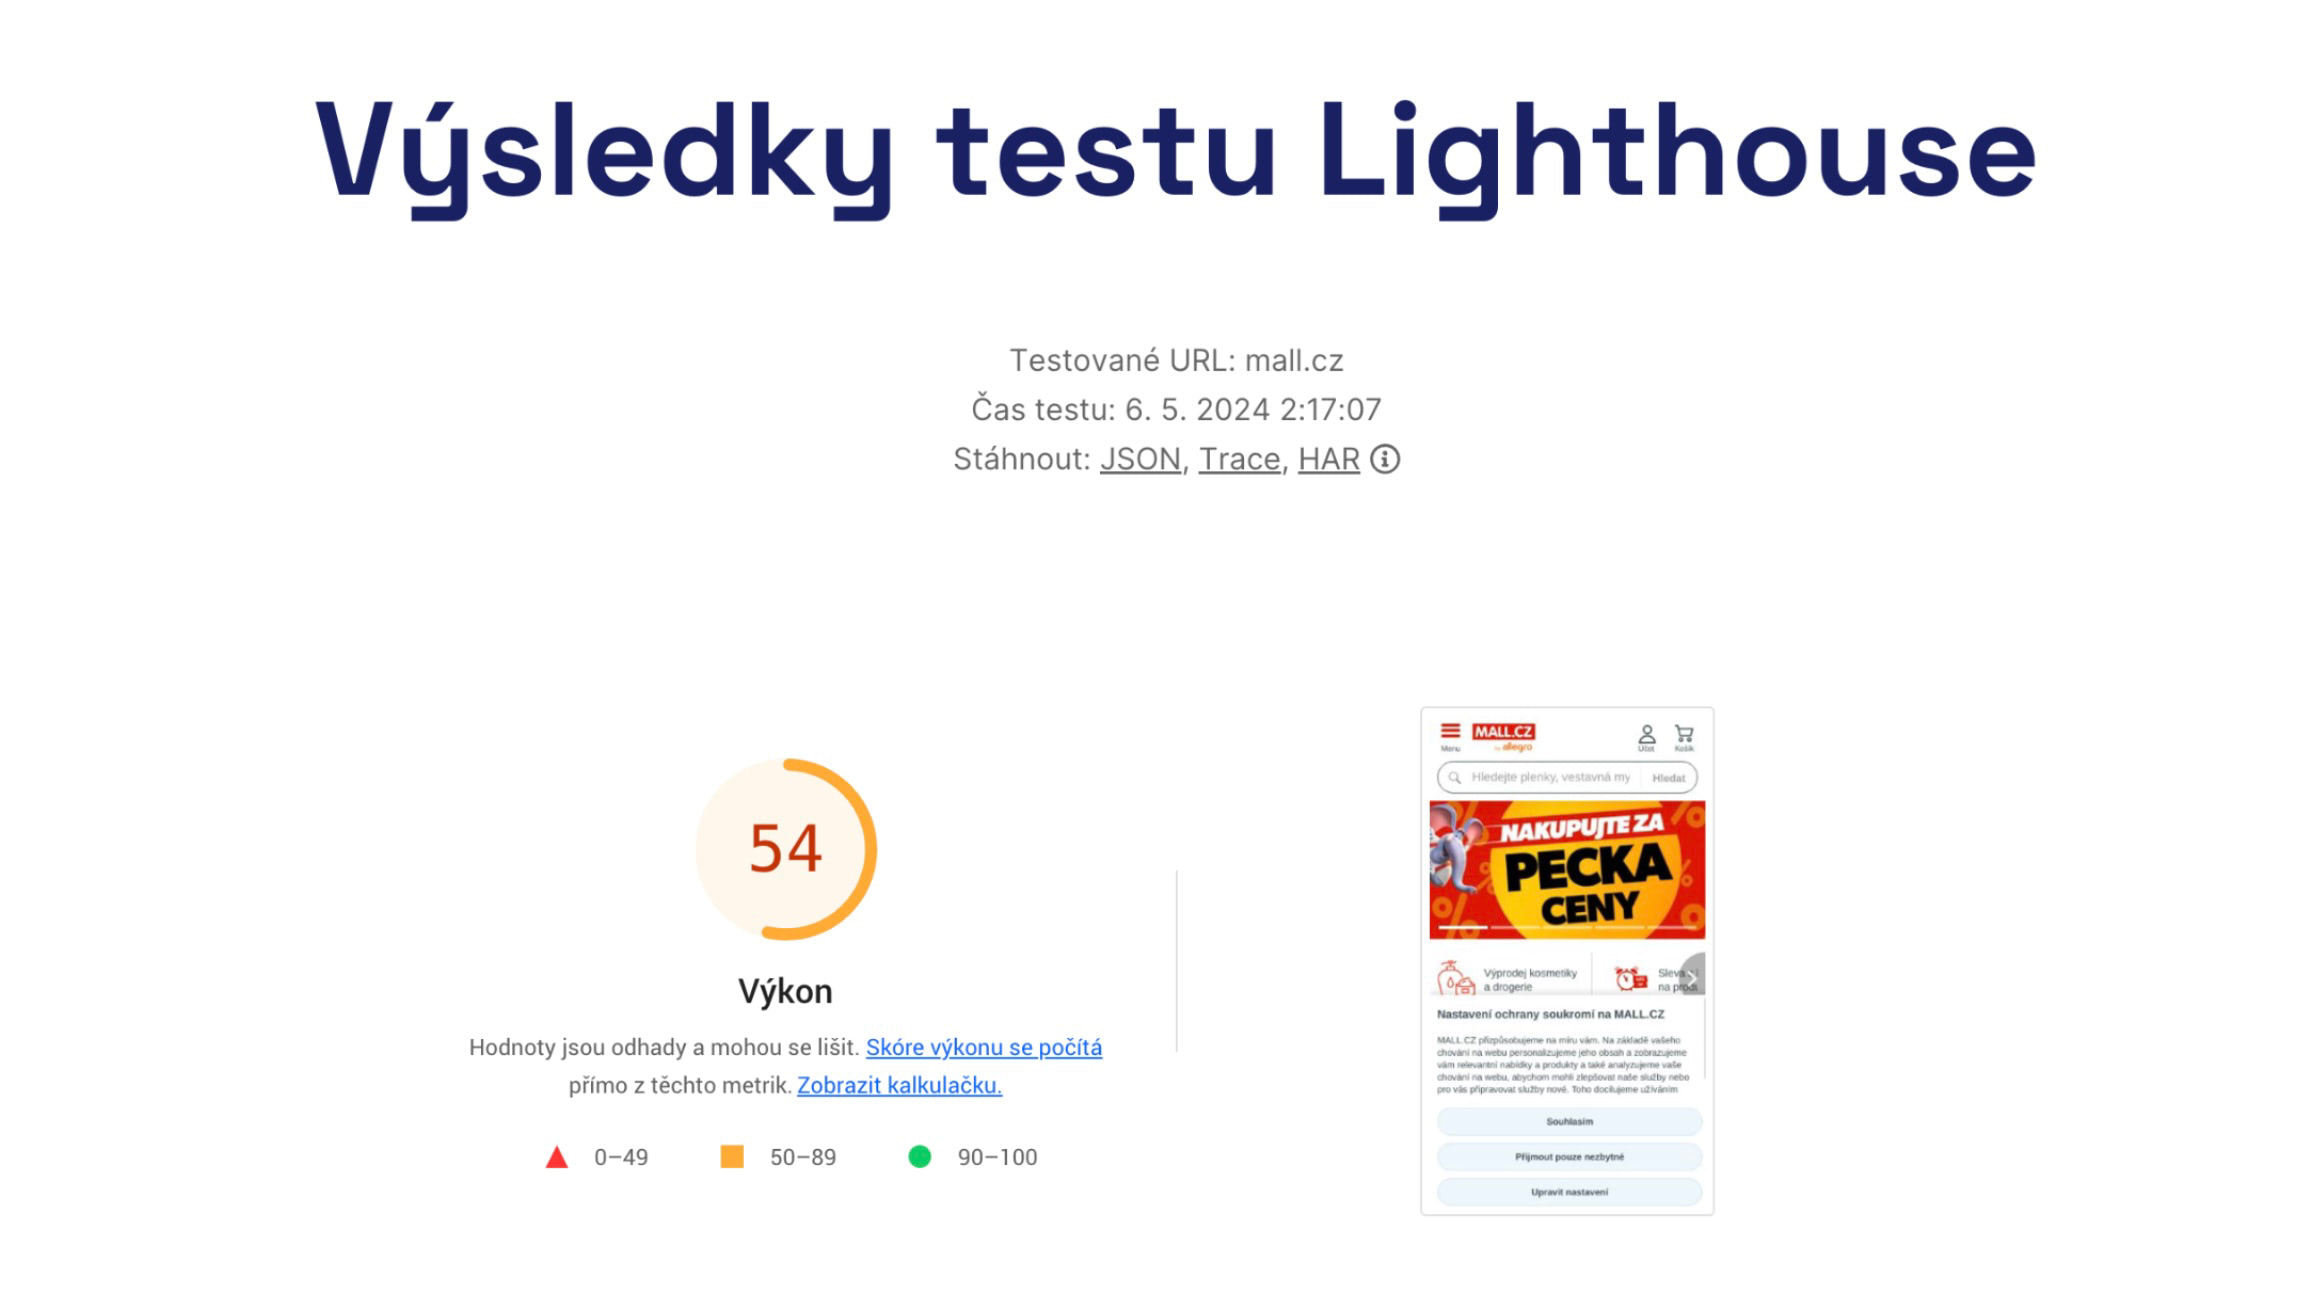 Test run detail.
Before you read further, ensure you understand the differences between synthetic, CrUX, and RUM data about web speed.
It's also best to familiarize yourself with the way we test your websites in monitoring.
How to access the test run detail?
You can view the test run detail as follows:
- Click on a point in the synthetic test results graph.
- In the opened modal window, click on the test time for a specific URL.
- You will be taken to a separate URL for the test run detail.
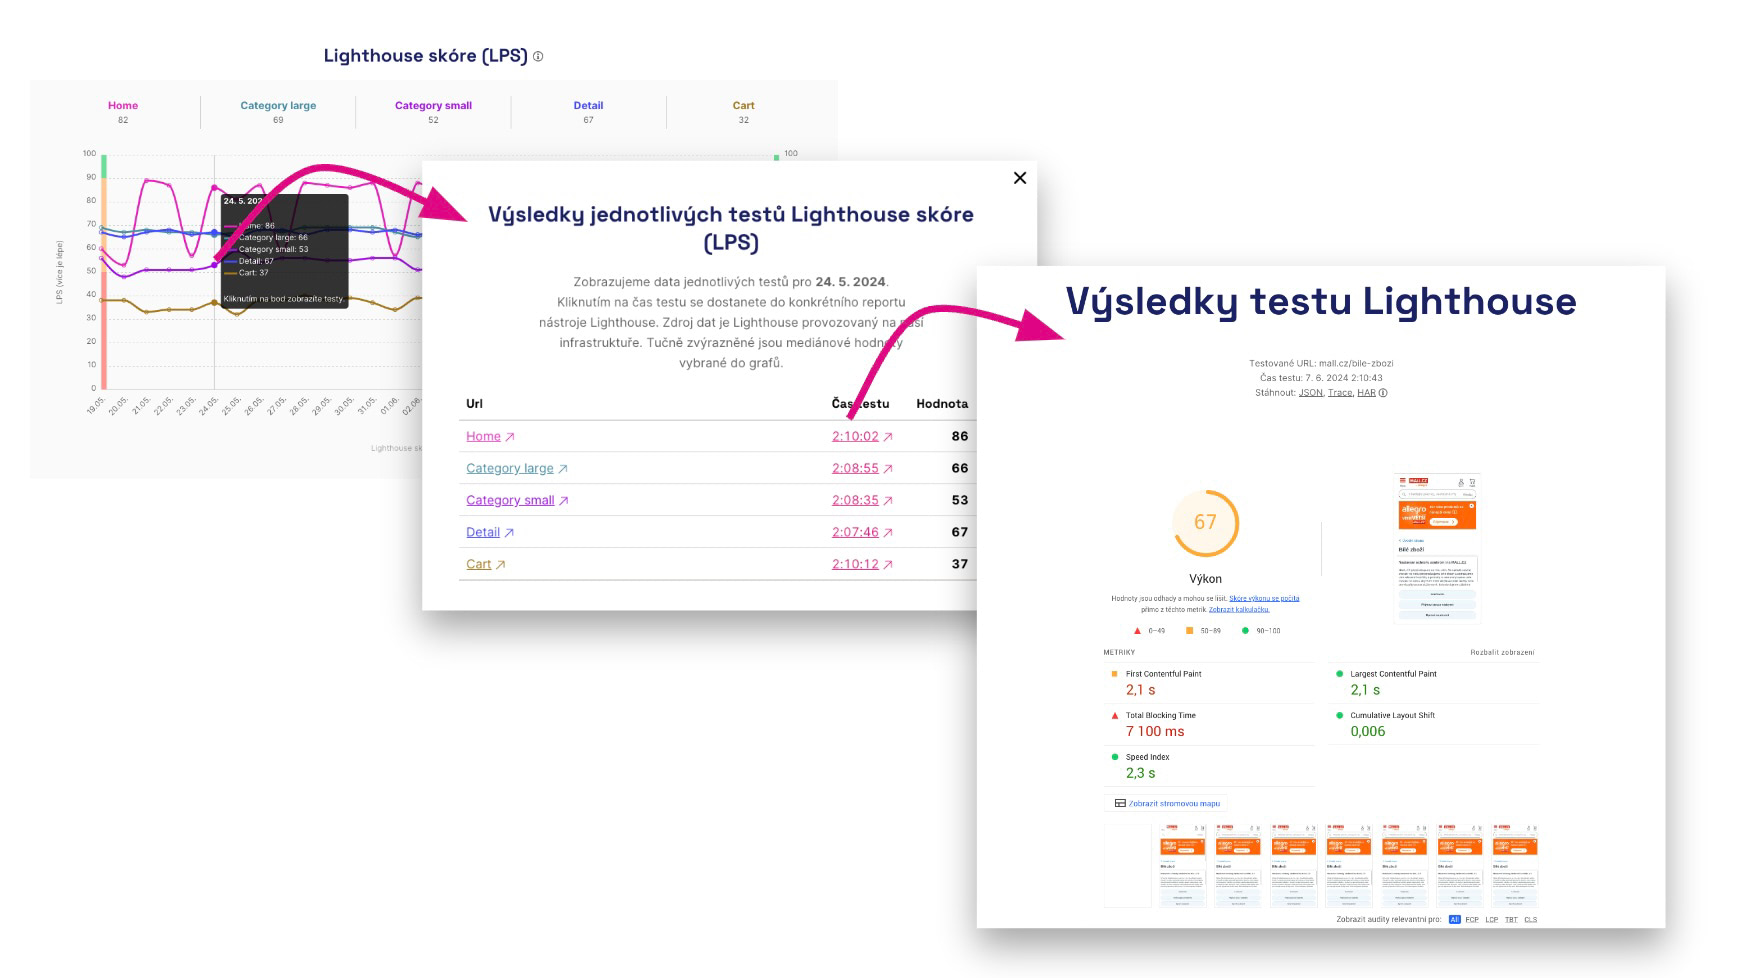 How to access the Lighthouse test run detail.
What will you see in the test run detail?
Let’s break down the individual sections of what you see on the screen and how it might be useful to you:
1) Status of metrics for this test run
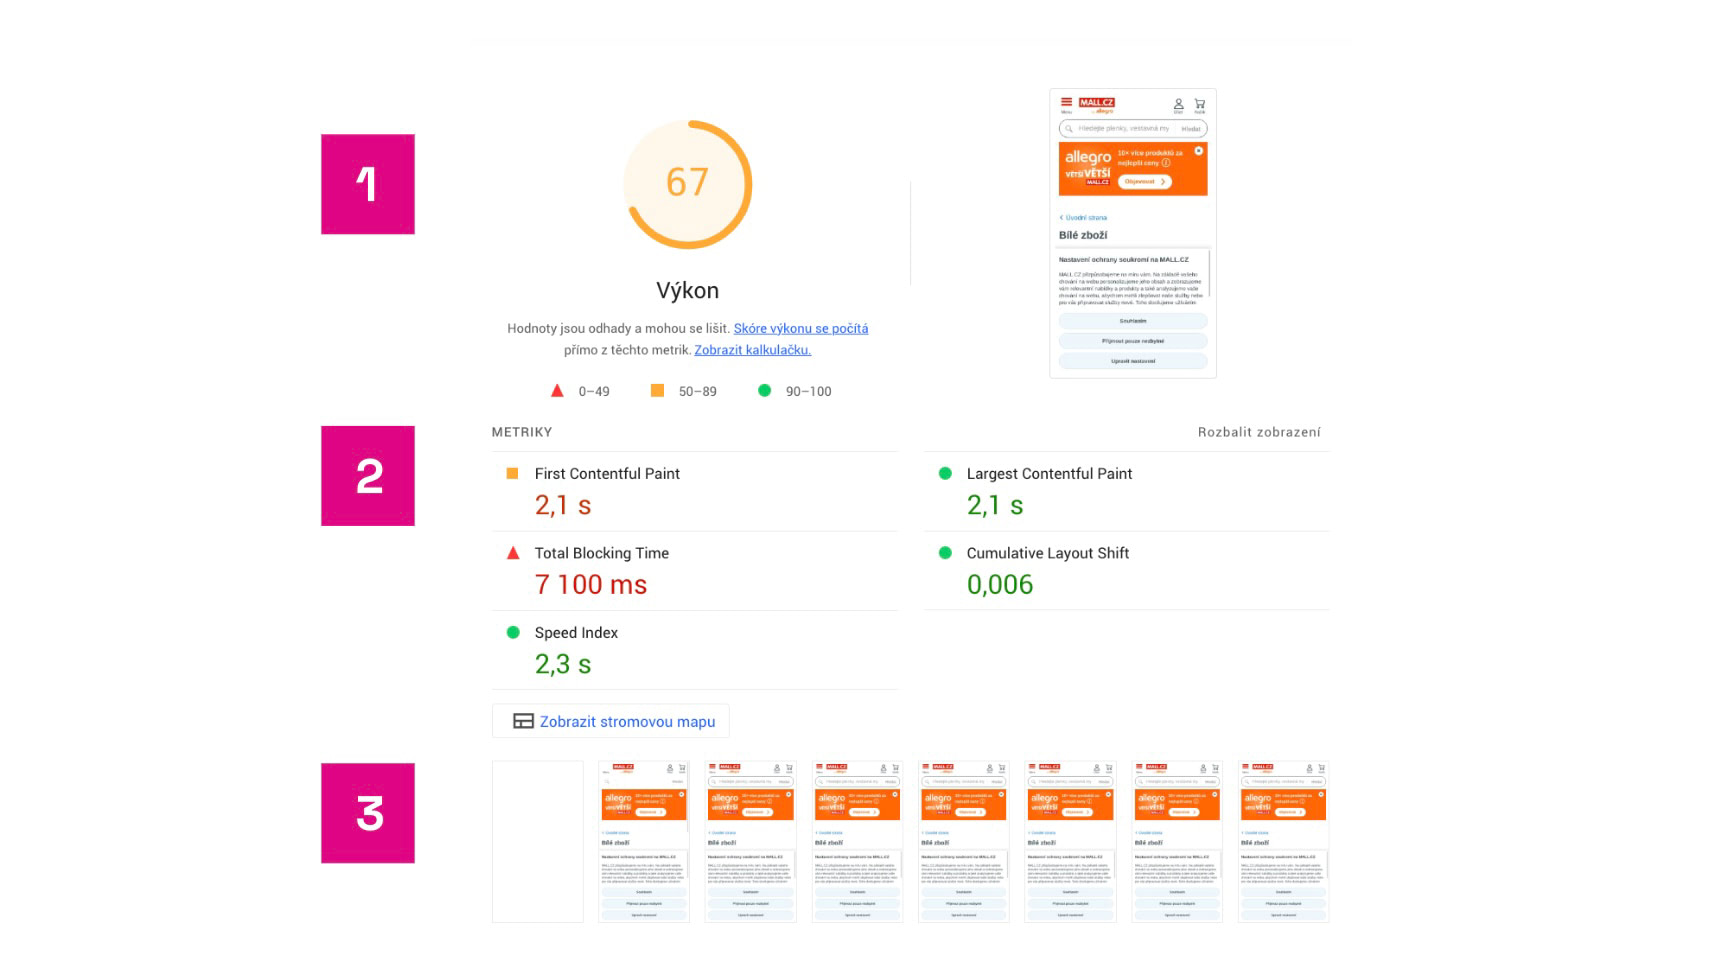 Lighthouse test result and metrics.
Here you will see the following:
- Lighthouse score, i.e., the overall score calculated based on metrics.
- Status of individual metrics. Besides Core Web Vitals (LCP, CLS, TBT, but beware they are measured differently than in CrUX data), you will also see FCP and Speed Index metrics.
- The page rendering process during the Lighthouse test.
Do not cling too much to the metric values here. They are not meant for evaluating your page speed (for that, we have CrUX data). Treat synthetic data as a starting point for speed optimizations. They will easily show whether your optimizations are successful or not.
2) Downloadable files
At the top of the test run result, you can download JSON, Trace, and HAR files. What are they for?
🔒 Downloadable files are only available in monitoring PLUS.
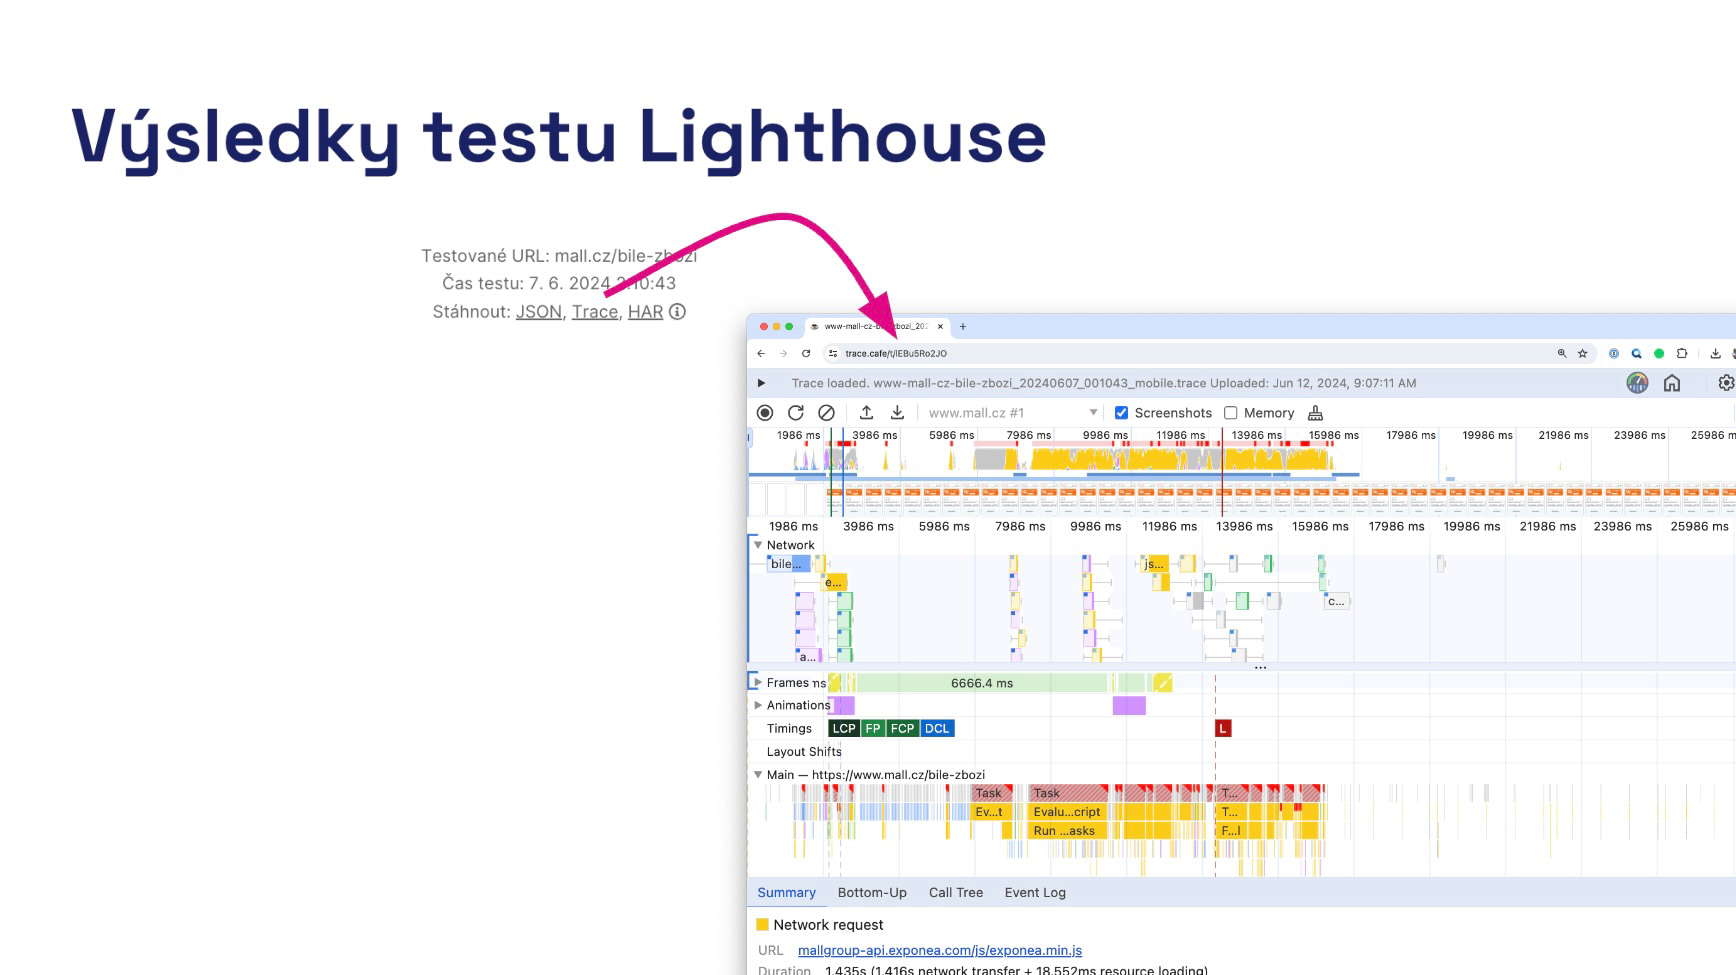 Opening the loading detail of a web page in the Trace.cafe tool.
What are the mysterious abbreviations JSON, Trace, and HAR you see in the image?
All three files are an essential tool for any speed optimizer when they need to find causes of changes or opportunities for improvement.
JSON: Portable Lighthouse report output
Open it, for example, in the Lighthouse Report Viewer or compare it with another test in the Lighthouse Diff.
JSON will be useful for comparing two speed tests in case of a change. Or use it to save a test that shows unexpectedly positive or negative results.
Trace: Detailed page performance report
In our web speed consultancy, Trace is considered the most crucial snapshot of the actual speed of loading and subsequent page performance.
The Trace file can be opened in the Performance tab within Chrome DevTools or perhaps in the Trace.Café tool.
Michal Matuška talks about the Performance tab and other tools in Chrome DevTools in this video.
HAR: Page download report
This is a supplementary report that shows you potential issues in the page loading itself in detail, including prioritization of elements, their loading sources, the protocol used, or compression.
Open it, for instance, in the Network tab inside Chrome DevTools.
3) Optimization recommendations
Beyond metric values, it is important for web optimization to know what to do when you want to optimize websites.
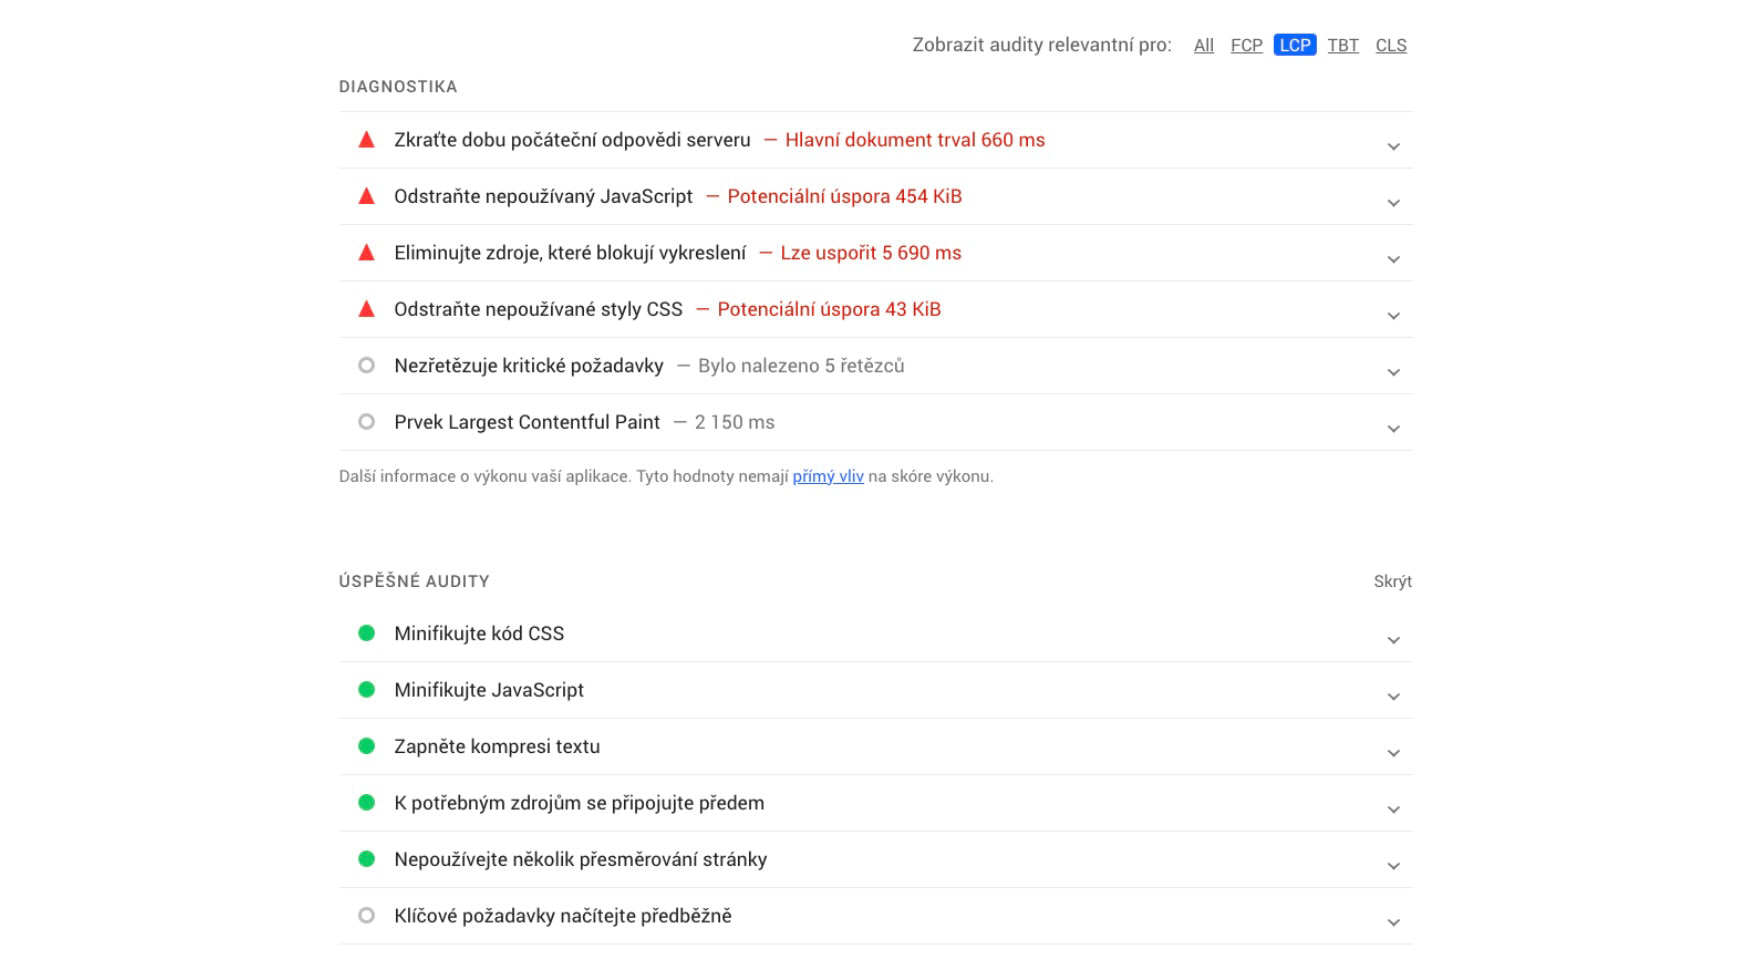 Lighthouse has several recommendations for you.
Lighthouse recommendations should, of course, be taken with a pinch of salt. Some important recommendations may not appear here at all, and Lighthouse will never consider the efficiency of specific recommendations within your technological setup. Some of these recommendations are difficult to implement in a reasonable time or may not have a significant impact.
From version 4.10, you can also run manual measurements and set more measurement times (beta); summary in the changelog for release 4.10.
Lighthouse tool error messages
In the test, you may see various error messages, which we will discuss here:
Timeout exceeded
The most common error is the inability to complete the entire test cycle due to exceeding the time limit that Lighthouse has for running on our infrastructure. This may manifest as errors like NO_TTI_CPU_IDLE_PERIOD or PROTOCOL_TIMEOUT.
In our experience, however, some of the five tests always pass, which is why we test five times. If this does not happen, contact us.
Page failed to load completely
Another possibility is errors where the page fails to load at all, such as:
ERRORED_DOCUMENT_REQUEST– the requested page could not be reliably loaded.NO_FCP– the page did not render any content, not creating the FCP metric.NOT_HTML– the page is not HTML, it was delivered with the MIME typetext/plain.
In such a case, make sure the page exists and if so, whether access is not blocked to robots or hidden behind a login or VPN.
Summary and where to go next?
The test run detail allows you to obtain truly detailed data from synthetic Lighthouse tests. For developers, it is very useful to learn to work with this page.
Our How we test and this Test run detail describe how to optimize your website speed using pagespeed.one.
Speed Monitoring PLUS
Try our monitoring app free for a month.
5,400 CZK annually per website. Invoice only, no credit card needed.