How Do We Measure Website Speed?
Discover in this text how we precisely download and process website speed data in the monitoring of pagespeed.one.
Before you continue reading, make sure you are familiar with the differences between various types of speed measurements (CrUX, synth, and RUM) and that you know the basics of our speed monitoring.
Data from Google Users
We collect Core Web Vitals metrics (LCP, INP, CLS) from the Chrome UX Report (CrUX) for display in our reports as follows:
- In monitoring PLUS, we download and add them to reports daily during night hours. This applies to both Page reports and Domain reports, as well as all instances of CrUX data across the application. This is true for both mobile and desktop.
- In free tests, we do not download data for pages at all. We download data for domains once every two days, alternating between mobile and desktop.
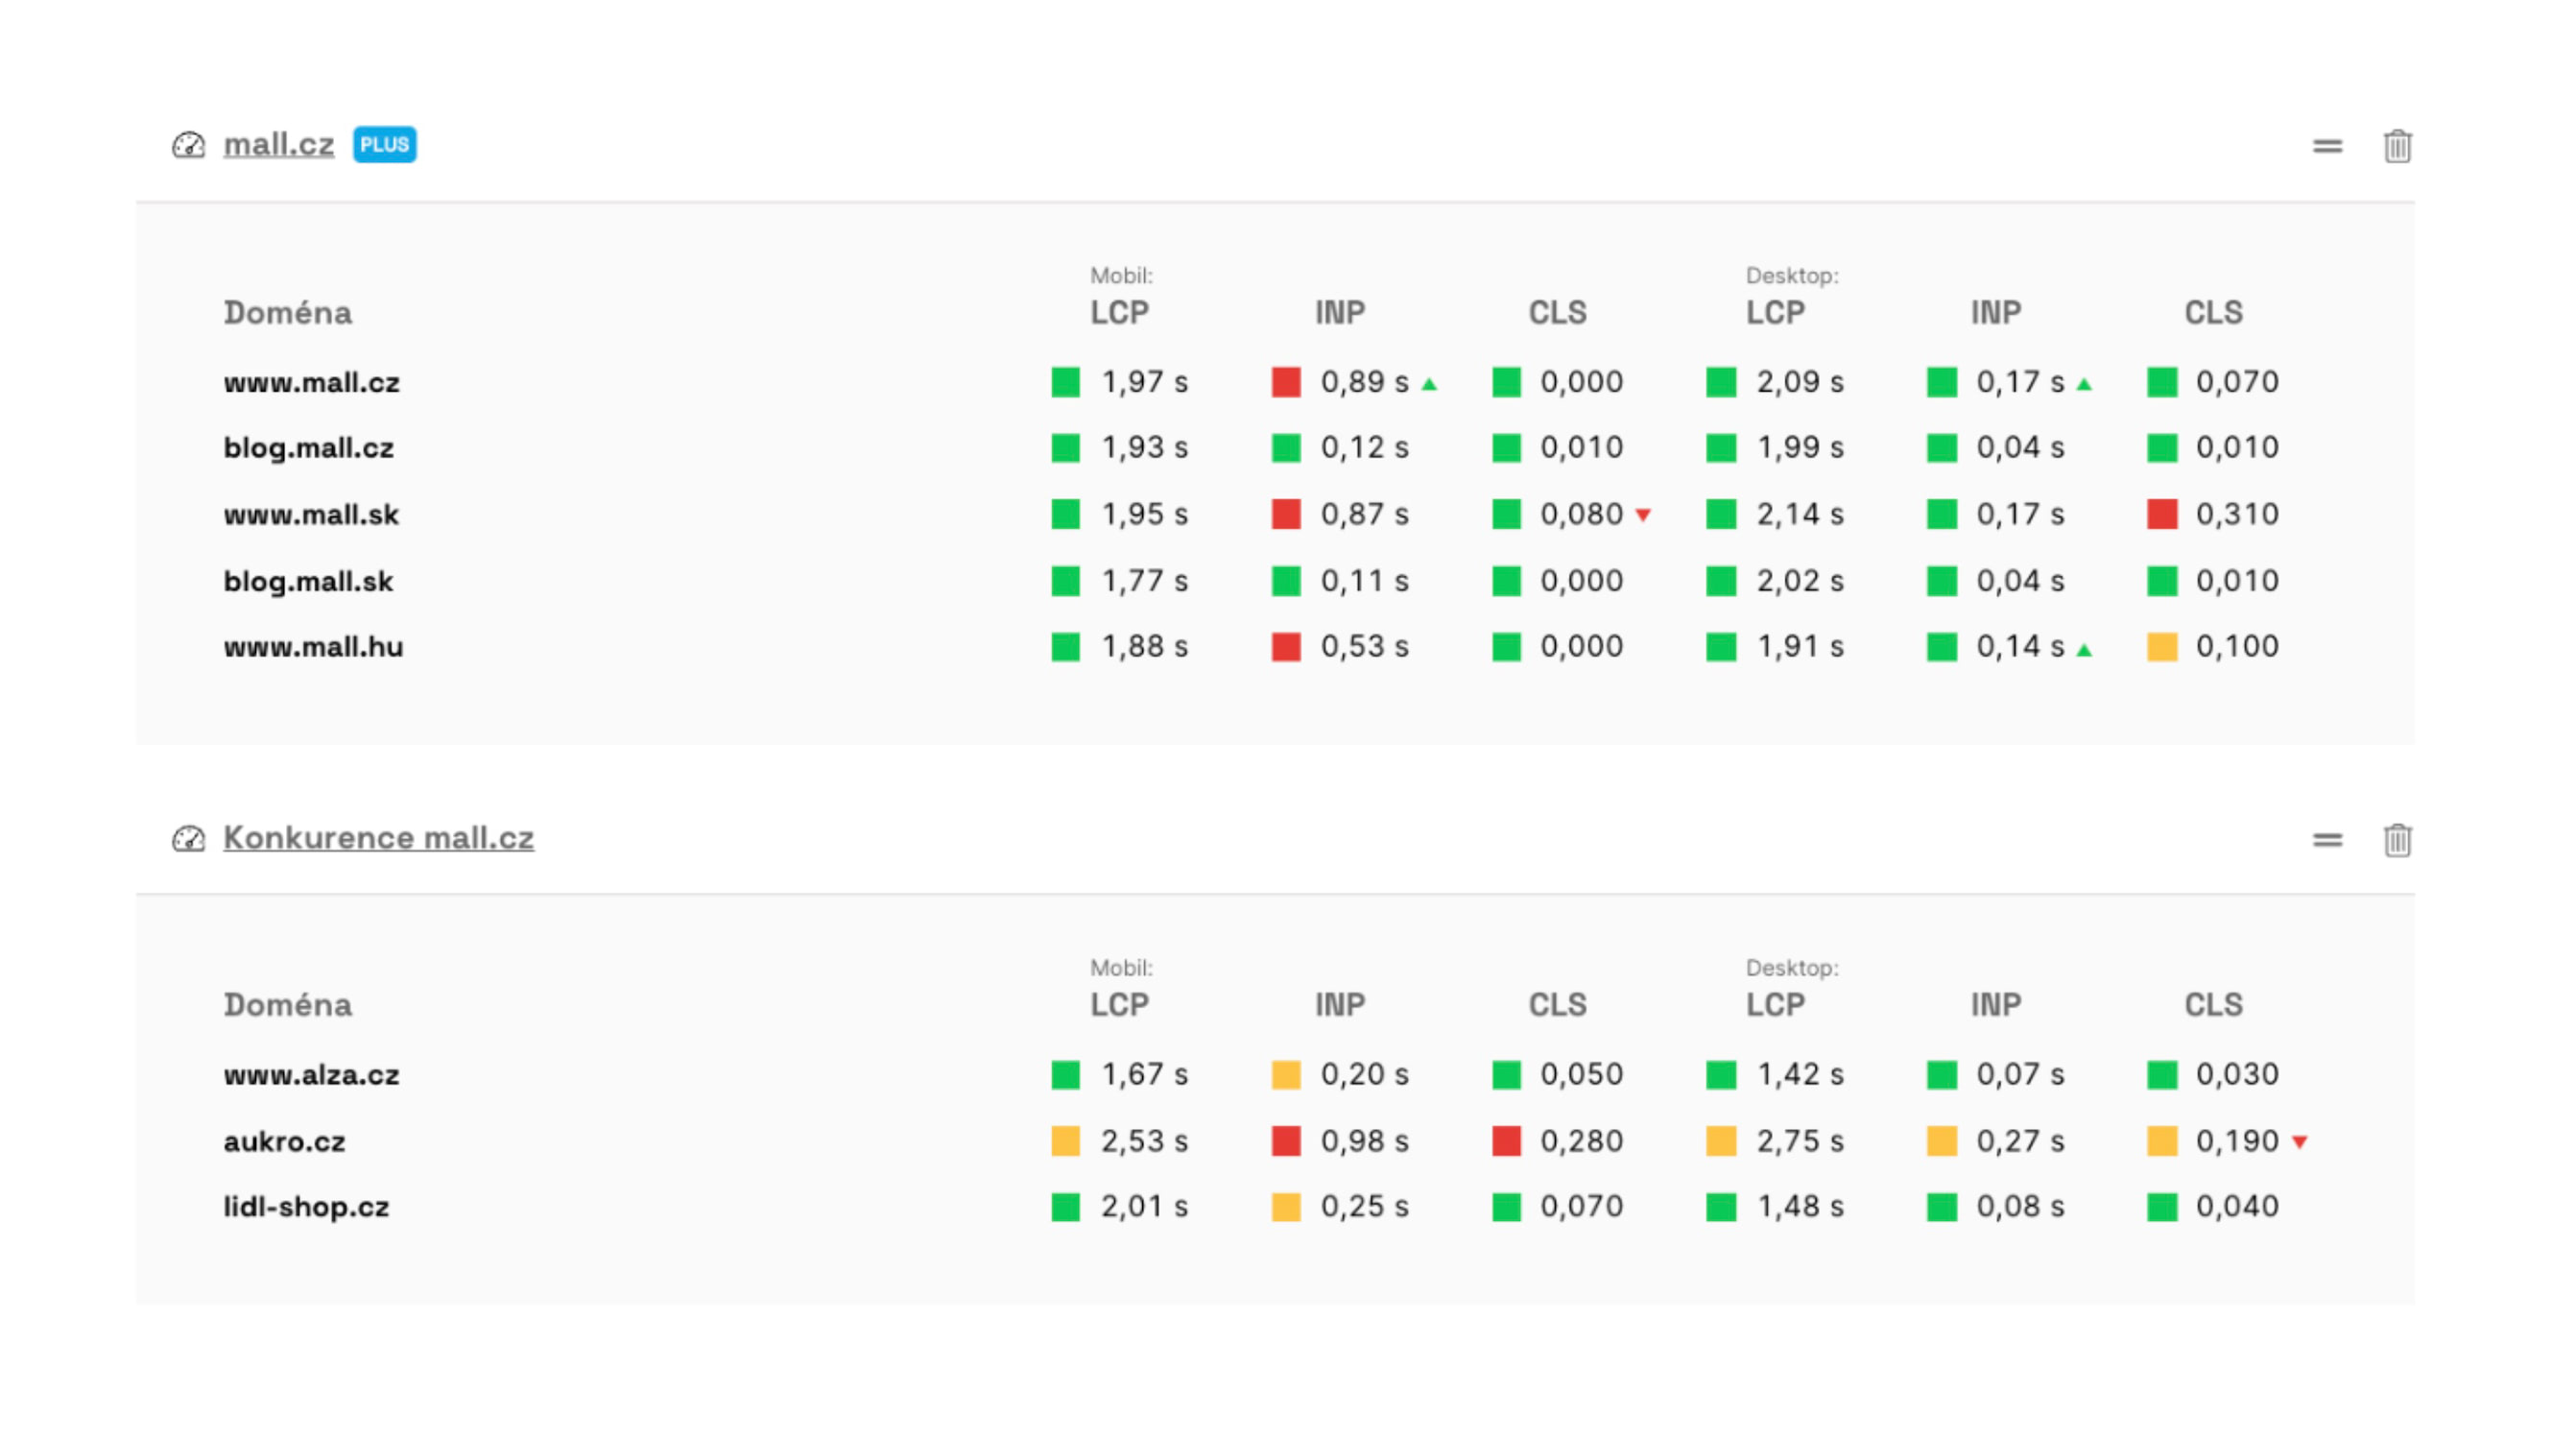 You can see data from the Chrome UX Report in the main dashboard of your team.
Data for monthly metric trend graphs (in the Domain report) is downloaded once a month. The data is released every second Wednesday of the month, and we process it within a few days afterwards.
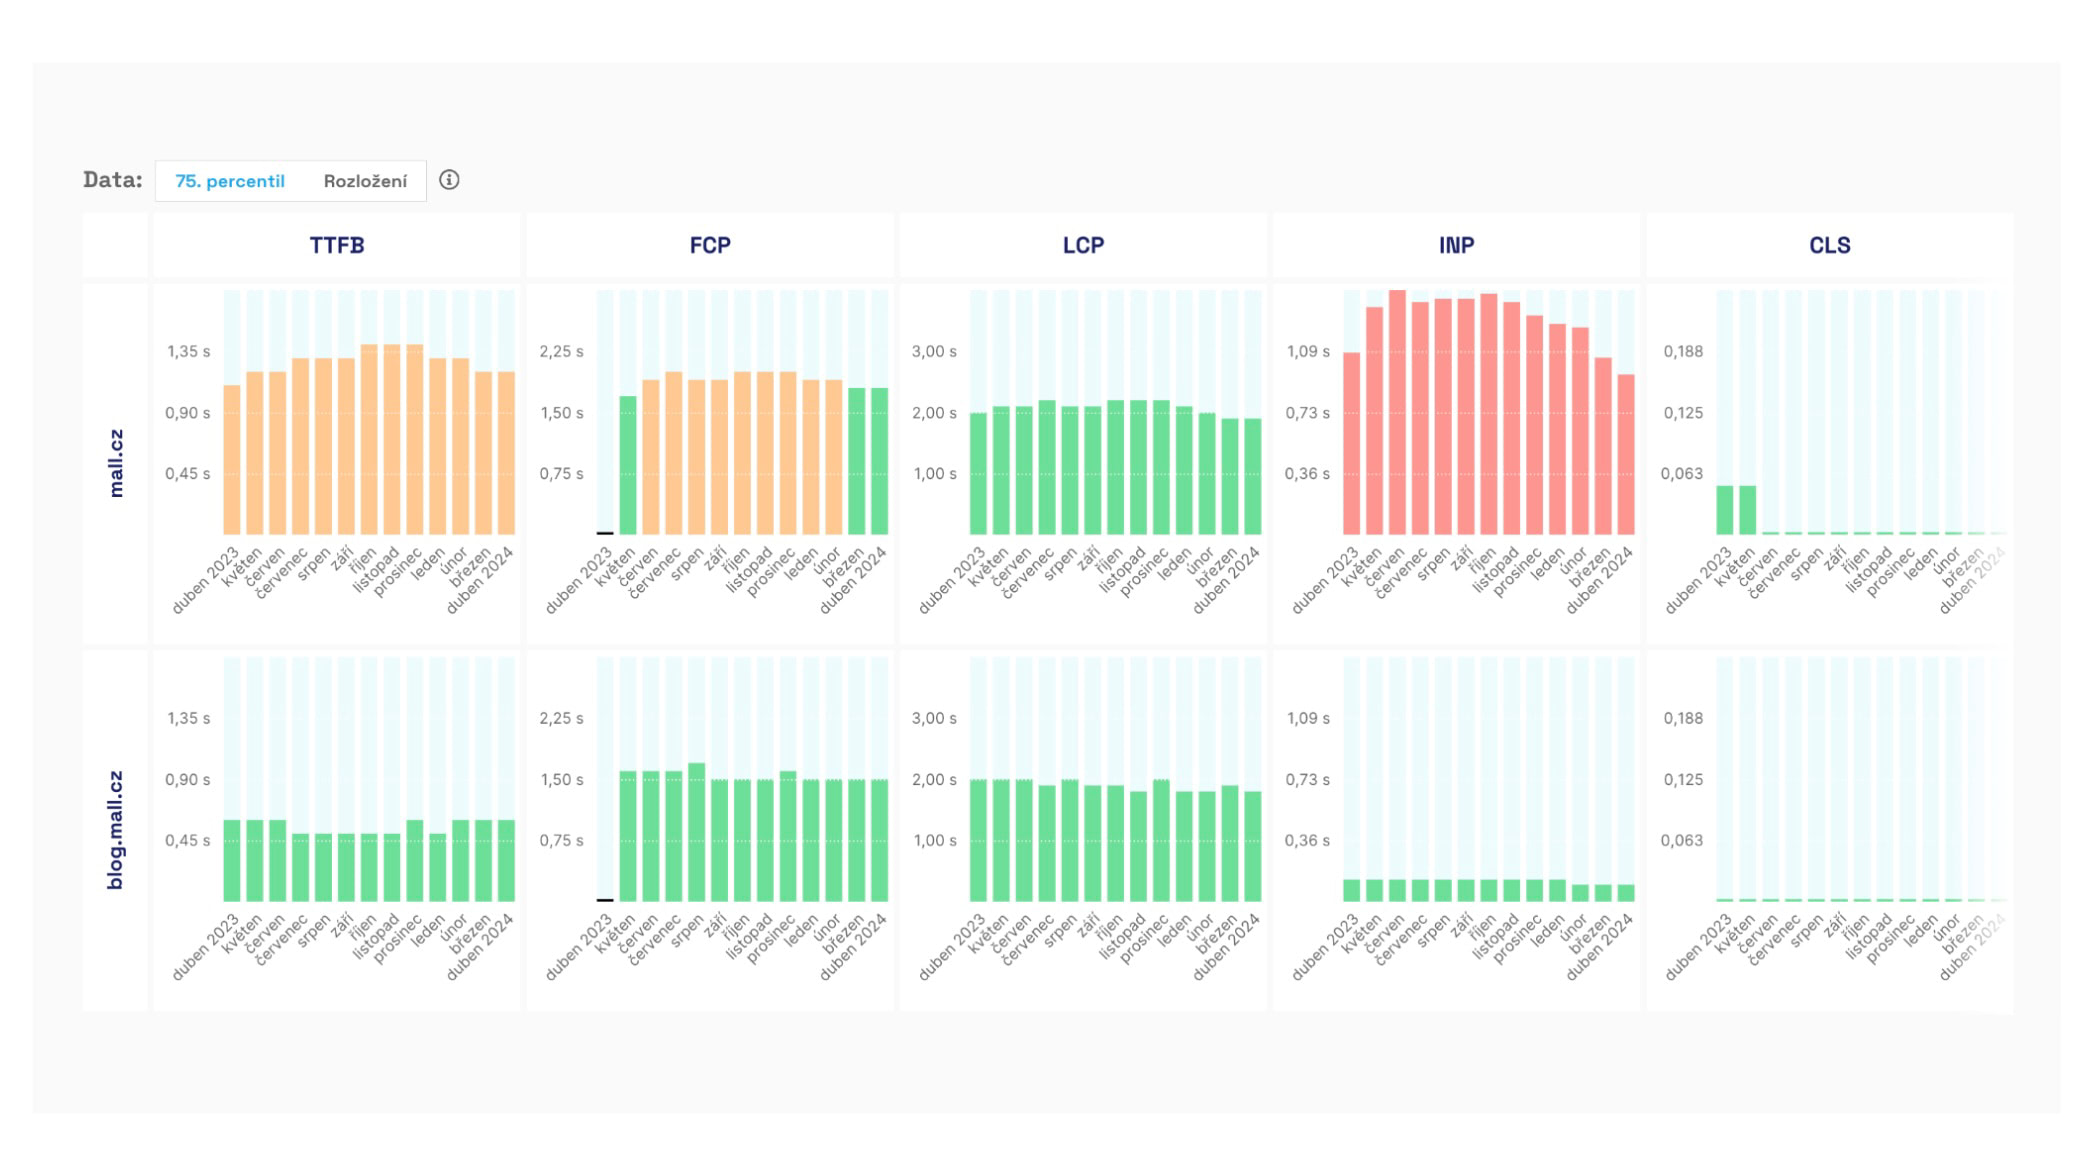 Monthly metric trends in the Chrome UX Report displayed in the Domain report.
Synthetic Data
We obtain data from synthetic Lighthouse tests in two ways:
- In monitoring PLUS, we run Lighthouse on our own infrastructure multiple times a day. We explain this in more detail below.
- In free tests, we download less precise data from the PageSpeed Insights API once every two days for both desktop and mobile.
Let's now look at how we conduct synthetic measurements in monitoring PLUS. From version 4.10, you can also perform manual measurements (beta), set multiple measurement times (beta), and test execution is significantly faster — details in the release 4.10 changelog.
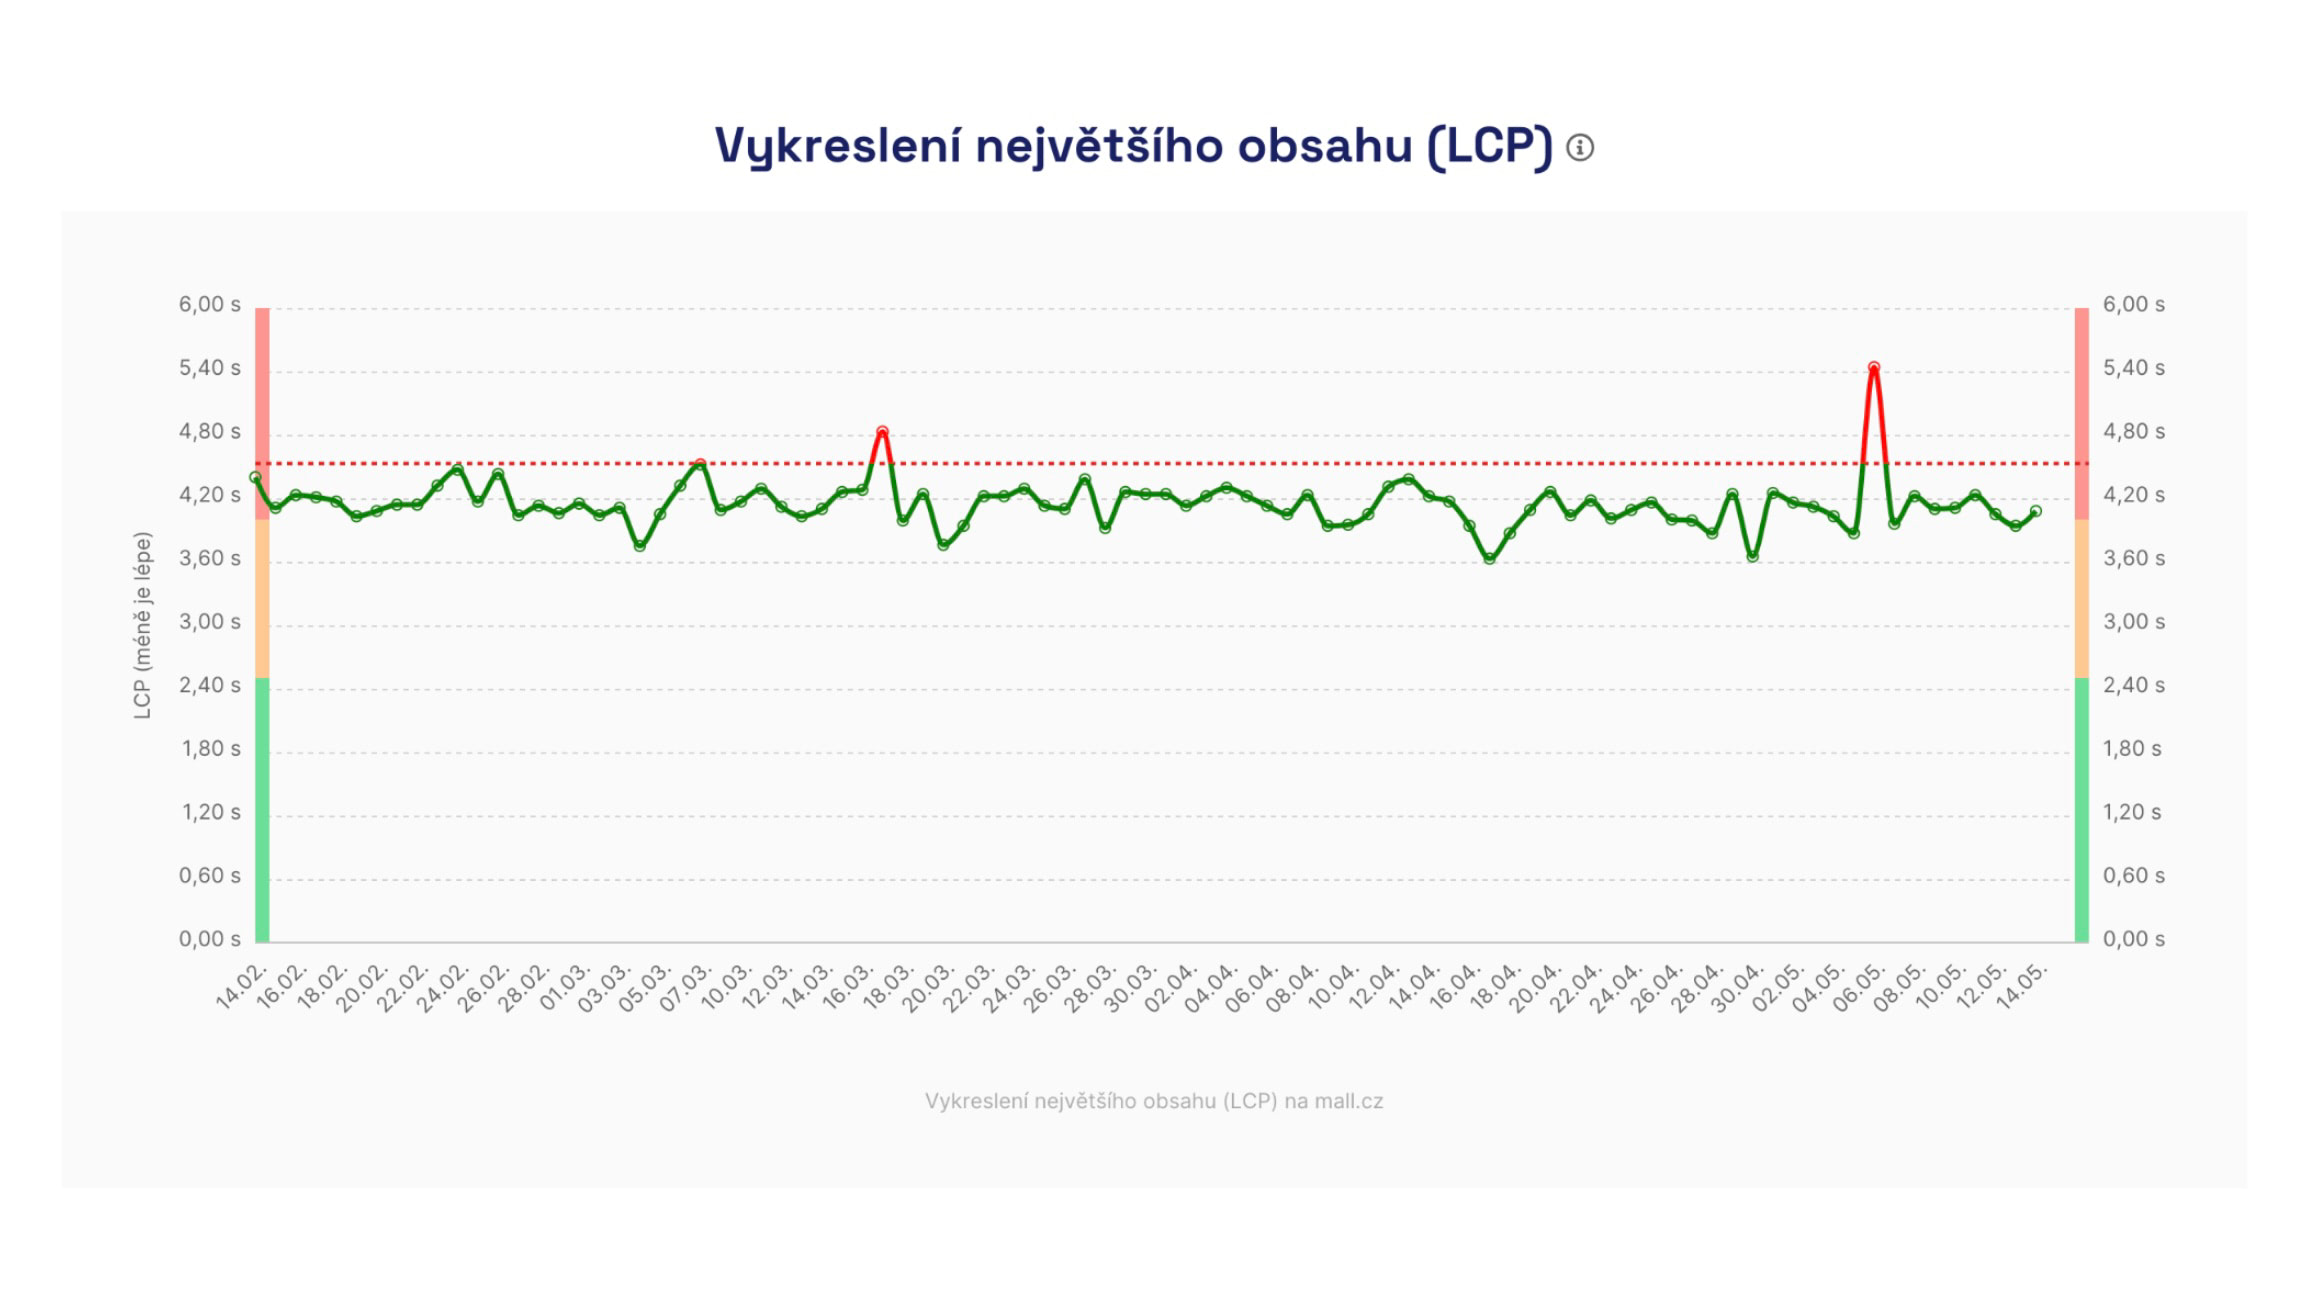 Synthetic data is used for daily information gathering, such as for the Speed Watchdog.
Synthetic Measurements in monitoring PLUS
🔐 This type of measurement is performed in monitoring PLUS.
Based on our experiences with other tools during web speed consulting and numerous experiments conducted during the development of our monitoring, we have arrived at the following method for testing each URL.
We test during night hours, five times in quick succession, and this is run once a day.
Night Hours
For short-term (days) and longer-term (months) data collection of Core Web Vitals metrics, we consider night times to be best practice.
At night, your servers are not under as much load, allowing us to test more calmly and observe long-term trends or speed deterioration. The server response speed (TTFB metric) affects the user metrics we monitor, such as LCP or FCP.
We find that night results are much more stable and provide more insight into the metrics' development over time.
If night hours are inconvenient for you, for instance, if tests coincide with ongoing website maintenance, you have the option to change the test time in the test settings.
Five Times in Quick Succession
We know that one-off tests, like those done using PageSpeed Insights in our free tests, can show inaccurate results.
Through experimentation, we determined the need to conduct five tests, which eliminates most inaccuracies and achieves maximum stability in numbers. The tests are conducted several minutes apart, and the exact times are always visible in the Lighthouse test details.
Once a Day
Each URL is typically tested within a few minutes, and these tests are conducted once a day, always during the night.
Why Do We Test So "Infrequently"?
Occasionally, we are asked why testing occurs only in a short daily time frame. Why don't we conduct synthetic testing every minute, for instance?
It is rather important to clarify that our monitoring is for testing user metrics, namely Core Web Vitals and others. It is not for monitoring server availability or its load. Other tools like Uptimerobot.com or Updown.io serve that purpose.
Moreover, synthetic measurements should not replace user data, which serves to collect precise information about website performance, not just across all daily times but also across all other user segments.
For tracking changes among users, we collect data from the Chrome UX Report and deploy SpeedCurve RUM for larger websites.
What Do We Test On and How Is Measurement Set Up?
Testing is conducted on European Amazon Web Services (AWS) infrastructure, currently from Frankfurt am Main.
We carefully select testing machines to minimise fluctuations, especially in javascript metrics such as Total Blocking Time (TBT).
Though rare, fluctuations caused by the measuring infrastructure can occur. In such cases, we inform about these situations in the changelog and add automatic notes to graphs.
And how is the measurement set up? From October 2024, the throttling of both measurements is as follows:
| Device | Download | Upload | RTT (round-trip time) |
|---|---|---|---|
| Mobile | 1.6 Mbit/s | 0.75 Mbit/s | 100 ms |
| Desktop | 10 Mbit/s | 10 Mbit/s | 40 ms |
What URLs Do We Actually Test?
The URLs you enter in the test settings may not be identical to the URLs we ultimately test. We call this URL the final URL.
Why does it differ? Web servers commonly perform redirections – for instance, from example.com to www.example.com, from HTTP to HTTPS, or adding a slash at the end of the address. Our tool (we call it the "redirector", more in the release 4.10 changelog) follows these redirections and finds the actual final URL, on which the test is then conducted.
Where can you find the final URL? In the application, you'll see it in tooltips over metric icons in tables (under the description "Tested URL") and in the test run details.
Why might the final URL differ between synthetic and user data? Each data source returns the final URL in its own way:
- Lighthouse (synth)
returns the URL where the test actually ended, after all redirections. This URL usually corresponds to the output of the redirector, including any query parameters. - CrUX API (user data)
returns the URL for which it has real user data. It may remove some query parameters if it doesn't have enough data for them and performs its own redirections.
Therefore, it may happen that you see a different tested URL for the same page in the user data table (CrUX) than in the synthetic measurements table (Lighthouse).
How to Allow Our Bot on Your Website?
It may happen that you want to test an unfinished version of your website, or perhaps a preview (e.g., beta, test, staging, pre-production), which is hidden behind some form of protection.
Sometimes, speed testing might not succeed even on production websites. Our testing robot can become a "victim" of bot-blocking on your infrastructure.
However, it is possible to allow our robot through one of these two methods:
- Detect the user-agent string. Our robot contains words like
PageSpeed.ONEorChrome-Lighthouse. - Detect the IP address. Our robot comes from the address
18.192.177.19.
If your infrastructure uses a WAF (Web Application Firewall), you need to add a new rule that skips blocking in case of access from our IP address, as mentioned above. This may occur with providers like Cloudflare, Azure, or others.
How to Measure Websites with HTTP Authentication?
HTTP authentication (often in the form of HTTP Basic Auth) is a simple way to protect a website, requiring a username and password immediately upon page load.
It is mainly used for staging or development versions of a website, and you can use it in the same way for synthetic testing in PLUS monitoring.
Be cautious, though, as a website behind authentication tends to be rather slower. Due to HTTP auth, you might see metrics like TTFB, FCP, or LCP worsen by dozens of percent. Here's why.
How to Set HTTP Basic Auth in Measurements?
Our tests handle HTTP authentication – just enter the URL along with login credentials in the tester. Access works via standard Basic Auth, just as a regular browser login would.
In the test settings, add URL addresses with login credentials:
https://username:password@test.example.com/url
Impact on Measurement Results
Websites running on staging environments often have unstable server responses. Typically, they run without cache, without CDN, sometimes in debug mode. The result is a slowdown of all loading speed metrics (TTFB, FCP, LCP).
HTTP authentication itself adds approximately 450–500 ms of delay, again impacting loading speed metrics.
The impact of HTTP authentication can be seen in HAR files or Tracy in the test run details during phases like Stalled or Request sent.
How to Measure More Accurately on a Staging Server?
If you need to measure a staging or non-public version without distortion:
- use a backdoor based on IP address, as mentioned above, or User-Agent string, as mentioned above
- set an exception for our bot, as mentioned above
By doing so, you'll obtain cleaner data that isn't delayed due to HTTP authentication.
Try our PLUS speed monitoring.
Speed Monitoring PLUS
Try our monitoring app free for a month.
5,400 CZK annually per website. Invoice only, no credit card needed.
Tags:MonitoringMonitoring PLUSCrUXSyntheticLighthouseDevelopers