How to Evaluate Watchdog Reports?
 Martin MichálekUpdated 1/26/202614 minutes reading
The Watchdog monitors the speed of the pages measured on your site daily in the PLUS monitoring. If a key metric changes, the Speed Watchdog will alert you. In this text, you will learn who and how should evaluate these reports.
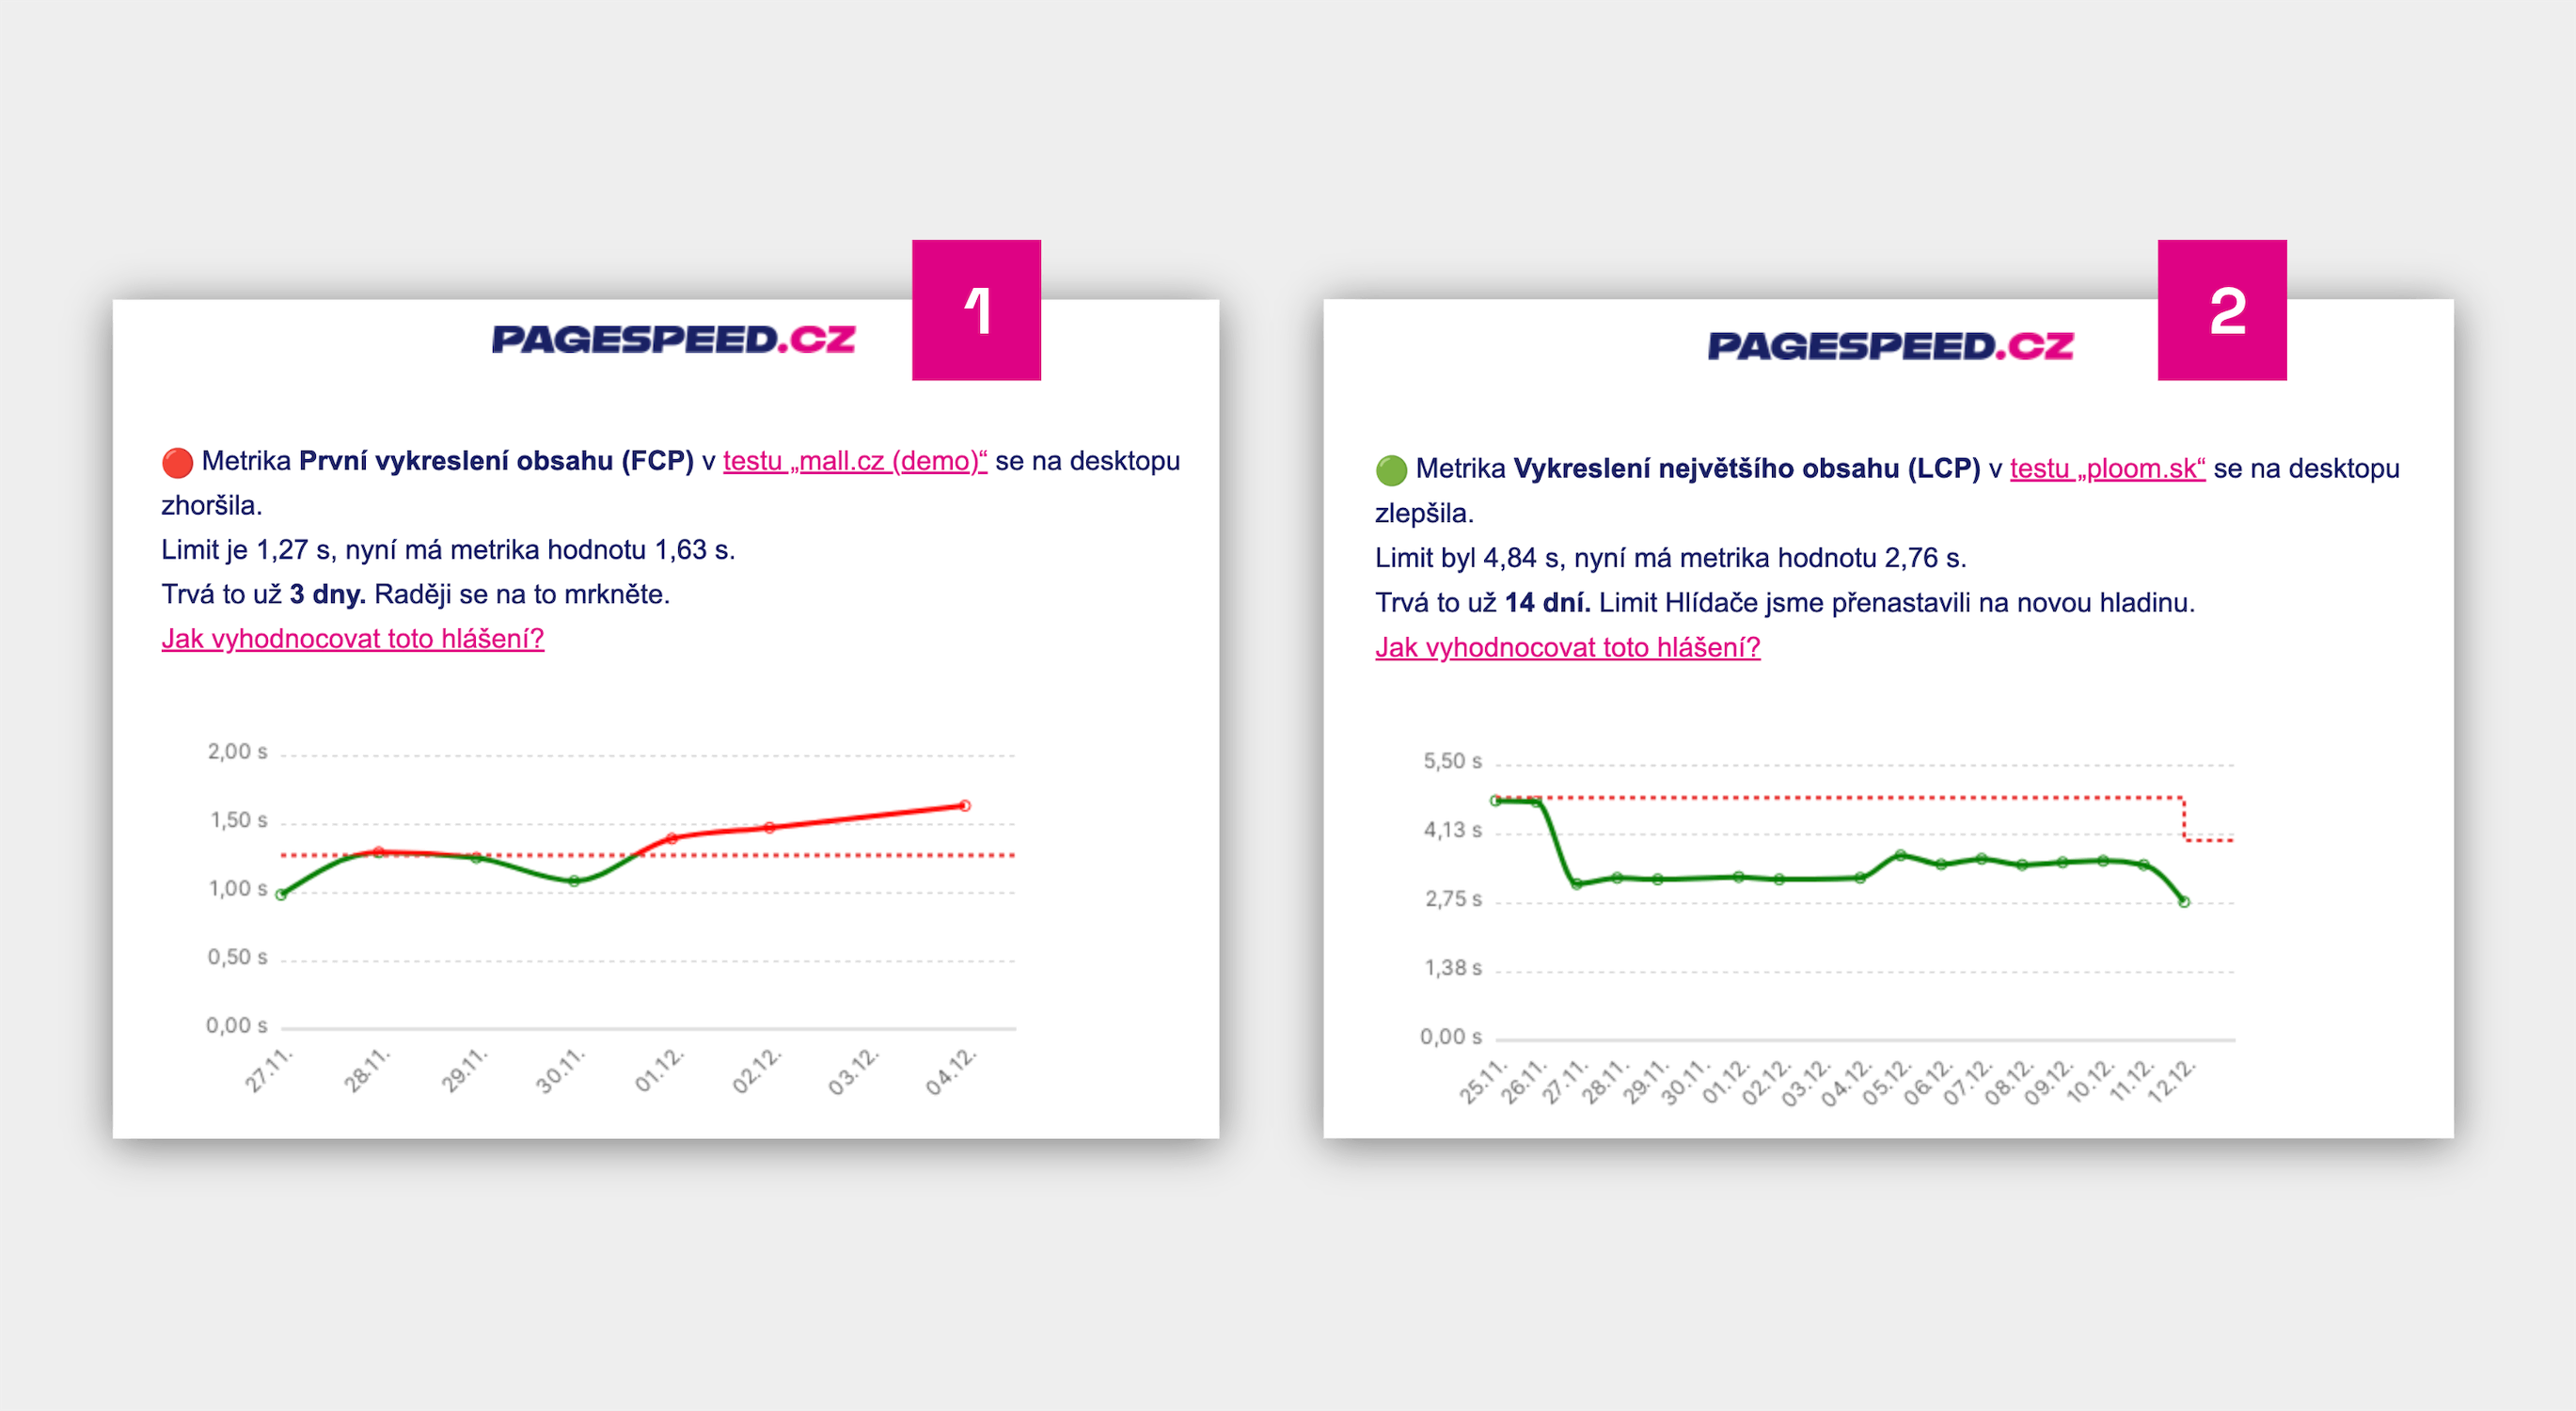 A Speed Watchdog report has arrived. What to do with it?
We've fine-tuned the Watchdog based on experience from our consulting work for clients and use it ourselves, but evaluating its reports still requires some knowledge.
Due to the nature of synthetic measurements, for instance, the Watchdog might send a notification even when there's no significant issue on the website.
With the knowledge gained from this text, you'll be able to handle Watchdog reports effectively.
How Does the Watchdog Work?
In brief, the Watchdog operates as follows:
- It gathers data from synthetic measurements. (See the difference between various measurement types.)
- Every day, it tests all URLs entered in the test settings.
- It creates a single number for the entire site for each speed metric from these data.
- Each metric has set limits for allowable changes.
- If the limit is exceeded, you receive a notification via email or in Slack or Teams.
More about how the Watchdog works.
Reports Are Primarily for Developers
We recommend that developers and those in your team who focus on website speed daily primarily monitor the Watchdog. It requires technical knowledge and time.
For managers, marketers, UX professionals, and other similar roles, we have different reports in PLUS monitoring. For instance, a monthly email report on speed status or a team dashboard.
Hence, we recommend managers turn off Watchdog notifications:
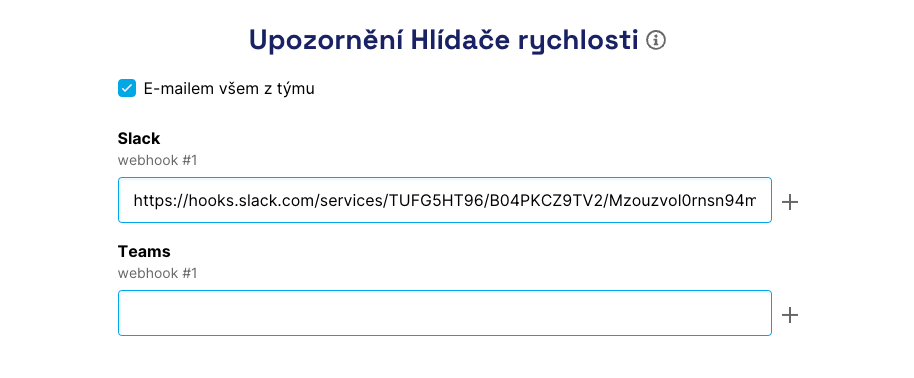 You can turn off Watchdog notifications in email settings if your colleagues are already monitoring the changes.
How to Generally Evaluate Reports?
If an email or Slack notification has arrived, your first questions for evaluating the report should be as follows:
- Does the change also affect user metrics, i.e., CrUX data?
- Were there any deployments on the website on the days the metrics changed (visible in notes)?
- Which specific type pages are influencing this change?
- Is it possible to see the change in the test run detail?
TIP: Test run detail and How we test describe the functionality of PLUS monitoring and the Watchdog using a specific problem example.
Does the Change Affect User Metrics?
The more experienced among you already know that not all metrics are created equal. The Watchdog collects data from synthetic measurements daily, but we are interested in their impact on user data.
We cannot yet evaluate user data (CrUX) daily because they have a delay of several weeks.
Let's evaluate the change in the Watchdog. Check the Domain report, where we have data from the Chrome UX Report (CrUX). Is there a problem visible in the same metrics? Here are some details to help you:
- It's good to know that CrUX data is calculated cumulatively for just under a month backward, so in domain data, you might see only a small change. Even that can be suspicious.
- Also, know that a change in user data might take up to three days after the actual website change to manifest.
- Finally, remember that not all user-acquired metrics can be measured synthetically. See guides for specific metrics below in this text. For example, synthetic TBT metric might (or might not) affect interaction speed, i.e., INP.
Remember that user data (CrUX) is calculated cumulatively over the last 28 days and can have a delay of several days.
Continue with further evaluation steps only if you see changes both in the Watchdog and user data.
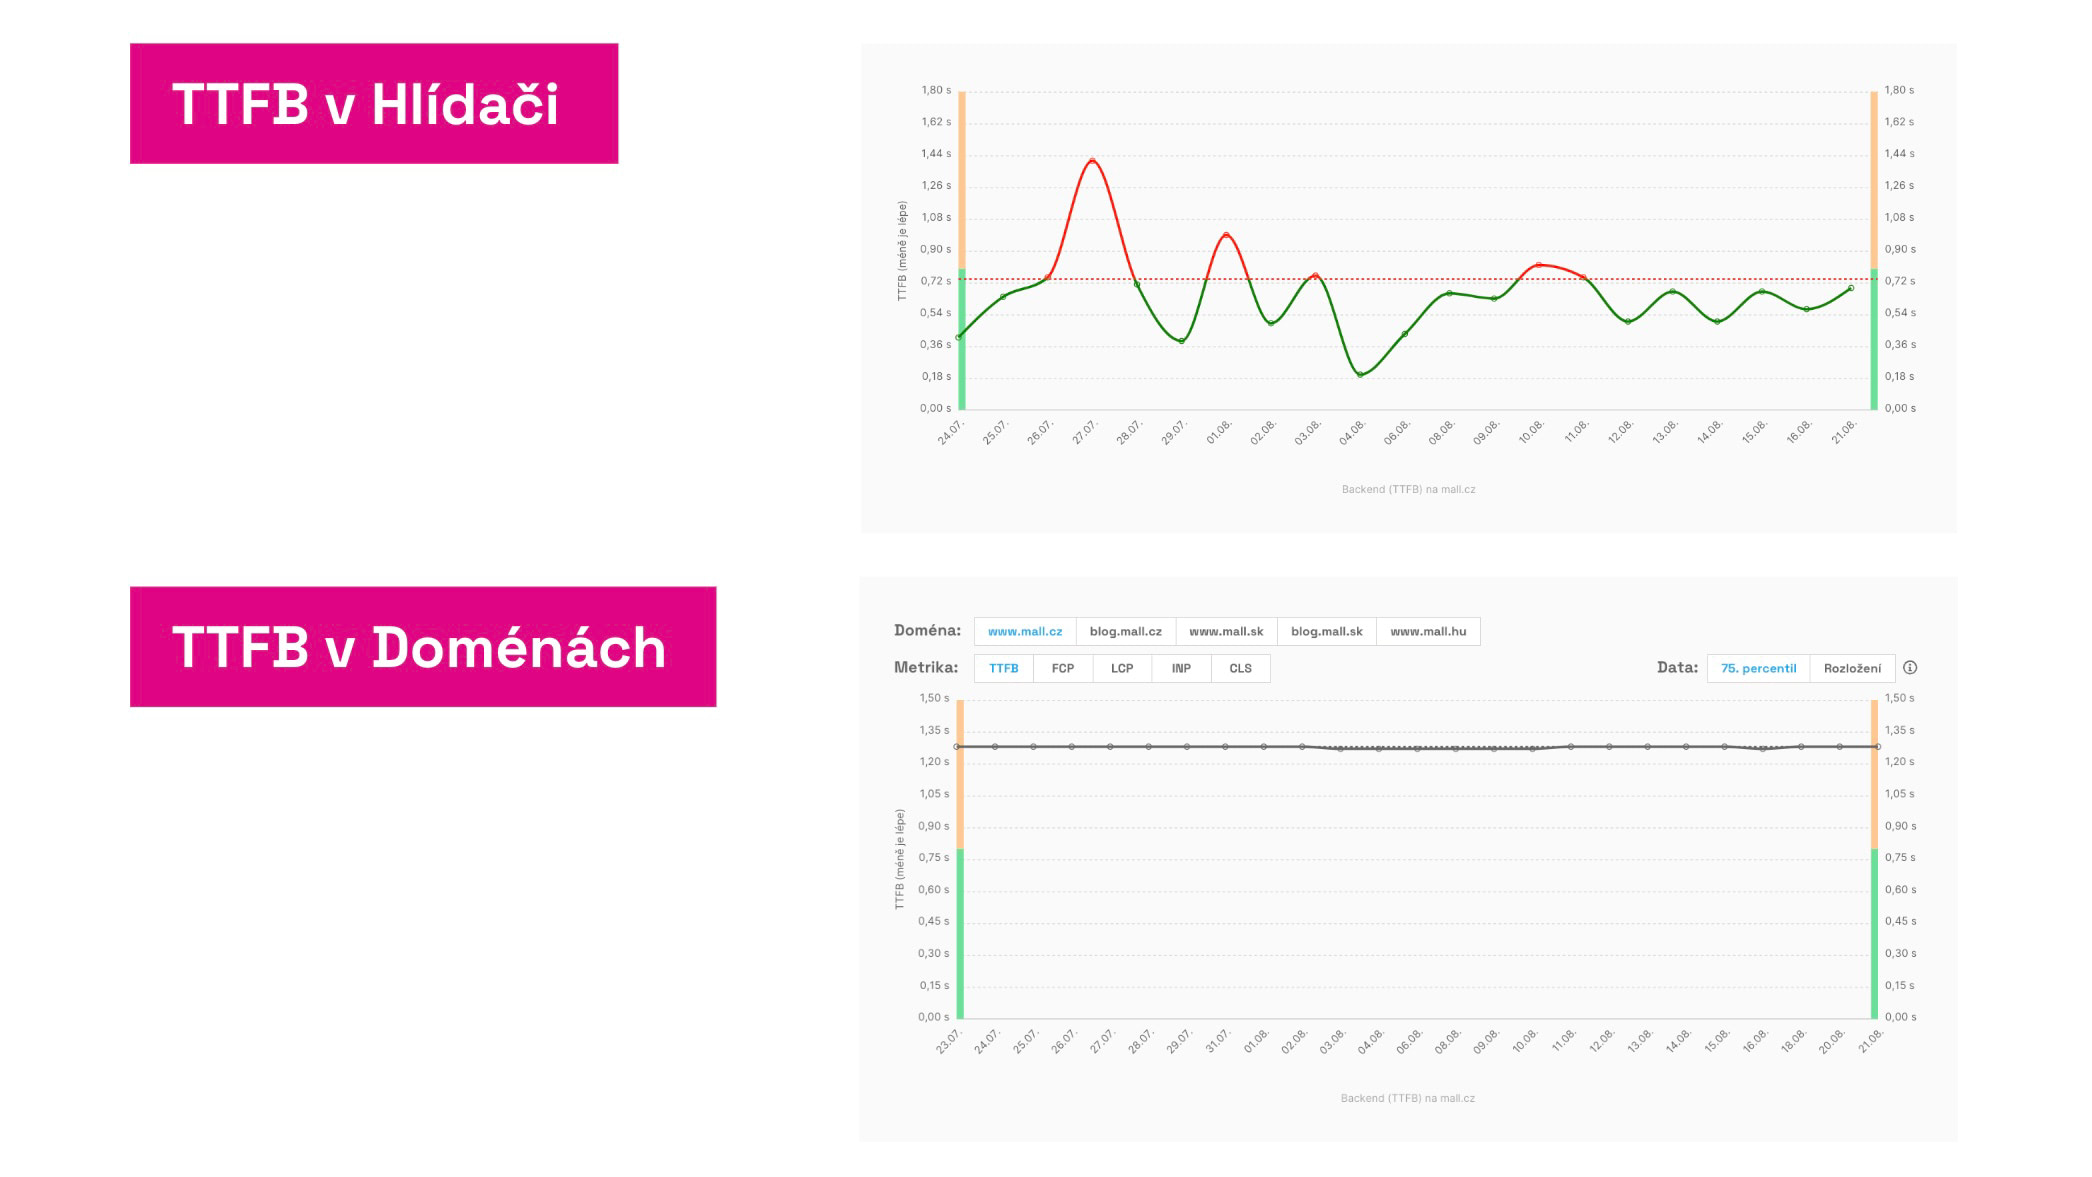 Metrics in the Watchdog may sometimes have wild developments, but you won't see this on CrUX data. In such a case, there's no need to panic and look for problems. The long-term trend is what matters. See also Domain Report.
Is It a Cyclical Problem?
Another common pattern in data is seasonality, hence the cyclical repetition of certain problems. How to spot such an issue?
In the Watchdog report, look at the long-term trend (at least three months). Some metrics (like TBT) tend to cyclically worsen and improve.
Seasonal traffic may also play a role in your case, often manifesting, for example, in server response time, TTFB.
How to Evaluate Individual Metrics?
In the following section of the text, you'll see specific guides for proceeding with specific metrics. They might seem similar but are not entirely so. Pay attention to each individual metric.
Backend (TTFB)
Time To First Byte (TTFB) shows server response time, but the metric also considers your entire server infrastructure and user connection speed.
It is a very important metric, and its deterioration will have a direct impact on Core Web Vitals metrics, especially on loading speed (LCP). Due to the crawl budget, i.e., Googlebot's ability to crawl your site, the TTFB metric also affects SEO.
How to evaluate reports on changes in server response time (TTFB)?
- Does it also affect user metrics?
Compare the metric's development in the Watchdog with the value of the TTFB metric for users (Domains Report > Metric distribution development). See the section How user metrics develop? above. - Were there any deployments on the website on the days the metric changed?
Notes in charts can help you mark important deployments on the website. - Which specific type pages are influencing this change?
Look into the Pages Report, where you can see the TTFB metric development for individual type pages of your site. On synthetic and CrUX data, you'll see whether the problem affects the entire site or just specific parts. - Could your server infrastructure be temporarily under greater load?
During campaigns or peak seasons, temporary deterioration in server response may occur. It's crucial that the optimal boundary of 0.8 seconds in user data isn't exceeded long-term. - Do you see continuous TTFB deterioration?
Monitor memory and CPU consumption graphs from your hosting provider. From our experience, hardware upgrades are often underestimated and can be the solution. - Is it possible to see the change in the test run detail?
Clicking on the graph with synthetic measurement results will take you to the test run detail with the Lighthouse tool report. Compare results with the test run detail from the previous day. The Lighthouse report can also help identify specific problem causes and optimization opportunities for this metric. Developers should be able to measure Web Vitals directly in the browser, where they can also open outputs from the test run detail.
Focus on optimizing the TTFB metric continuously, not just reactively when a problem arises.
Read our detailed article on how backend developers can help with speed.
First Contentful Paint (FCP)
The First Contentful Paint (FCP) metric shows the time needed to render the first content on your site.
It is an important auxiliary metric whose changes often affect the loading speed (LCP) metric and various user metrics such as bounce rate.
How to evaluate reports on changes in FCP time?
- Does it also affect user metrics?
Compare the metric's development in the Watchdog with the value of the FCP metric for users (Domains Report > Metric distribution development). See the section How user metrics develop? above. - Were there any deployments on the website on the days the metric changed?
Notes in charts can help you mark important deployments on the website. - Which specific type pages are influencing this change?
Look into the Pages Report, where you can see the FCP metric development for individual type pages of your site. On synthetic and CrUX data, you'll see whether the problem affects the entire site or just specific parts. - Is the core problem measurable by another metric?
Did server response time, i.e., TTFB metric, change in the reports? Backend speed can directly affect FCP and LCP metrics, so the culprit is often found here. - Is the problem in critical resources and can it be found in technical indicators?
Did FCP change, but TTFB didn't? The difference between these two metrics lies in the critical resources needed for the first page rendering. Look for changes in the Technical Report and indicators like HTML data volume, CSS data volume, blocking JS count… It is possible that a change occurred here, causing the FCP deterioration. - Is it possible to see the change in the test run detail?
Clicking on the graph with synthetic measurement results will take you to the test run detail with the Lighthouse tool report. Compare results with the test run detail from the previous day. The Lighthouse report can also help identify specific problem causes and optimization opportunities for this metric. Developers should be able to measure Web Vitals directly in the browser, where they can also open outputs from the test run detail.
Focus on optimizing the FCP metric continuously, not just reactively when a problem arises.
Largest Contentful Paint (LCP)
The Largest Contentful Paint (LCP) metric shows the time needed to render the main content on a specific page of your site.
It is one of the three most important metrics, part of Core Web Vitals, and a significant indicator that often correlates with conversion rates on e-commerce sites.
How to evaluate reports on changes in LCP time?
- Does it also affect user metrics?
Compare the metric's development in the Watchdog with the value of the LCP metric for users (Domains Report > Metric distribution development). See the section How user metrics develop? above. - Were there any deployments on the website on the days the metric changed?
Notes in charts can help you mark important deployments on the website. - Which specific type pages are influencing this change?
Look into the Pages Report, where you can see the LCP metric development for individual type pages of your site. On synthetic and CrUX data, you'll see whether the problem affects the entire site or just specific parts. - Is the core problem measurable by another metric?
Did server response time, i.e., TTFB metric, change in the reports? Backend speed can directly affect FCP and LCP metrics, so the culprit is often found here.
You might also find the problem in changes to the FCP metric, as discussed above. If TTFB didn't change, but FCP and LCP did, it indicates the issue lies with FCP. The culprit might be an increase in the data volume of critical resources. - Is the problem in resources for LCP elements and can it be found in technical indicators?
If you don't see changes in TTFB or FCP metrics, the problem may lie in the difference between FCP and LCP, which involves downloading and rendering the largest page elements. These are often asynchronous – images, JavaScript components, web fonts, and more. Look for changes in the Technical Report and indicators like JS data volume, font data volume, or image data volume. - Is it possible to see the change in the test run detail?
Clicking on the graph with synthetic measurement results will take you to the test run detail with the Lighthouse tool report. Compare results with the test run detail from the previous day. The Lighthouse report can also help identify specific problem causes and optimization opportunities for this metric. Developers should be able to measure Web Vitals directly in the browser, where they can also open outputs from the test run detail.
Focus on optimizing the LCP metric continuously, not just reactively when a problem arises.
Total Blocking Time (TBT)
The Total Blocking Time (TBT) metric shows the total time JavaScript blocks the browser, potentially slowing down responses to user interactions and worsening the INP metric.
The interaction response metric (INP), a crucial part of Core Web Vitals, can only be measured for users (CrUX data), so the Watchdog cannot report its changes.
TBT is synthetically measurable and can indicate potential INP deterioration, but there's no direct correlation. TBT deterioration might worsen INP, but INP can worsen without TBT changing. We recommend monitoring both Watchdog reports (TBT) and user data trends (INP).
It's also worth noting that TBT is the most "volatile" of all metrics. In graphs, the numbers will "jump" from lower to higher values. The Watchdog intelligently reports only significant changes, and we recommend you do the same. Simply take the TBT metric with a grain of salt compared to the others.
How to evaluate reports on changes in TBT time?
- Does it also affect user metrics?
Compare the metric's development in the Watchdog with the value of the INP metric for users (Domains Report > Metric distribution development). See the section How user metrics develop? above. - Were there any deployments on the website on the days the metric changed?
Notes in charts can help you mark important deployments on the website. - Which specific type pages are influencing this change?
Look into the Pages Report, where you can see the TBT metric development for individual type pages of your site. On synthetic data, you'll see whether the problem affects the entire site or just specific parts. Similarly, we can analyze the INP metric development in the same report. - What impact do third-party components have?
In the "Pages" report, also look at the development of the 3PBT metric, showing the portion of TBT our automation attributed to third-party components. If the blocking time of third-party components exceeds half, pay close attention. In the Test Run Detail Report, you'll find which specific third parties are problematic. - Is it possible to see the change in the test run detail?
Clicking on the graph with synthetic measurement results will take you to the test run detail with the Lighthouse tool report. Compare results with the test run detail from the previous day. The Lighthouse report can also help identify specific problem causes and optimization opportunities for this metric. Developers should be able to measure Web Vitals directly in the browser, where they can also open outputs from the test run detail.
Generally speaking – if the INP metric is fine, but TBT or 3PBT metrics have significantly worsened, these changes may not be critical.
Even so, it's good to regularly focus on optimizing the INP metric, both continuously and not just reactively when a problem arises.
Cumulative Layout Shift (CLS)
The Cumulative Layout Shift (CLS) metric shows the extent of unwanted layout shifts users experience during page loading and subsequent use.
It's an important metric, one of the three Core Web Vitals, which Google uses to evaluate websites for SEO and PPC needs:
How to evaluate reports on changes in CLS time?
- Does it also affect user metrics?
Compare the metric's development in the Watchdog with the value of the CLS metric for users (Domains Report > Metric distribution development). See the section How user metrics develop? above. - Were there any deployments on the website on the days the metric changed?
Notes in charts can help you mark important deployments on the website. - What if CrUX and synth data for the CLS metric differ significantly?
It's essential to understand that CLS obtained by the Watchdog (i.e., synthetic measurement) can differ from CLS obtained from user data (CrUX). While synthetic measures only layout shifts visible during initial website loading, CrUX data shows "layout shifts" even during subsequent page use. If you see low CLS in synthetic data but high in CrUX, unwanted shifts won't be visible at first load but during subsequent page use. - Which specific type pages are influencing this change?
Look into the Pages Report, where you can see the CLS metric development for individual type pages of your site. On synthetic and CrUX data, you'll see whether the problem affects the entire site or just specific parts. - Is it possible to see the change in the test run detail?
Clicking on the graph with synthetic measurement results will take you to the test run detail with the Lighthouse tool report. Compare results with the test run detail from the previous day. The Lighthouse report can also help identify specific problem causes and optimization opportunities for this metric. Developers should be able to measure Web Vitals directly in the browser, where they can also open outputs from the test run detail.
Focus on optimizing the CLS metric continuously, not just reactively when a problem arises.
Summary
Evaluating Speed Watchdog reports, along with monitoring itself, is an important part of improving or maintaining good website speed.
It's crucial for the team to decide who will monitor and evaluate the reports and perform this task regularly. Technical skills and knowledge of metrics and the web are necessary for this.
If you haven't done so already, we recommend studying how the Watchdog works and how to properly set up notifications to email or Slack.
Speed Monitoring PLUS
Try our monitoring app free for a month.
5,400 CZK annually per website. Invoice only, no credit card needed.