“Pages” Report
The “Pages” report reveals the status and evolution of the speed of measured URLs.
It answers such questions as:
- How are we doing with the speed of the measured URLs right now, and what is the trend?
- Have the optimizations of specific URLs been successful?
- Which pages have the most significant impact on the speed changes of the entire domain?
The “Pages” report is one of the advanced tools. It caters to those who wish to delve deeper into web speed. Typically, this will be developers and other speed optimizers.
For website owners and other managers, it is more suitable to monitor the “Domains” report.
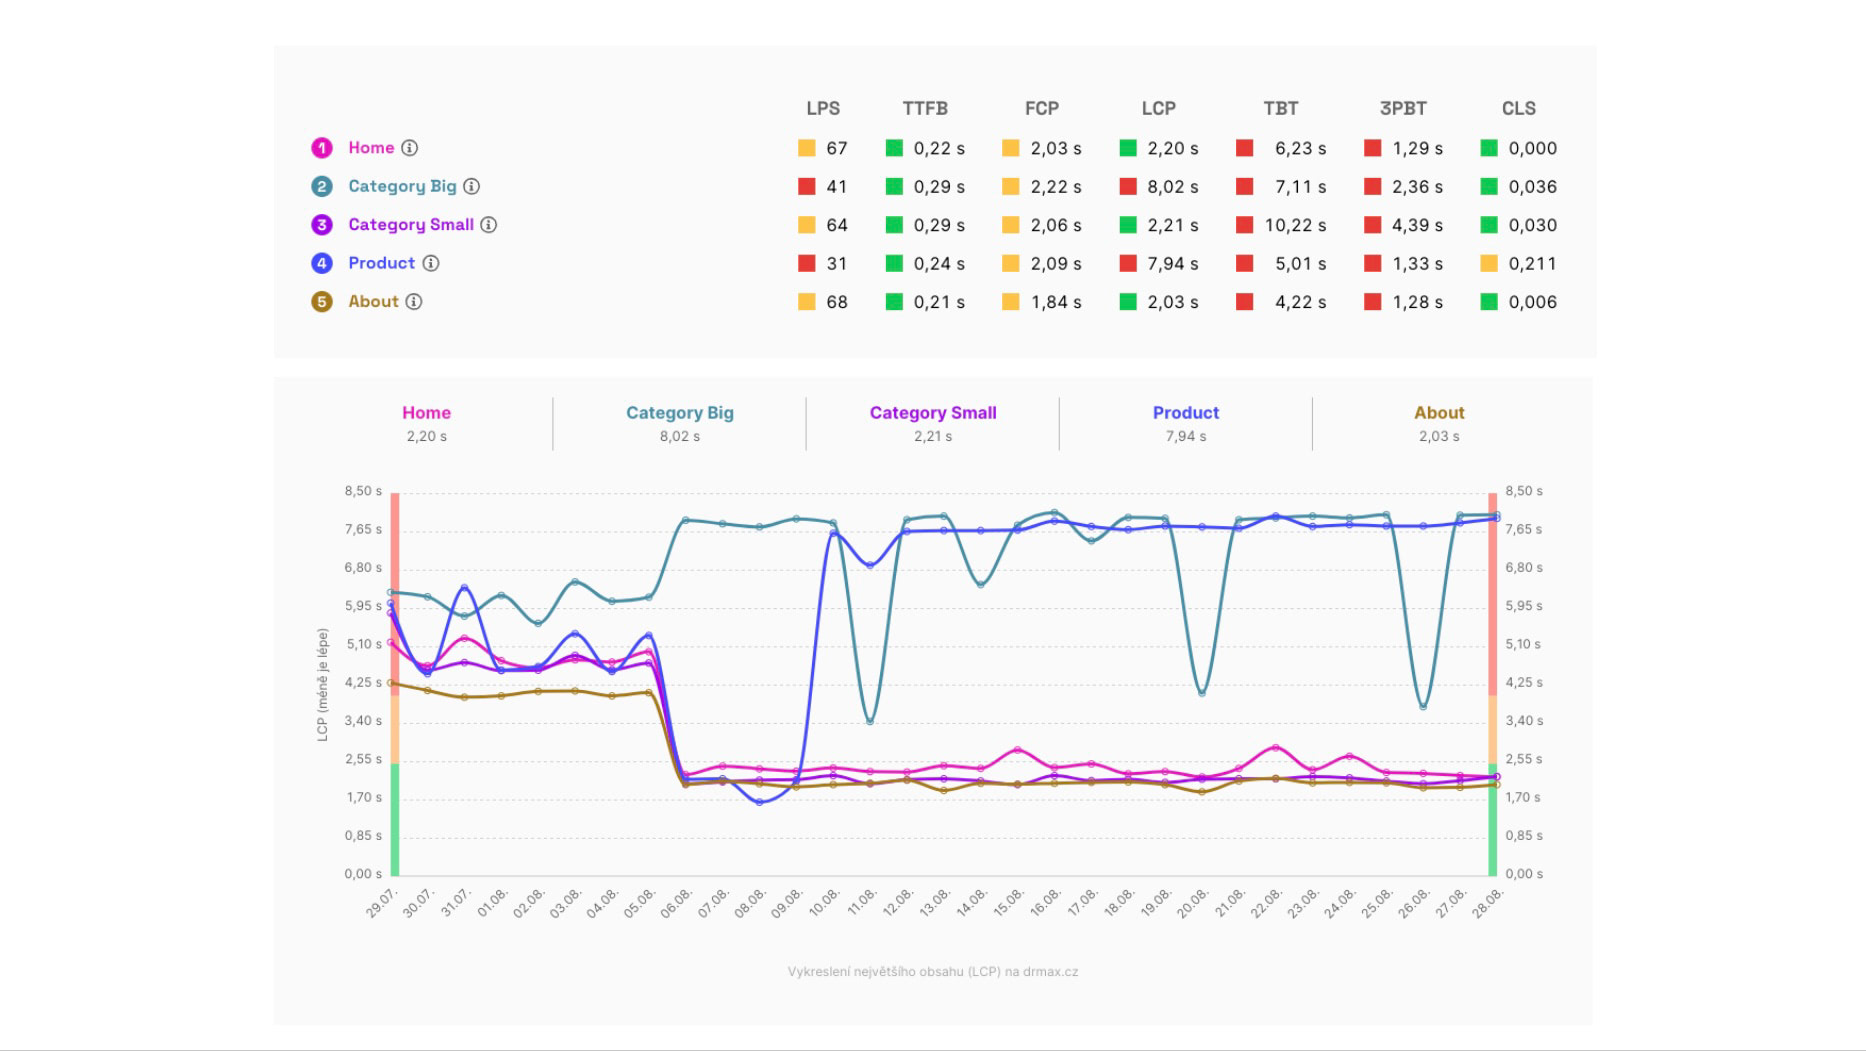 Synthetic metric status (above) and the evolution of the LPS metric for one of the measured websites.
Before you proceed, ensure you have the following in mind:
- It is necessary to understand the differences between various types of speed measurements. The “Pages” report works with synthetic measurement data and Google user data (CrUX).
- You should also know how we measure website speed in our monitoring.
- We highly recommend that you properly set up the monitored pages.
- It would be beneficial to know how the Domains report or Speed Watchdog operates.
Got it? Let’s continue.
Watchdog vs. Domains vs. Pages
Let's first clarify the relationship between these three major reports in our speed monitoring.
The Watchdog monitors the speed of URLs you have set up and alerts you in case of improvements or deteriorations. It uses synthetic data, providing very current figures, though they may not be entirely accurate.
The Domains report cannot report day-to-day changes since it uses data from the Chrome UX Report (CrUX). These data, however, are very accurate, so every Watchdog alert is worth verifying with these data. However, from Google's user data, we do not know which specific parts of the website are changing.
The Pages report again does not report changes but allows you to see which specific URLs caused changes after each Watchdog alert.
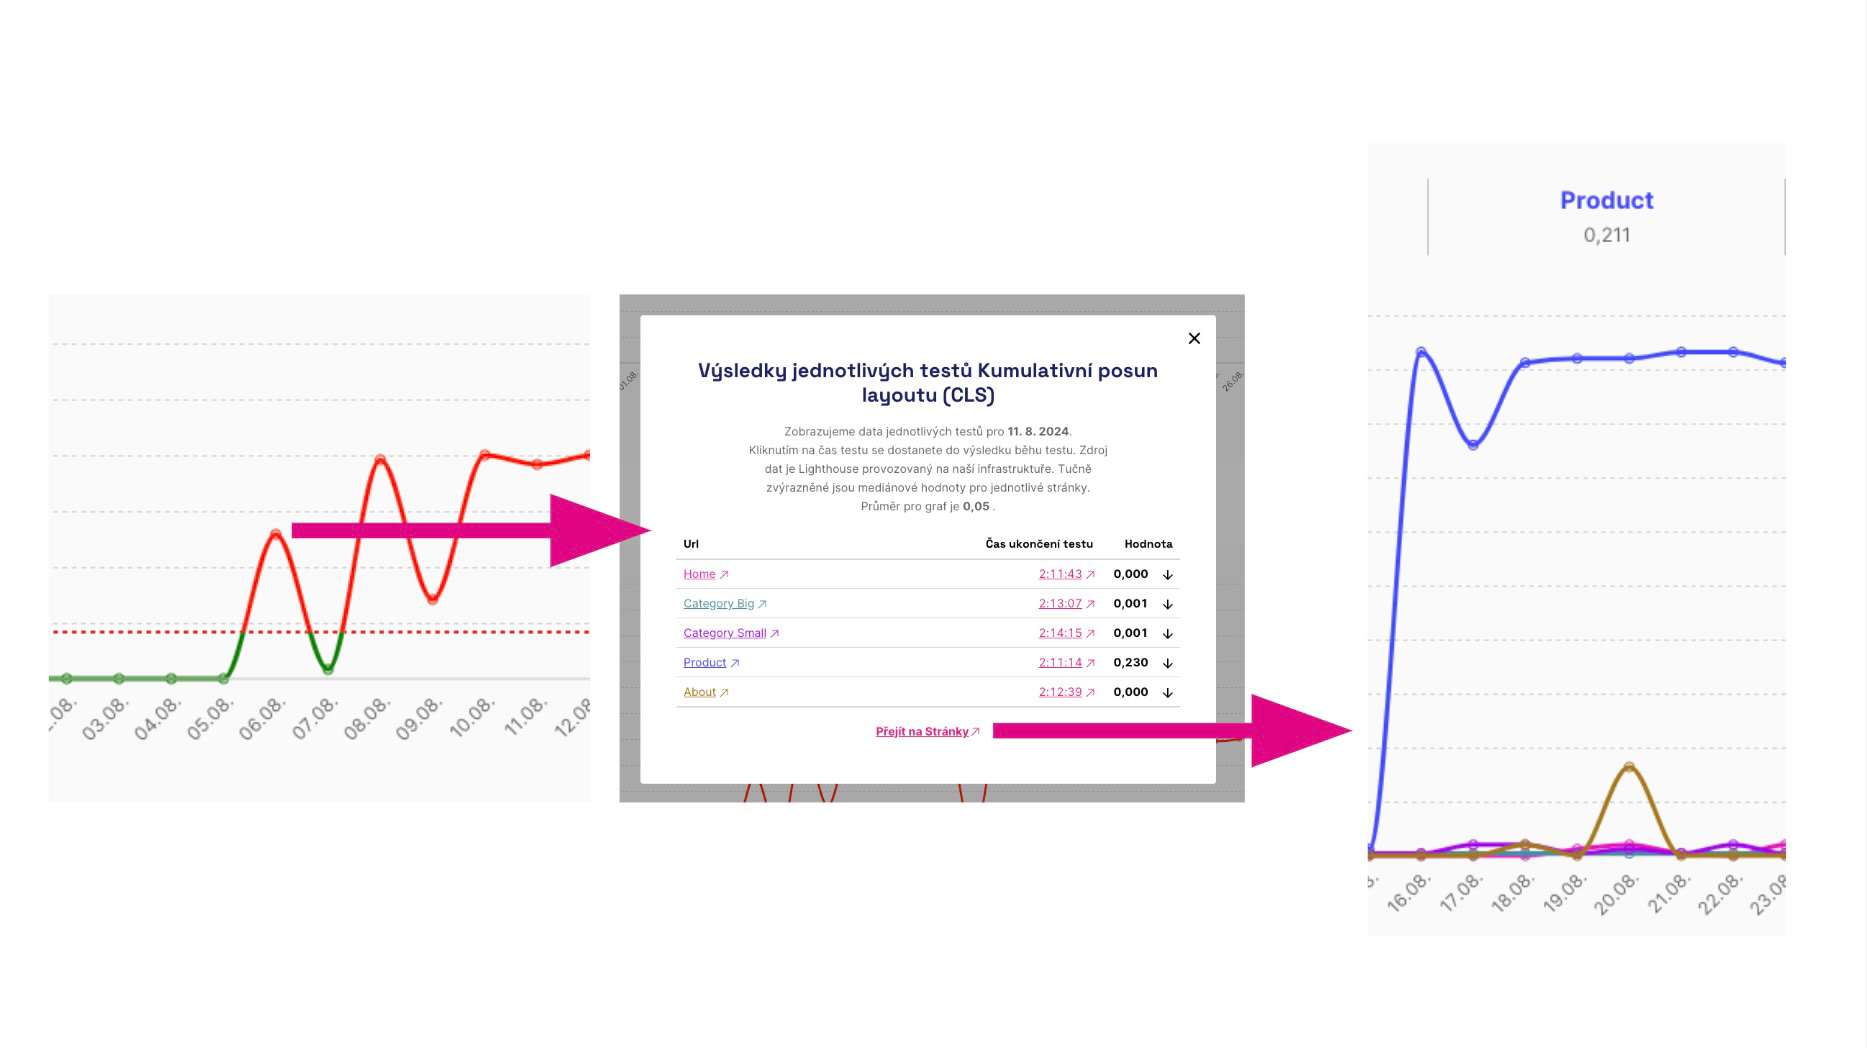 How to navigate to the problematic page that's slowing you down? Click on the graph in Watchdog, then follow the link to the Pages report in the modal window.
The Pages report displays the status and evolution of metrics for all measured URLs, both synthetic metrics and data from Google users (CrUX).
🔐 Google user data (CrUX) for pages is only available in the PLUS speed monitoring.
What if some URLs lack user data?
It is quite common that data for some URLs are unavailable or available only for a certain period.
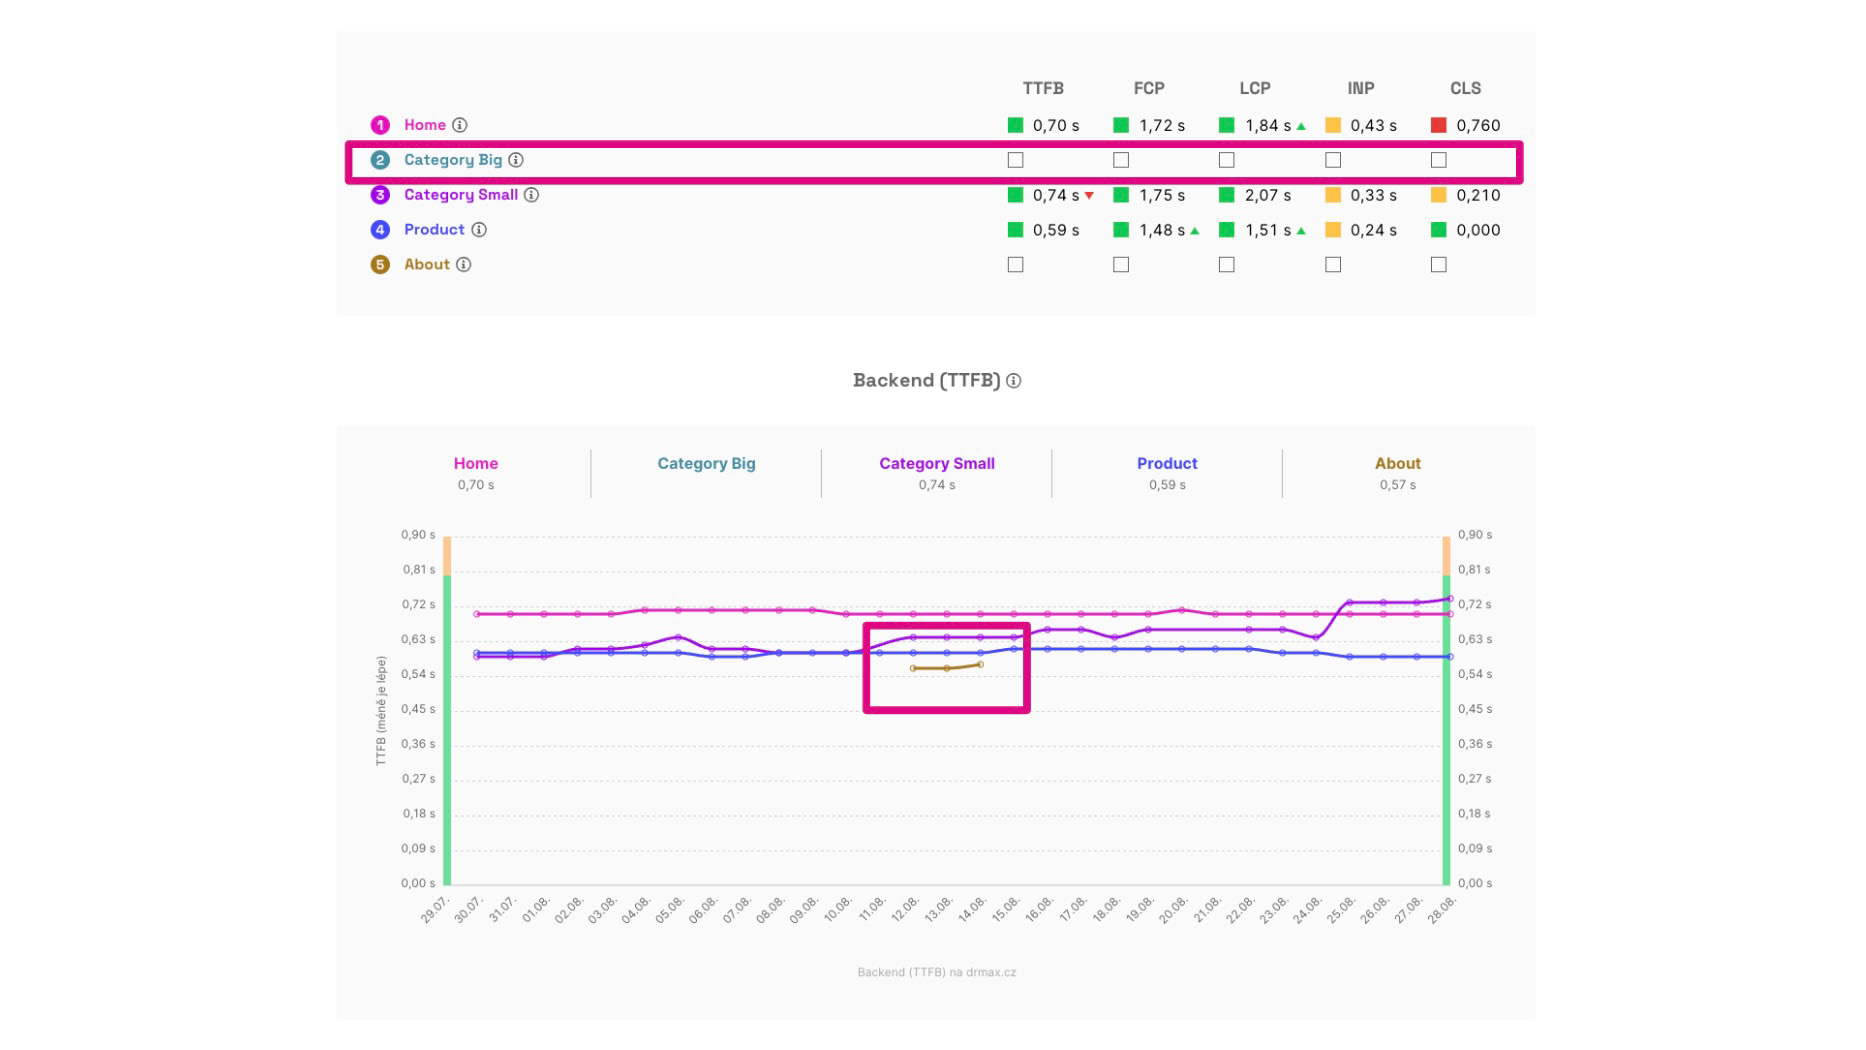 Above, it can be seen that some pages may not have CrUX data at all. Below, we see a situation where data are only available for certain specific days.
To display data from the Chrome UX Report, pages must meet a certain traffic level. It is common for smaller websites that CrUX data are available only for a few typical pages.
In the Monitoring Settings documentation, we provide tips on how to find better pages with Google user data.
However, it must be said that for many websites, you simply will not have these data. Therefore, we also display synthetic data here.
Individual Graphs and Their Significance
The “Pages” report is divided into two tabs: User Data and Synthetic. Above the tables and graphs, you can switch between Mobile and Desktop and select a time period (for user data: 1 month, 3 months, 1 year; for synthetic, additionally 7 days).
User Data displays metrics from the Chrome UX Report (CrUX) – measurements from real Chrome users. They are more accurate, but available only for pages with sufficient traffic and cumulatively for 28 days. Synthetic shows data from Lighthouse tests: more metrics and status for the current day, but without real users, they are not as accurate.
User Measurements for Pages
The data are from the Chrome UX Report and are only available for pages with a certain amount of traffic. They show very accurately the speed for all Chrome users, but are only available cumulatively for the last 28 days. Google does not provide data for all pages.
In the User Data tab, you will find:
- Summary – a table of current metric values for each measured URL, color-coded (satisfactory / needs improvement / unsatisfactory).
- 75th percentile – a line graph of the 75th percentile evolution over time for each metric (a simple distribution representation by one number).
- Distribution – bar graphs for each metric showing the percentage share of satisfactory / needs improvement / unsatisfactory states for all users; it provides a more detailed view than the 75th percentile.
Here you can see the status and evolution of these user metrics:
- PageSpeed.ONE Score (SPS) – overall speed score derived from CrUX.
- Backend (TTFB) – backend time, meaning server code and infrastructure.
- First Contentful Paint (FCP) – the first rendering of anything on the user's screen.
- Largest Contentful Paint (LCP) – the first largest content element.
- Interaction to Next Paint (INP) – response speed for interactions like clicking.
- Cumulative Layout Shift (CLS) – the sum of unwanted layout shifts on the page.
Synthetic Measurements for Pages
Metric status and development for URLs specified in the test. The data here come from Lighthouse tool tests (see how we test). They are available for the specific measurement day and each URL measurement, but may not be accurate as they do not come from users.
Here you can see the status and development of the following synthetic measurement metrics:
- Lighthouse Score (LPS) – overall speed score.
- Backend (TTFB) – backend time, meaning server code and infrastructure.
- First Contentful Paint (FCP) – the first rendering of anything on the user's screen.
- Largest Contentful Paint (LCP) – the first largest content element.
- Total Blocking Time (TBT) – the time during which the browser is blocked by executing frontend code.
- Total Blocking Time by Third Parties (3PBT) – the time during which the browser is blocked by executing third-party frontend code.
- Cumulative Layout Shift (CLS) – the sum of unwanted layout shifts on the page.
Notes on Metrics and Their Differences
You might have a few questions in mind when looking at the above metrics, so let's address the most common ones:
- Why do different types of measurements contain different metrics? Metrics in the user and synthetic sections differ because some can only be obtained from real users (INP) and others only synthetically (LPS, TBT).
- Why do different types of measurements return different values for the same metrics? Metric values obtained from users can vary. For instance, CLS is calculated synthetically only during the first screen load, but user-based throughout the session duration.
- There are many metrics; what should I focus on? Primarily focus on user values (i.e., CrUX) of the Core Web Vitals metrics (LCP, CLS, INP).
Summary
What should you remember about the “Pages” report?
- The report is for detailed monitoring of the development of metrics for measured URLs.
- It's crucial to choose your URLs wisely in the settings.
- The “Pages” report is intended more for developers and other technicians who wish to delve deeper into speed.
- Even if the metrics have the same names, they may show different values from different sources.
- Primarily look at Core Web Vitals from CrUX data.
Would you like to understand the measurements as a whole? Our article on How We Test and Test Run Detail in monitoring PLUS offers a complete guide.
Speed Monitoring PLUS
Try our monitoring app free for a month.
5,400 CZK annually per website. Invoice only, no credit card needed.