“Technical” Report
 Martin Michálek9/29/20255 minutes reading
The “Technical” report does not track user metrics but focuses on technical indicators such as data volume and request count.
We take all the URLs you input through the test settings, and each day we calculate the median from tests to present you with these figures.
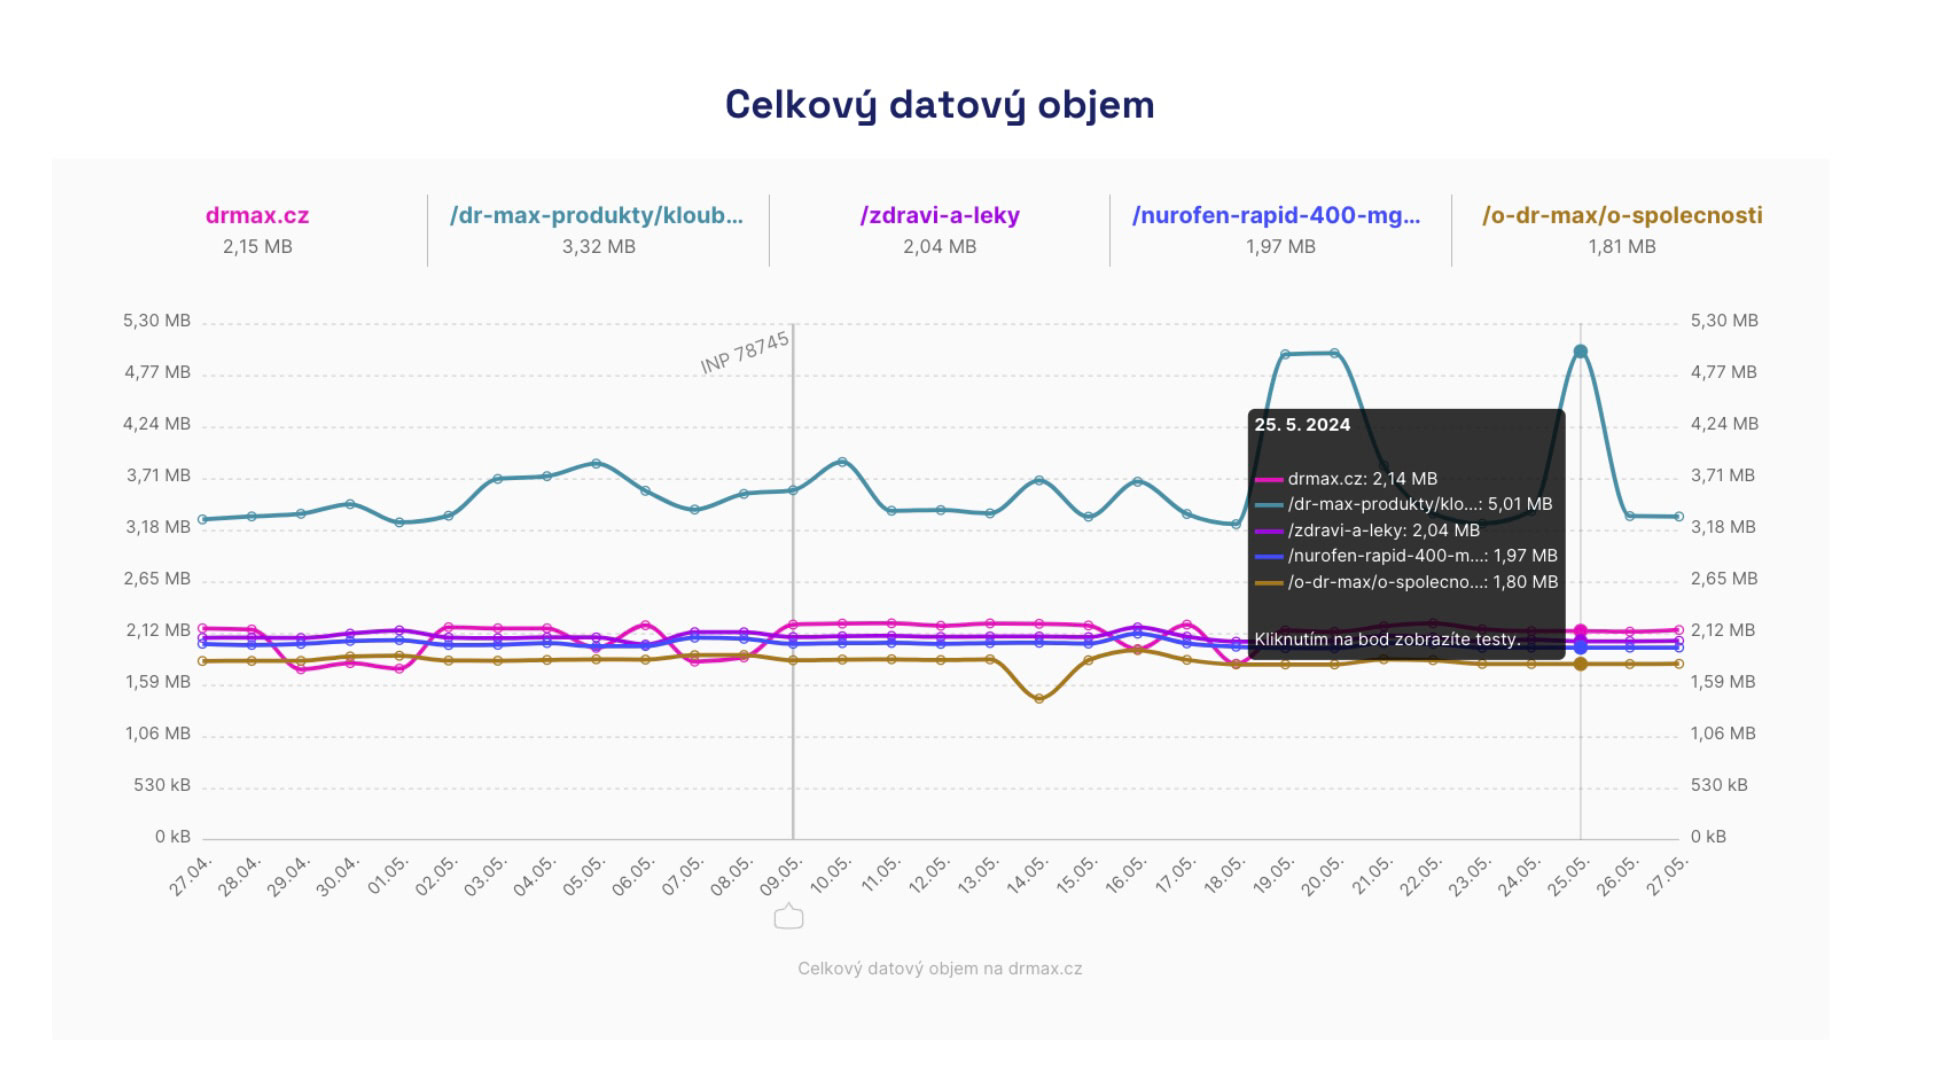 Occasional fluctuations are fine, but if they worsen and persist, it's time for reflection.
Technical indicators are not considered primary metrics, yet they assist in identifying the causes of issues with user metrics like Core Web Vitals, reported by the Watchdog or visible in Google's data (Chrome UX Report) on the Domains or Pages report.
🔐 The “Technical” report is a feature available only in the PLUS tests.
Why Measure Technical Indicators for Web Speed?
The modern field of web speed optimization no longer primarily tracks these technical indicators.
From our web speed consultancy experience, we know well that even websites downloading large amounts of data can remain fast for users through good first impression optimization.
Nevertheless, we include these secondary indicators in our “Technical” report. Data volume, request count, and other metrics are valuable for other reasons:
- Useful for finding correlations between changes in user metrics (e.g., LCP, CLS, INP) and changes during website development (e.g., image data volume or blocking JavaScript size).
- Saving data volume is considered a courtesy to users, who may have limited data resources on mobile.
- Generally, the less data transferred, the more the website operator saves on infrastructure.
In PLUS tests, you'll see the “Technical” report for all types of pages you set in the test settings.
As illustrated in the graph below, we display both the current state of the metric and its development over time, separately for mobile and desktop.
Based on our consultancy experiences, we've included the following information and reports in the “Technical” report:
HTML Data Volume
The graph shows the development of HTML data volume for individual pages. It reflects the state of HTML as it arrives in the test browser, even after compression Gzip or Brotli. The smaller the HTML data, the better.
We recommend keeping the size under 20 kB. It affects loading metrics like FCP or LCP.
Number of DOM Nodes
The development of the number of DOM nodes for individual pages over time. A complex DOM tree complicates JavaScript's work and can affect metrics such as TBT or INP.
We recommend a maximum of 1,500 DOM nodes per page, an ambitious goal, perhaps, but worth striving for.
CSS Data Volume
The development of CSS file data volume for individual pages over time. This is the state after potential Gzip or Brotli compression on your server. CSS usually blocks the first rendering, so its size affects metrics like FCP or LCP. Ideally, keep CSS data volume under 50 kB.
Number of Blocking JS
The development of the number of JS files that block the first rendering. Unlike CSS, JavaScript does not have to be blocking.
The fewer blocking JS you have, the better for metrics like FCP or LCP.
JS Data Volume
The development of JS file data volume for individual pages over time. This includes both blocking and non-blocking files. The graph shows the state after potential Gzip or Brotli compression on your server.
The smaller the JS, the less code there is for the browser to process and execute, impacting interaction metrics like TBT or INP. Blocking JS also affects FCP and LCP, thus the first rendering.
Third-Party JS Data Volume
The development of third-party JavaScript file data volume for individual pages over time. This category includes JS executed outside your main domain, so you might see your own files hosted outside the main domain here.
Typically, you'll find the data volume of external code for components like analytics tools, chats, A/B testing, ads, etc.
This code also impacts interaction metrics like TBT or INP. Keeping it as small as possible is crucial.
Font Data Volume
The development of font data volume for individual pages over time. Fonts are usually required for content rendering, affecting the LCP metric.
We recommend keeping their data volume under 50 kB.
Image Data Volume
The development of image data volume for individual pages over time. Images are often necessary for content rendering, thus affecting the LCP metric.
We recommend keeping their data volume under 100 kB per page.
Total Data Volume
The development of the total data volume of all downloaded files for individual pages over time. While total data volume may not directly impact metrics or user experience, we still recommend keeping it under 0.5 MB per page.
Monitoring technical indicators can greatly assist when you decide to focus on any of the metrics mentioned above and specific types of pages.
What to Do When You Notice Deterioration in a Technical Indicator?
Firstly, not all issues are necessarily problematic. Ensure you see the same period's impact on user metrics (see reports Watchdog, Pages, or Domains).
Sometimes, the deterioration might be beyond your control, e.g., with third-party components. Nonetheless, it pays off to pay attention to third parties.
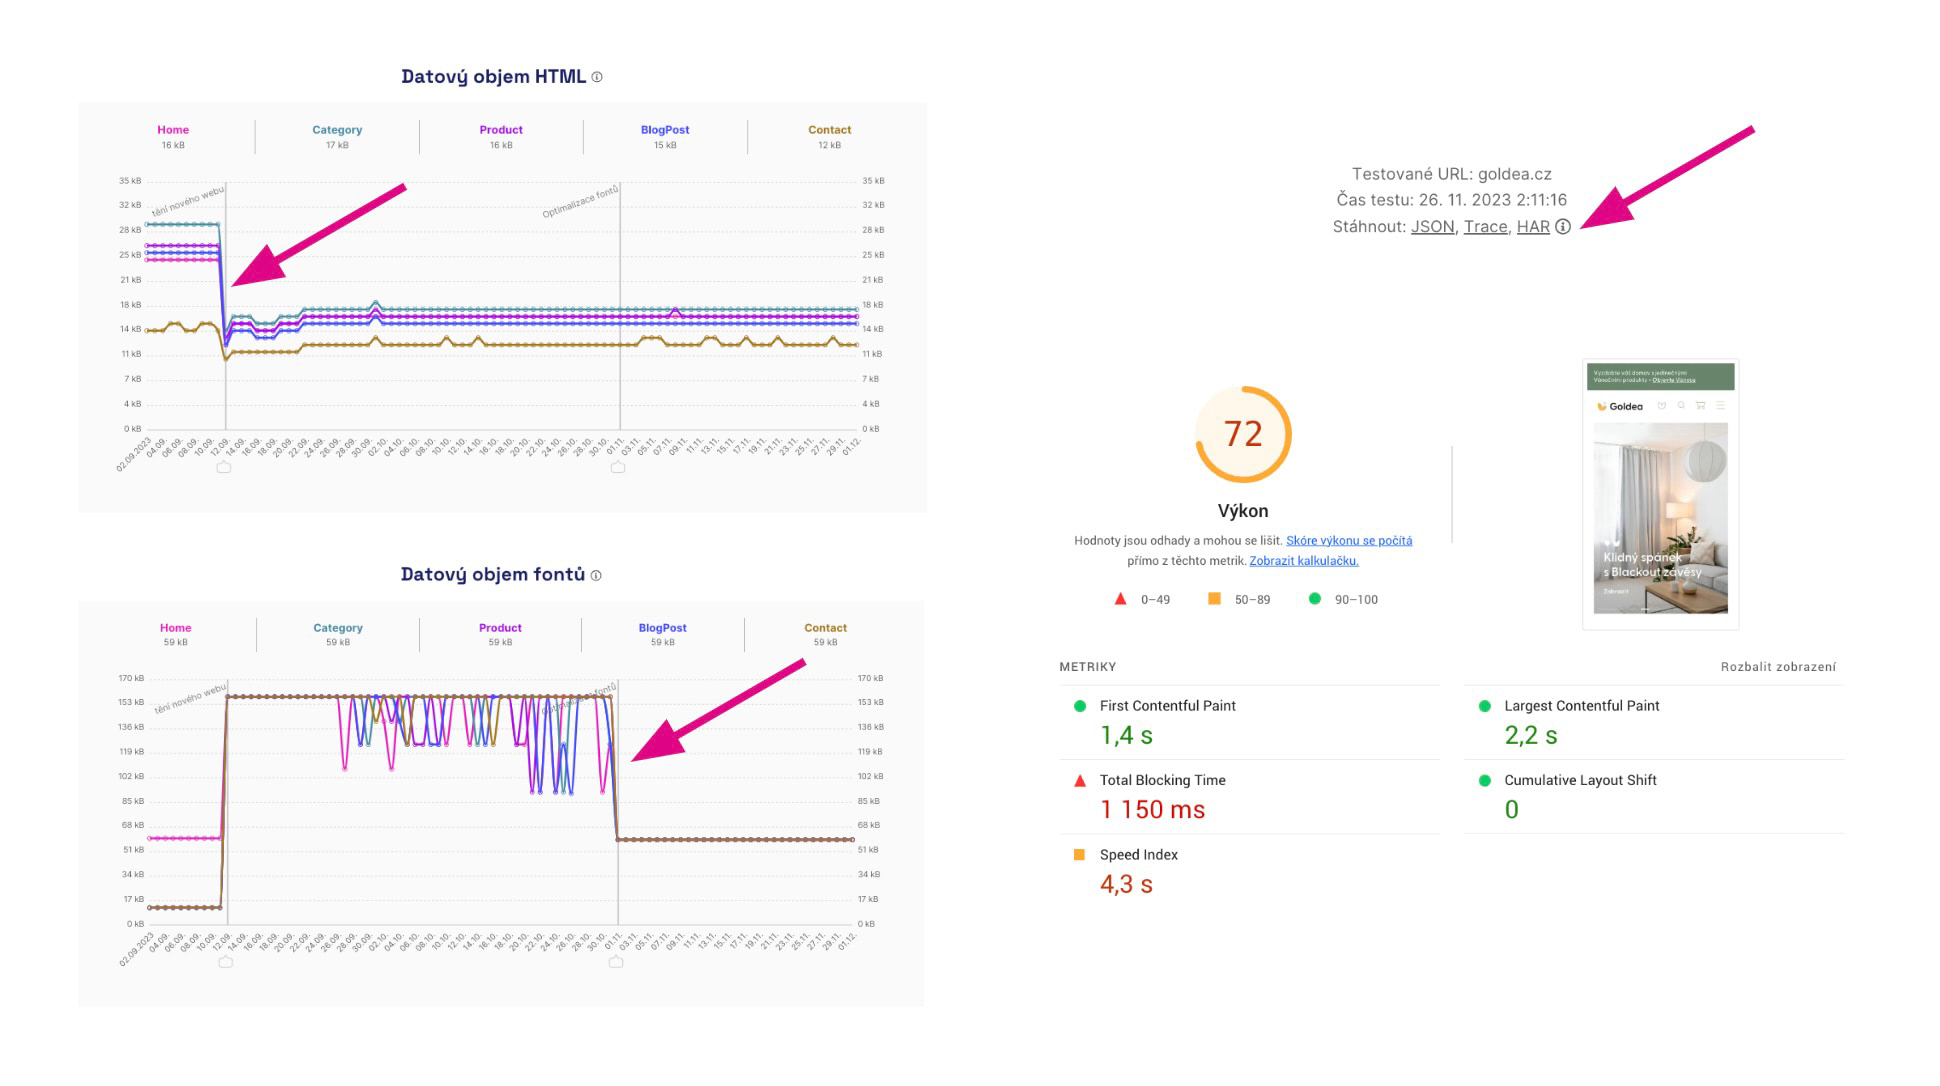 Improving technical indicators is always good news.
In the test run details of Lighthouse, you can also see a broader context.
Do you still see a problem on your side in the Technical report and simultaneously a deterioration affecting Core Web Vitals, such as a decline in the Watchdog or Domains reports?
- Identify the specific change in the graphs. Which type pages does it concern? Is it the same for mobile and desktop?
- Click on a specific value in the graph to access the Lighthouse test, which shows the exact measurement with additional context.
- Ask developers, marketers, and other team members what changed during the specific period.
Our article How We Test and Test Run Details with PageSpeed.ONE monitoring offer a complete guide.
Speed Monitoring PLUS
Try our monitoring app free for a month.
5,400 CZK annually per website. Invoice only, no credit card needed.