Interaction to Next Paint (INP) Metric: Tackling Slow Interactions
 Zuzana FatrdlaUpdated 7/28/20268 minutes reading
Developers and website owners, take note. If you haven't heard yet, Google is introducing a new metric called Interaction to Next Paint (INP). Set to replace the First Input Delay (FID) in the trio of essential Core Web Vitals metrics by March 2024, INP promises a stricter and more accurate reflection of user experience.
Interaction to Next Paint measures interactivity – the speed of response to user actions after the page has loaded and the user begins interacting with components like carousels, accordions, or adding items to a cart.
Optimizing this metric can take several months of work, so the best time to start is now.
What is the INP Metric?
INP answers the question: How quickly does it respond?
Interaction to Next Paint measures the overall responsiveness of a page to user interactions by tracking the delay of all events that occur throughout the visit.
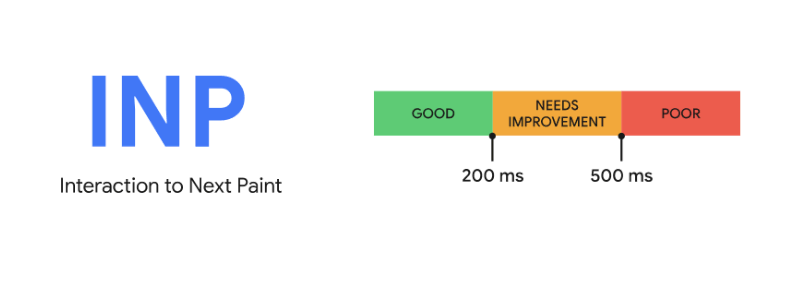
The recommended value to meet the metric is 200 ms. Between 200 and 500 ms, improvements are necessary, and above 500 ms, the metric is considered poor.
 INP Metric
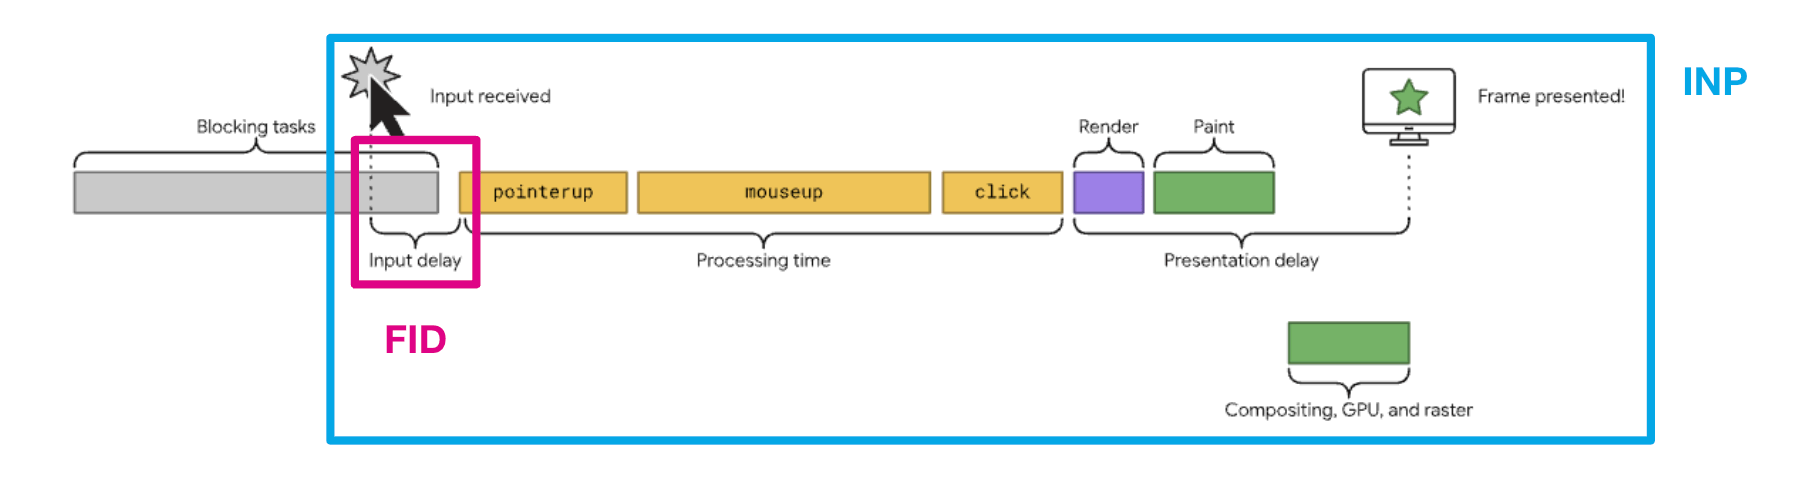
With this change, Google aims to address the shortcomings of FID. The innovation lies in the fact that INP measures all interactions (taps, clicks, keystrokes) on the web that you, as a user, perform while browsing.
It also measures a slightly longer period of browser activity – from interaction to the repainting of the page.
 INP vs FID
A direct comparison with its predecessor FID can help us understand INP:
| First Input Delay | Interaction to Next Paint |
|---|---|
| first interaction | all interactions on the page |
| time from interaction to processing | time from interaction to page repainting |
| limit 100 ms | limit 200 ms |
So, if you often find that interactions on your site are unresponsive or delayed, you'll likely have an issue with the INP metric.
The main cause of high INP values is typically JavaScript and ongoing Long Tasks (measurable by the JS Long Tasks (JSLT) metric), which prevent the browser from rendering a new screen state (“frame”). Another culprit might be slow data loading after an AJAX request. We'll discuss optimizing these issues further in the article.
Watch Zuzka's presentation on the INP metric from FrontKon 2023:
How is the INP Metric Calculated?
Now for some intriguing details about metric calculation. INP is measured based on all interactions performed on the page. The interaction with the worst measured result is then counted as the metric value. Interactions such as scrolling or hovering are not included, but responses to clicking or keyboard input are.
In the case of a large number of interactions, the calculation is adjusted: for every 50 interactions on a page, one highest value is ignored. Google aims to refine the metric and remove the influence of various random lags in web applications where frequent clicking occurs, like gaming interfaces.
Measuring INP
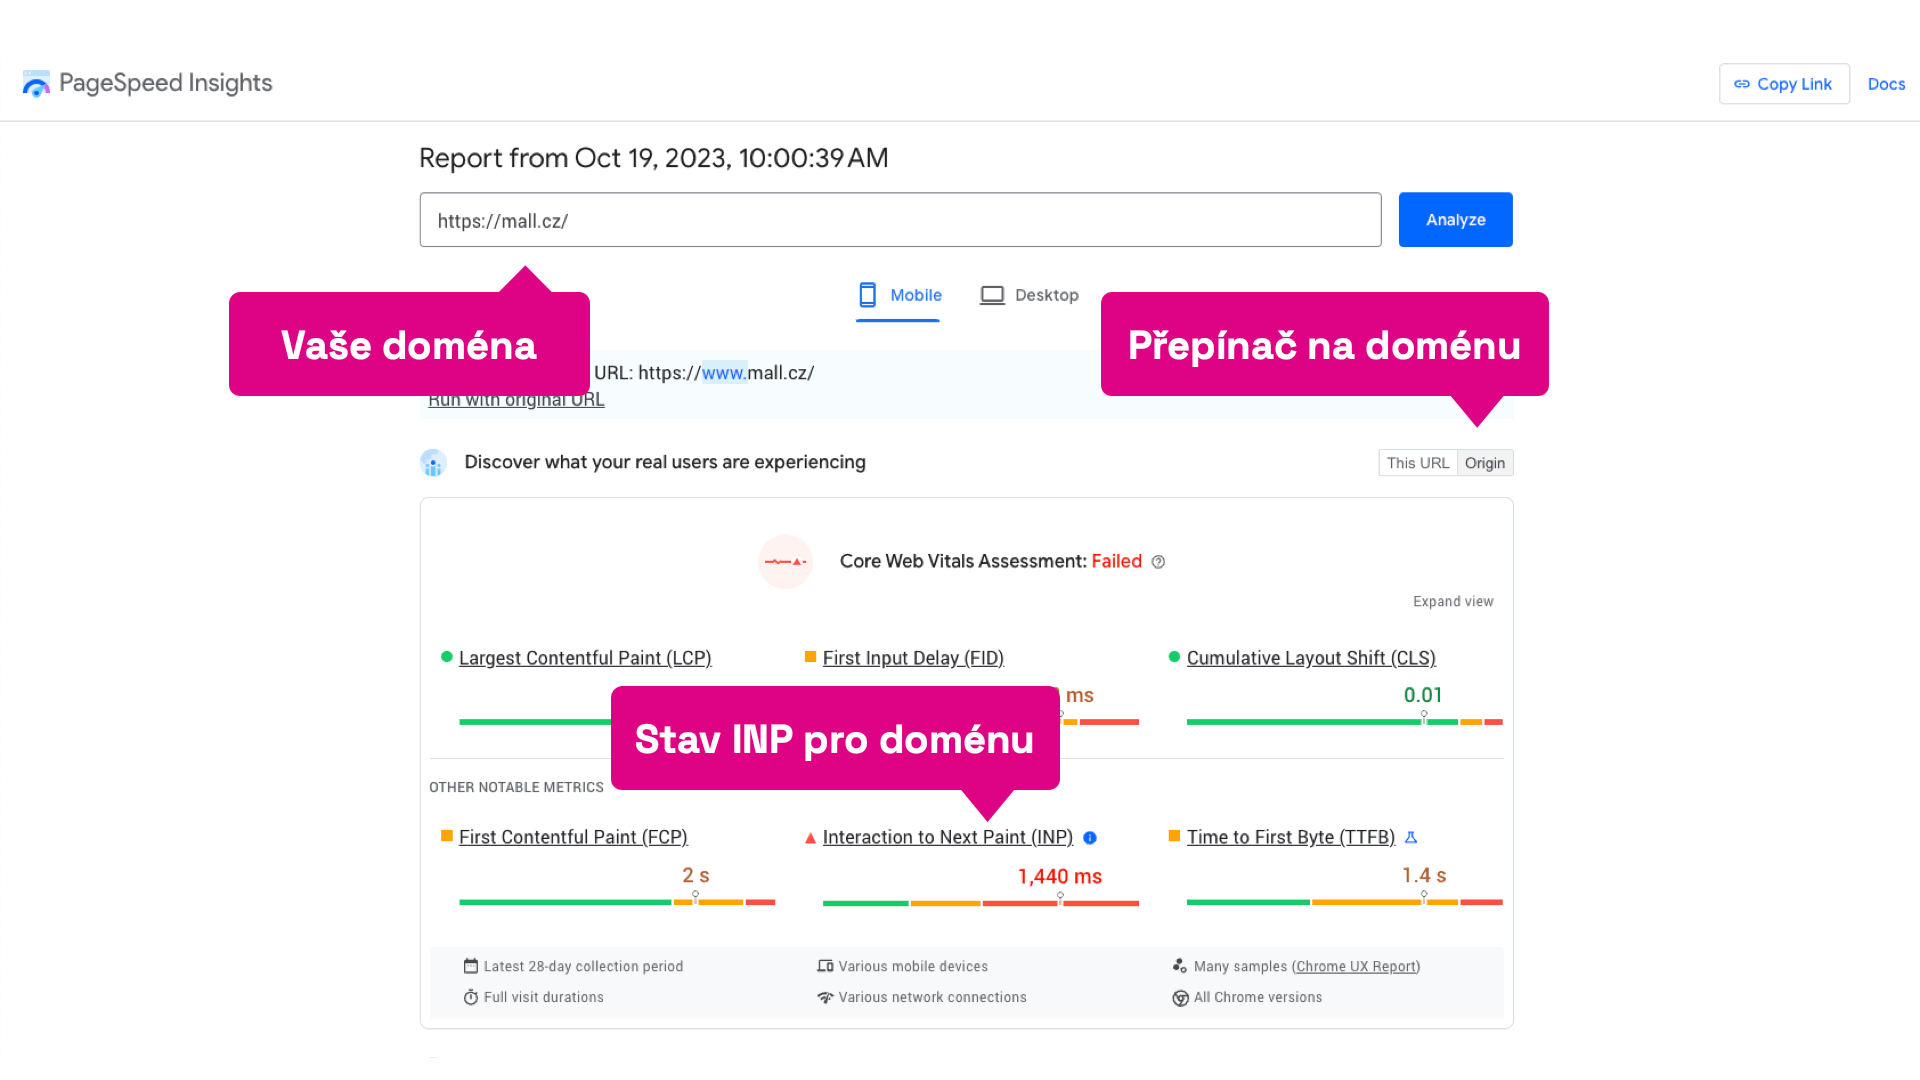
As explained above, the source of INP metric values is the Chrome UX Report (CrUX). It contains data for the entire domain and individual URLs. For a more convenient experience, use one of the available tools that can work with CrUX data and display it. These include our web speed test or Google's PageSpeed Insights. The distribution of INP values across a domain can be shown using a histogram.
PageSpeed Insights will display current Core Web Vitals metrics for both mobile and desktop. You can also view data for a specific URL and the entire domain. The second line in the middle is of most interest, as it represents the INP metric value.
 Measuring INP
Long-term development and regular changes on a website, however, require a different approach, which our web speed test provides. You can monitor metric values over the long term.
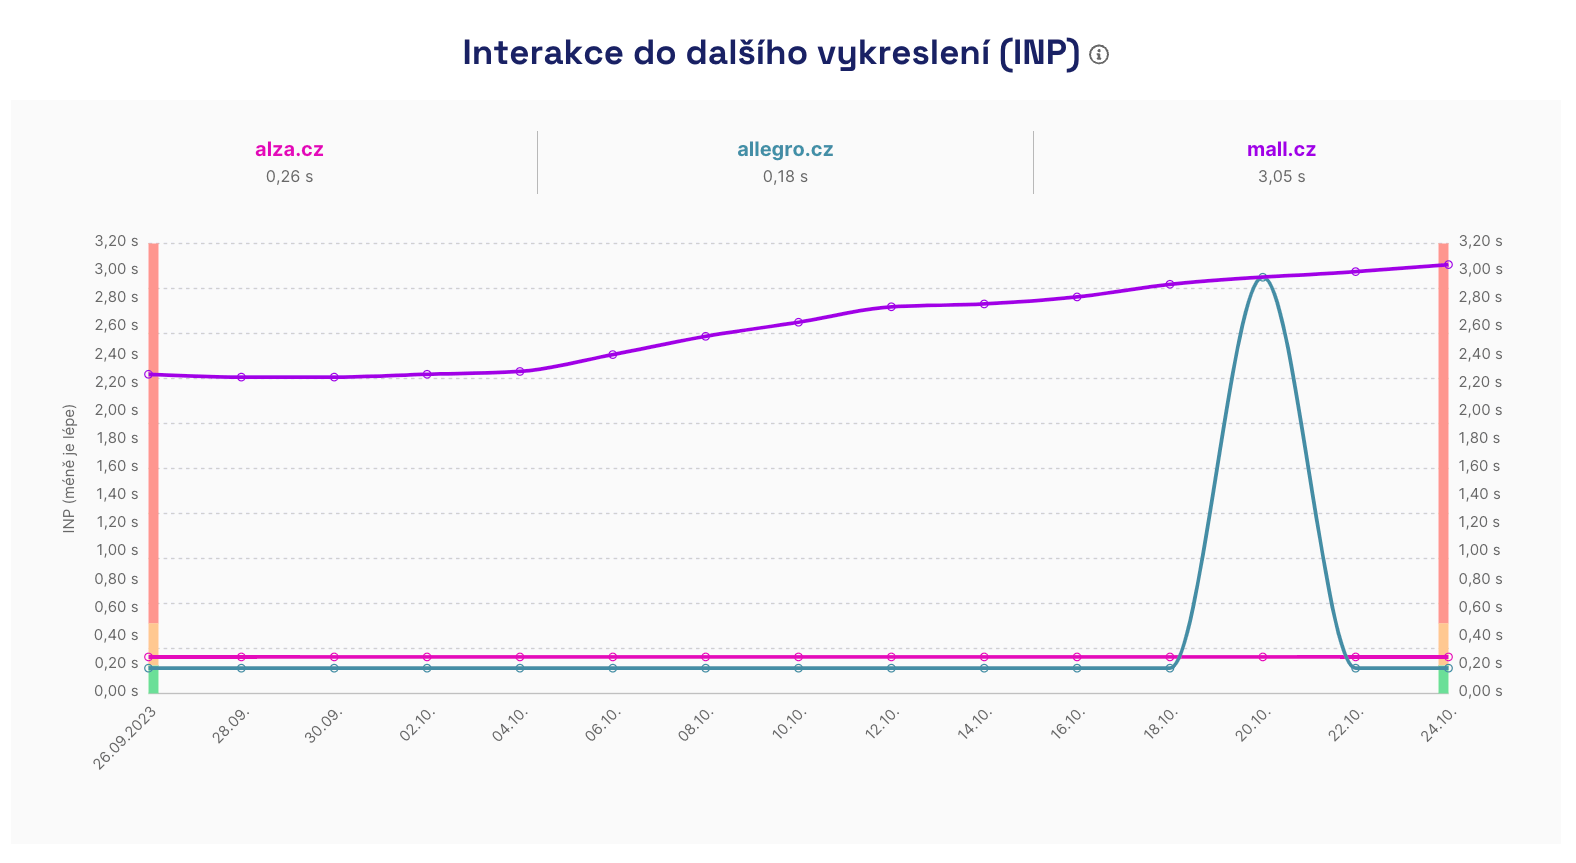 INP Metric in our tester
A very handy tool for tracking Core Web Vitals is also the Google Search Console, where you can find reported URLs with "spoiled" metrics. This makes it relatively easy to identify potentially problematic URLs.
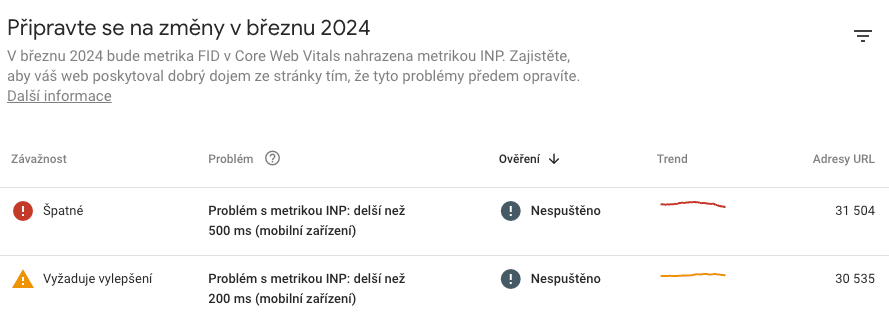 Google Search Console
If you find Chrome user limitation too restrictive, you can always use RUM (Real User Monitoring) measurements, or write your own data collection using JavaScript and the Performance Observer API.
Another option is synthetic measurements, which you can obtain using tools like PageSpeed.ONE, Google Lighthouse, WebPageTest, and similar. However, you will only get values for similar metrics (like JS Long Tasks), not INP itself, as this can only be obtained from users.
We write about the differences in measurements on a separate page: synth vs. CrUX vs. RUM.
I Have an INP Problem, What Now?
You've reviewed data from the CrUX report for users, checked Google Search Console, and see reported URL groups. Now is the time to find the problem. Move to testing tools, test in the browser (as we do), and identify specific problematic areas.
For a quick look at interactions, you can use the INP Debugger. It's not a perfect tool, but it can help locate "long" interactions.
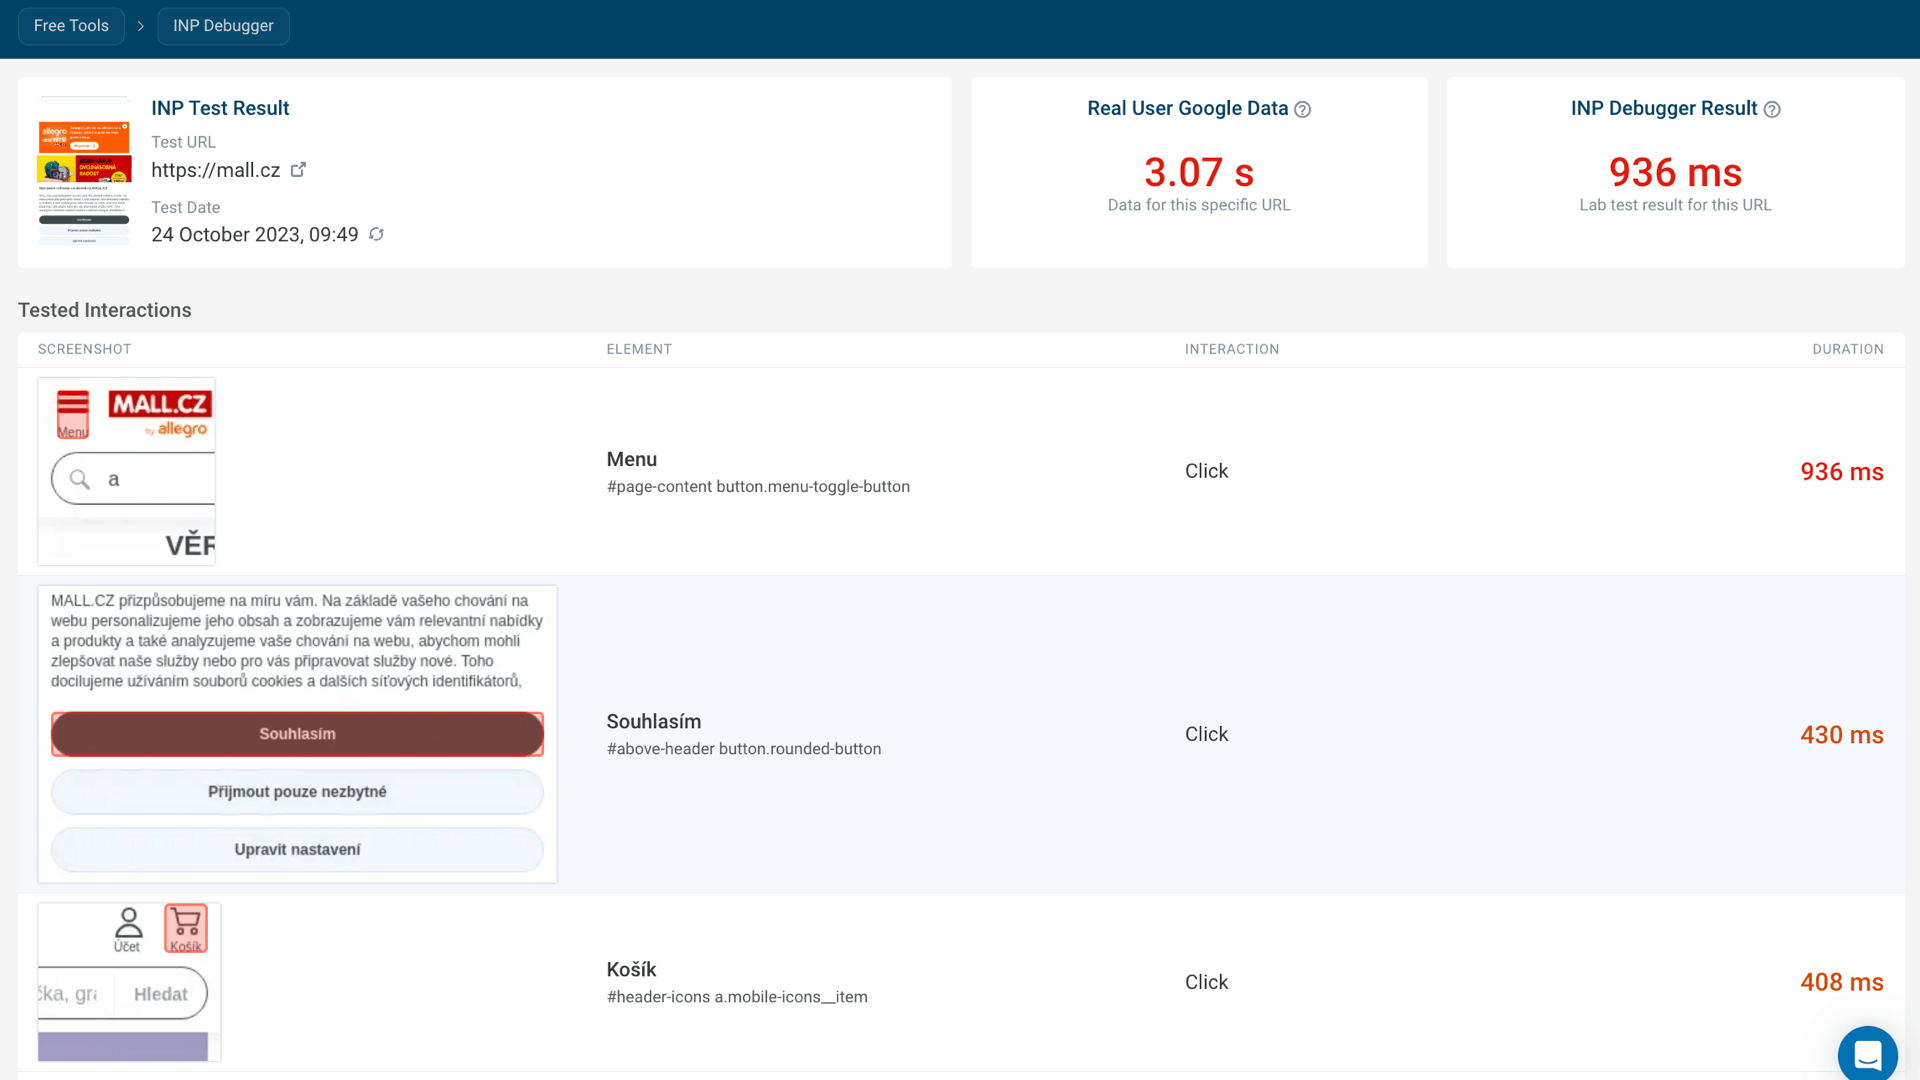 Debugbear Tool
The INP Debugger won't measure interactions nested in hidden elements, and we recommend running multiple tests to see how the page behaves. The result is a list of interactions sorted by the measured INP time.
A great aid in this work is the Chrome Core Web Vitals extension, which, among other things, can list all metrics in the console. Open DevTools, set CPU: 6x slowdown and Network: Fast 3G in the Performance tab to slow down the device's performance.
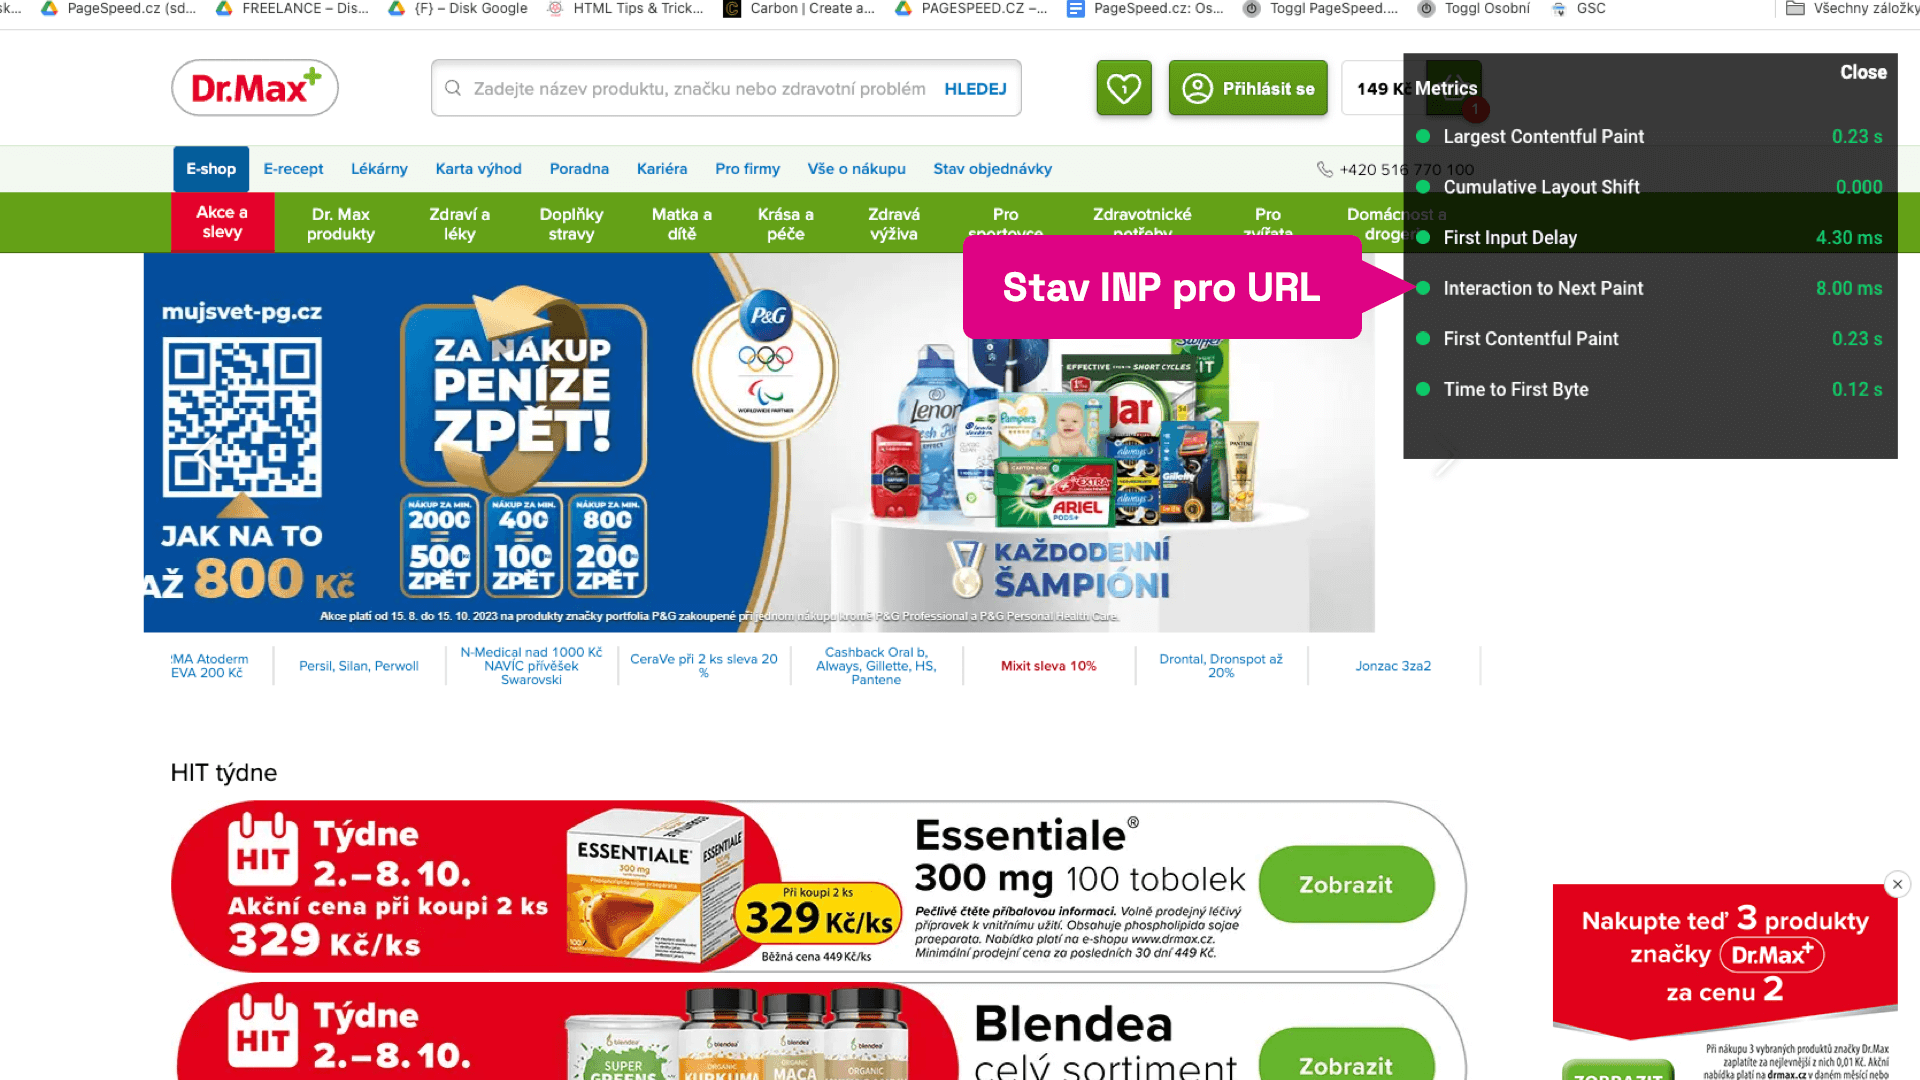 Chrome Core Web Vitals Extension
In the final step, go to the Console tab and activate the Core Web Vitals extension. Now you can start testing individual pages. Try to test all possible scenarios and interactive elements; the INP metric value will be displayed in the console.
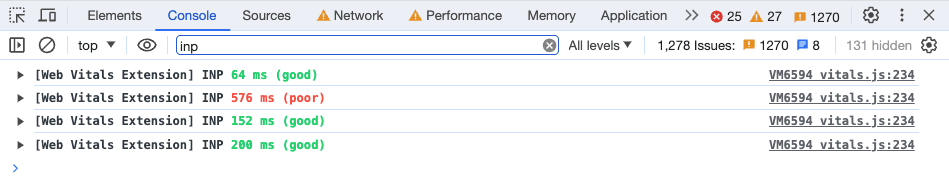 Chrome Core Web Vitals - Console Output
You can then analyze specific interactions in detail using Timeline recording in the Performance tab. If you record a specific interaction, you will see exactly when it occurred in the "Interactions" tab.
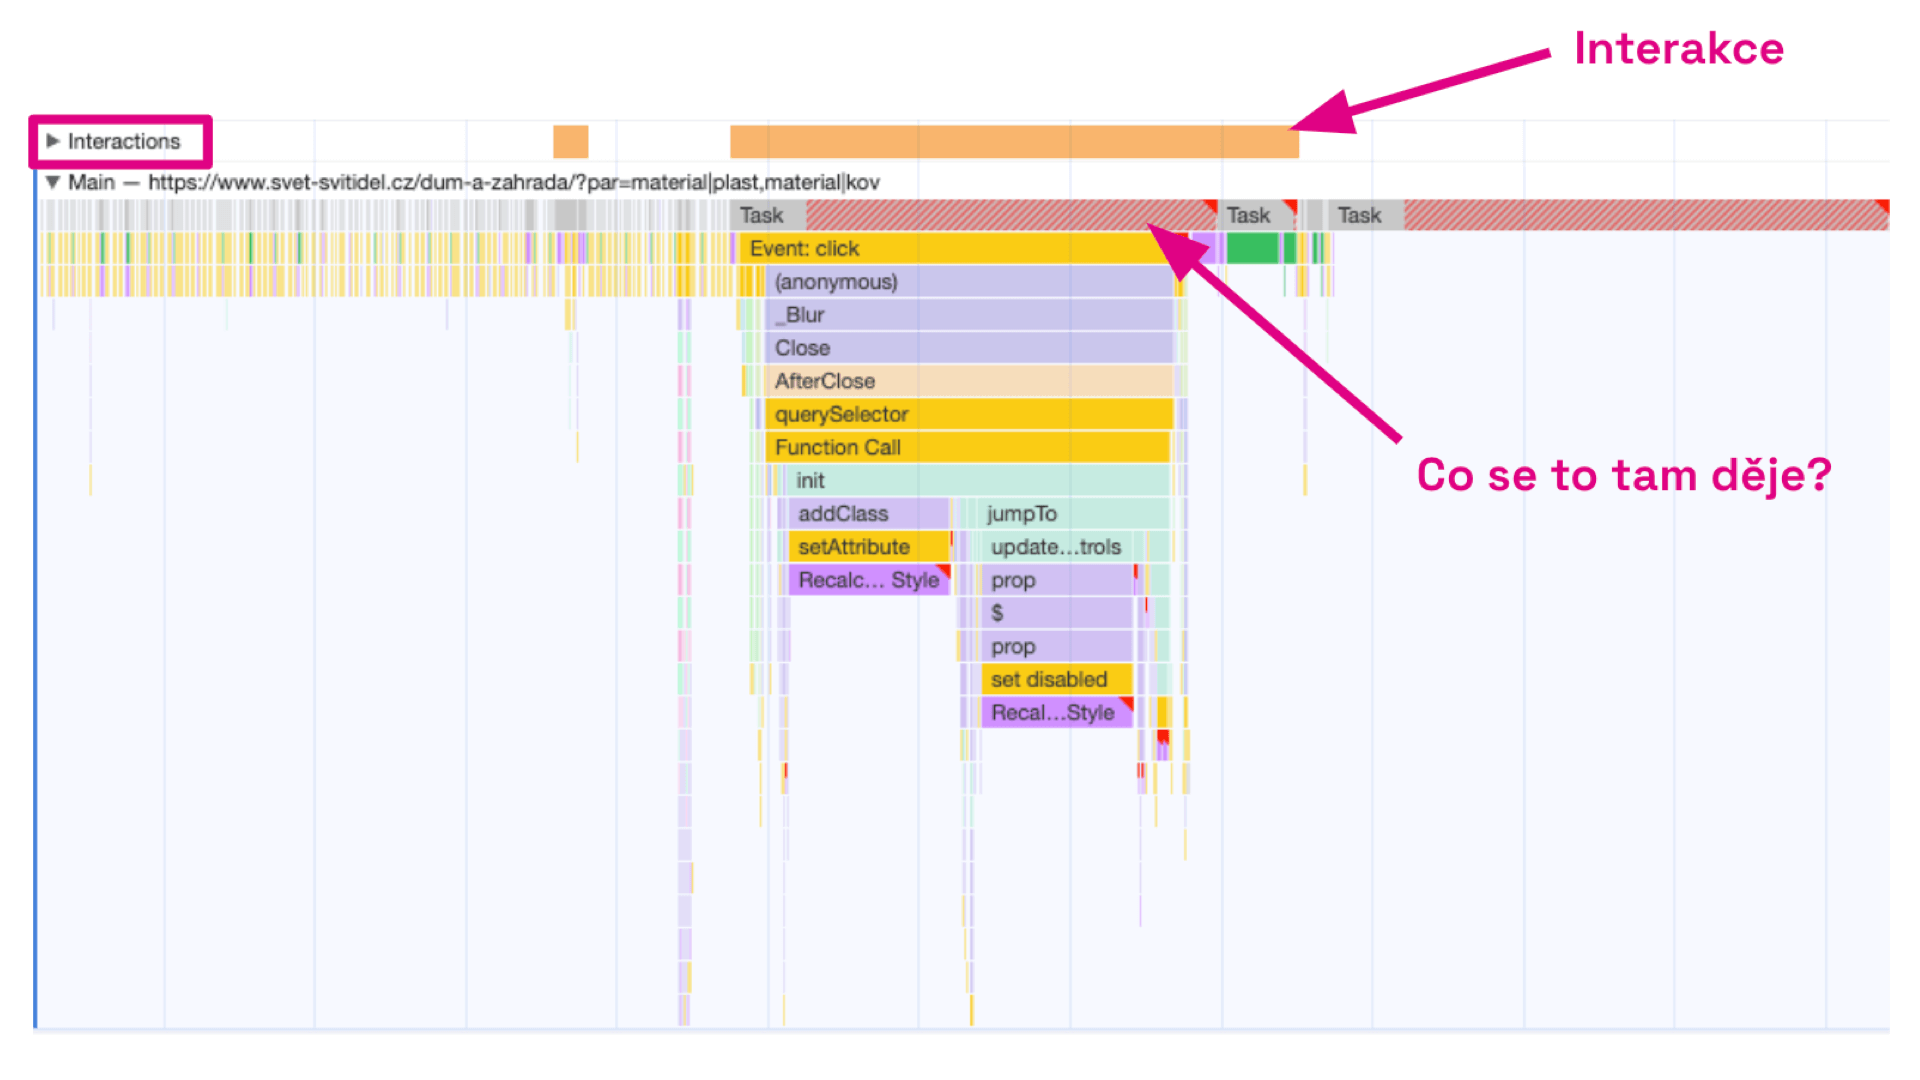 Performance Tab - Timeline
The "Main" tab then represents the scripts and methods running, answering the question "What's going on there?"
Common Mistakes and Optimization Opportunities
Interaction to Next Paint is primarily a JavaScript metric, but many things can be resolved with UI adjustments. We have a separate article on INP optimization, but here we'll briefly list some basic options.
Don't Keep Users Waiting for a Response
After a user interaction, the screen must change as soon as possible. If there is an AJAX/Fetch request, the user often doesn't know that something is pending. It is necessary to provide a visual response as soon as possible. Therefore, react with layout changes and display a loading indicator.
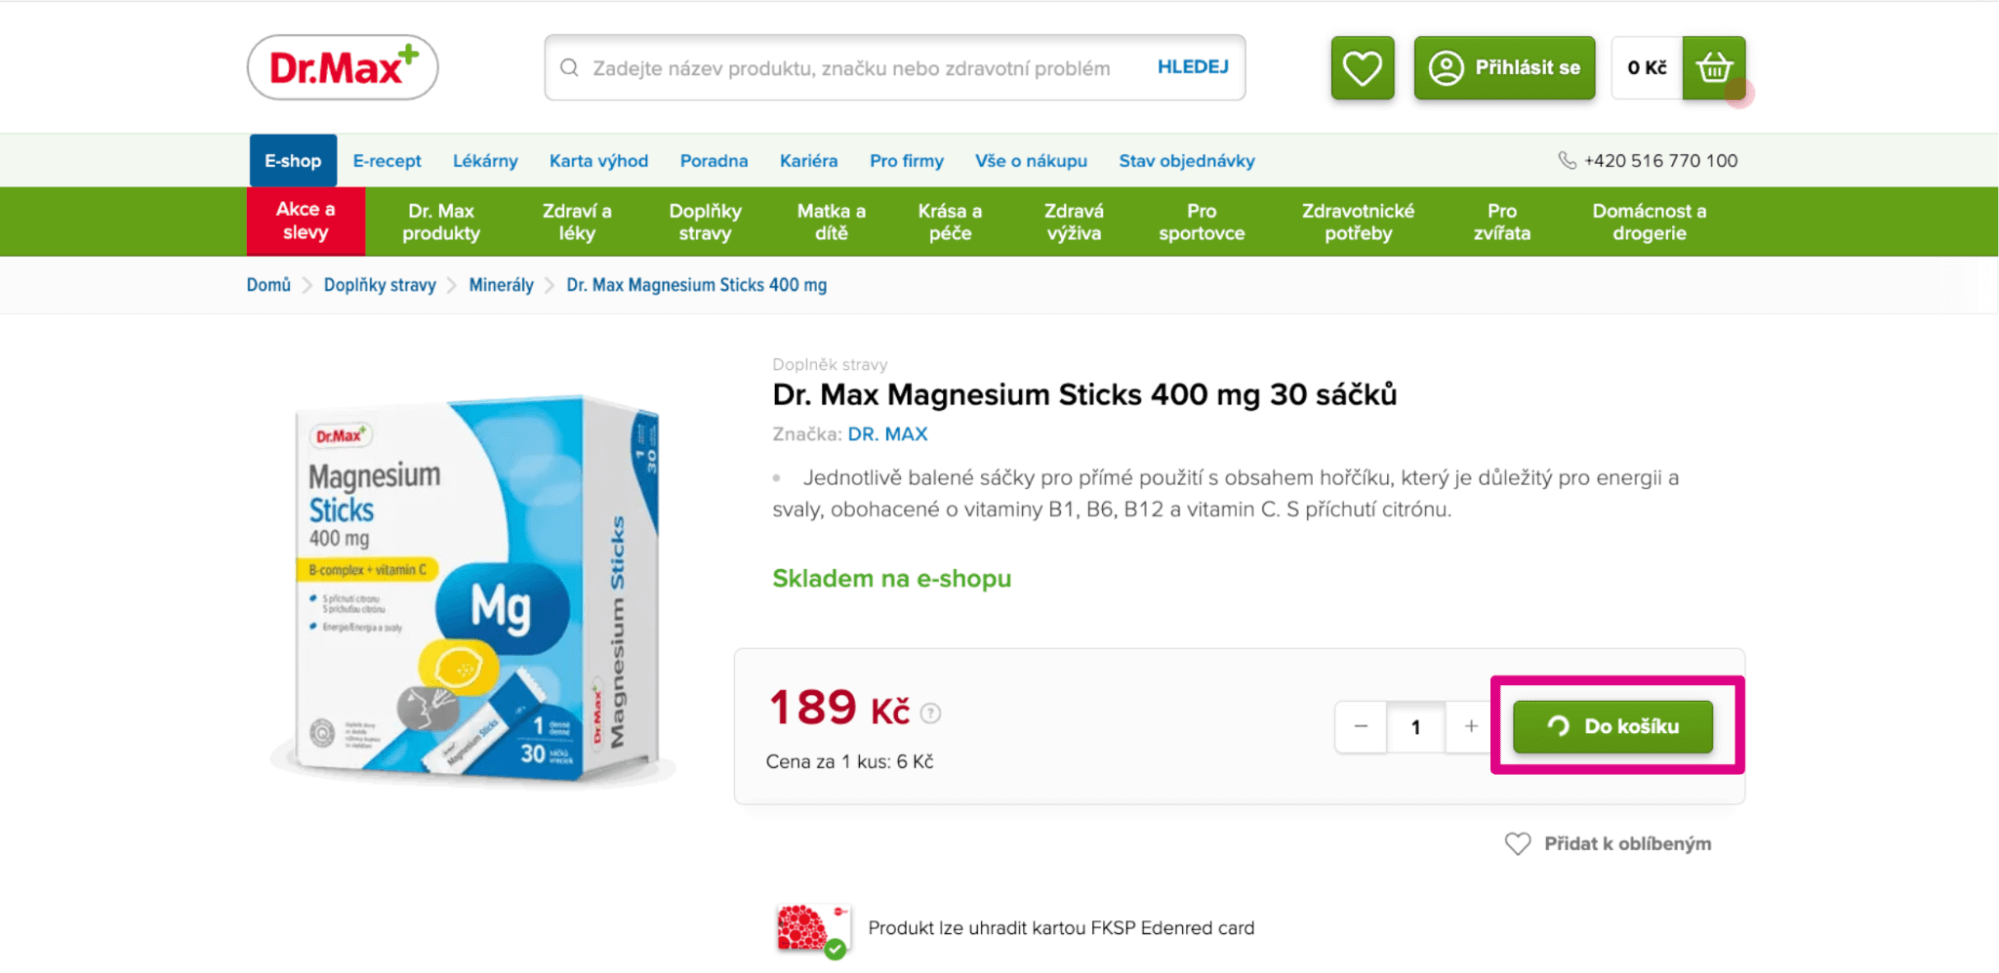 Don't Keep Users Waiting for a Response
Don't Trigger JS Code on Click That You Can Defer
Defer events like various measurements and sending measurement codes until after the interface responds. Long tasks, triggered e.g., in GTM on a button click, prolong the interface's response and worsen INP.
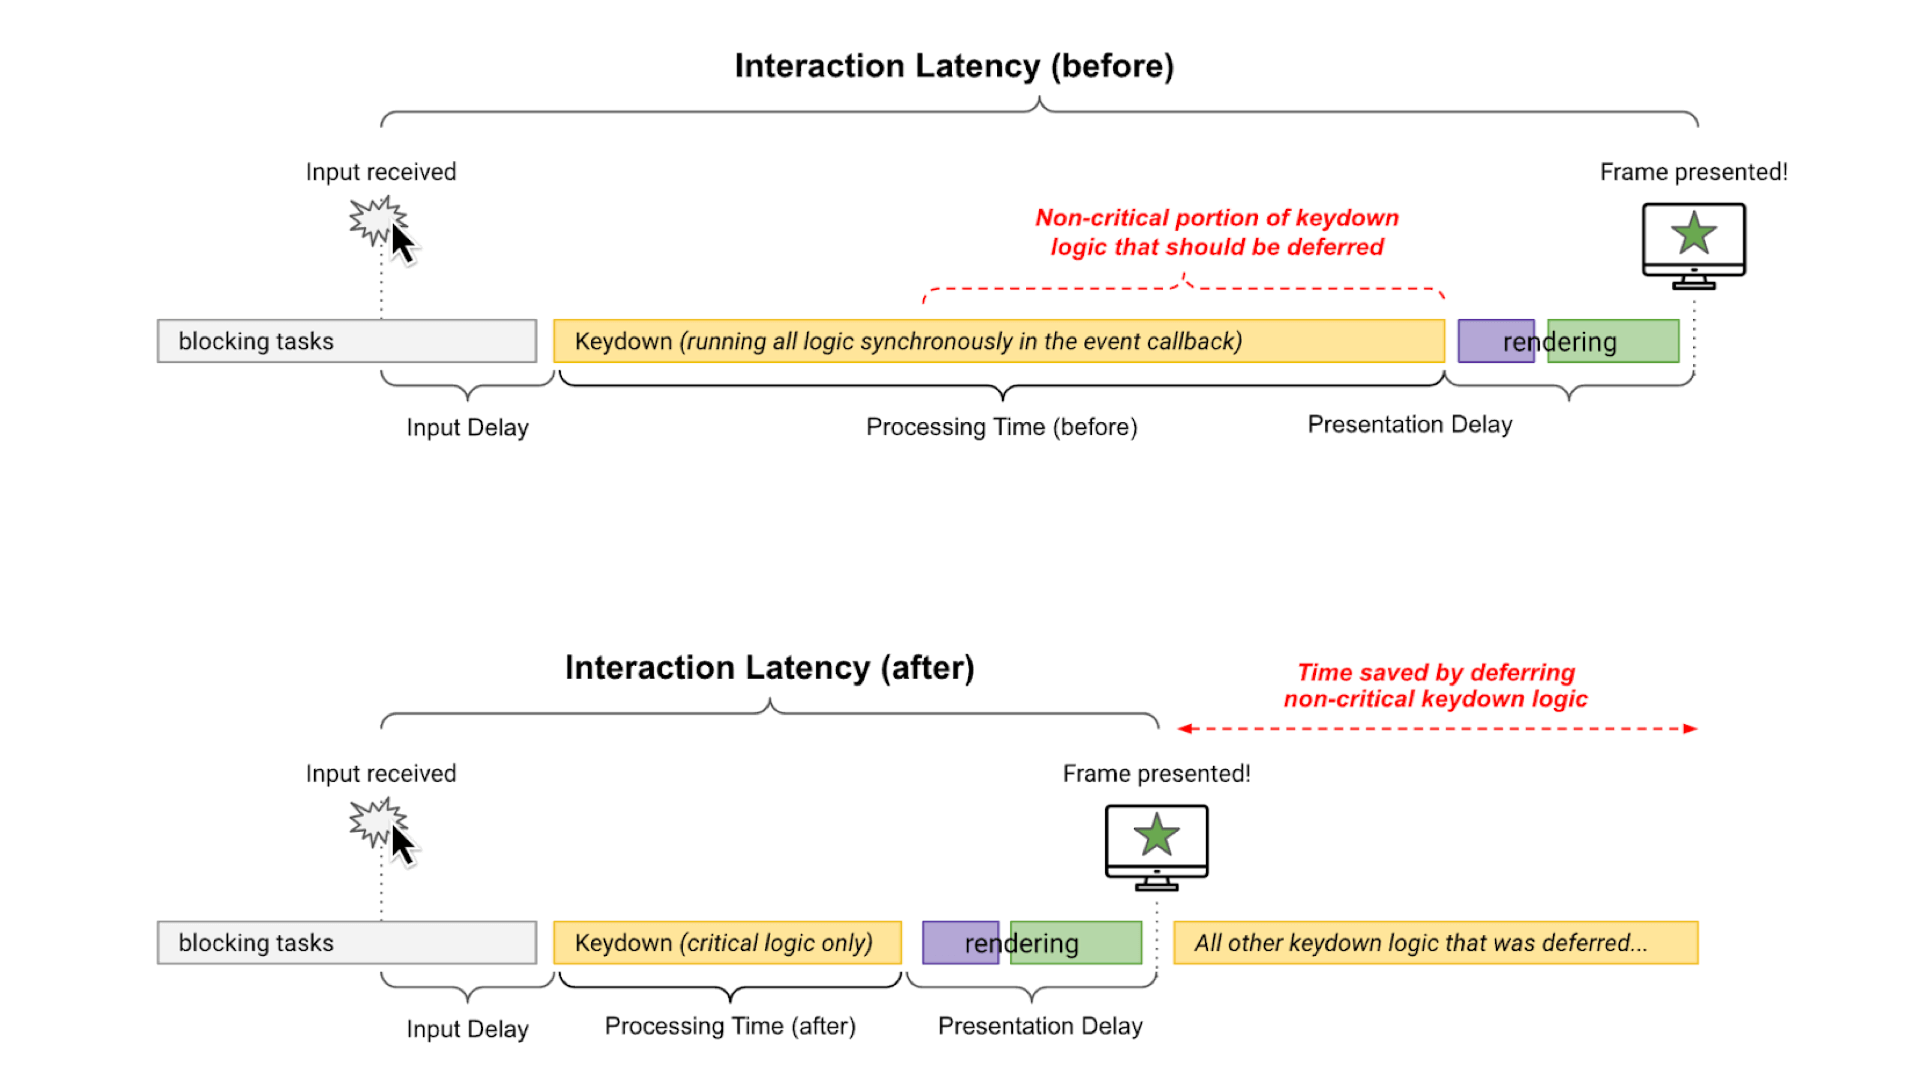 Don't Trigger JS Code on Click That You Can Defer
Eliminate Long Tasks in JavaScript
JavaScript code can create Long Tasks. These tasks need to be broken down into smaller tasks that execute consecutively and do not block the response. The simplest way to divide Long Tasks is to wrap the code in a setTimeout function.
document.addEventListener('DOMContentLoaded', function() {
  setTimeout(() => {
    // Your function calls here
  }, 0);
});
There are many interesting possibilities for optimizing INP, and it is also worth considering the following:
- Optimizing Fetch/Ajax response speed.
- Minimizing the DOM, using "lazy load for DOM" content-visibility.
- In the future, scheduler.yield(), Long Animation Frames API will be interesting instead of setTimeout().
You can find specific experiences with INP optimization in our case study Innogy: How Long-term Collaboration with PageSpeed.ONE Improved INP by 38%.
Need help with INP? Try our new SpeedSprint service.
What to Remember About INP
- Interaction to Next Paint (INP) measures the overall responsiveness of pages to user interactions by tracking the delay of all events that occur during the user's entire page visit.
- Recommended values for INP are up to 200 ms, 200 to 500 ms requires adjustments, and above 500 ms, INP is unsatisfactory.
- Google plans for INP to become part of Core Web Vitals in March 2024, replacing the FID metric.
- When optimizing INP, focus on removing long tasks in JavaScript, don't keep users waiting for a response, and defer JS code that isn't immediately needed.
The INP metric is part of our unified speed metric, PageSpeed.ONE Score (SPS).
See also INP metric optimization.