JS Long Tasks (JSLT) Metric: When Your Website Forgets to Breathe
Imagine clicking a button and nothing happens. The website simply freezes. Most often, the culprit is a “long task”—a JavaScript operation that overstays its welcome. It's that moment when the browser is deep in thought, ignoring everything else.
In this article, we'll explore how the JS Long Tasks metric measures these digital traffic jams and what they could mean for your users and your business.
Freezing Websites Due to JavaScript: More than 50 ms is Too Much
JavaScript, the workhorse of the web, has one particular quirk. It typically runs in a single thread.
Think of the browser as a chef capable of doing only one thing at a time. If it's chopping onions for a giant stew, it can't simultaneously answer a call from the boss.
A Long Task (a long-running JavaScript operation) is any operation that takes longer than 50 ms. This threshold is derived from the RAIL model. Users perceive a response within 100 ms as instantaneous. The remaining 50 ms is the browser's buffer to react to your click.
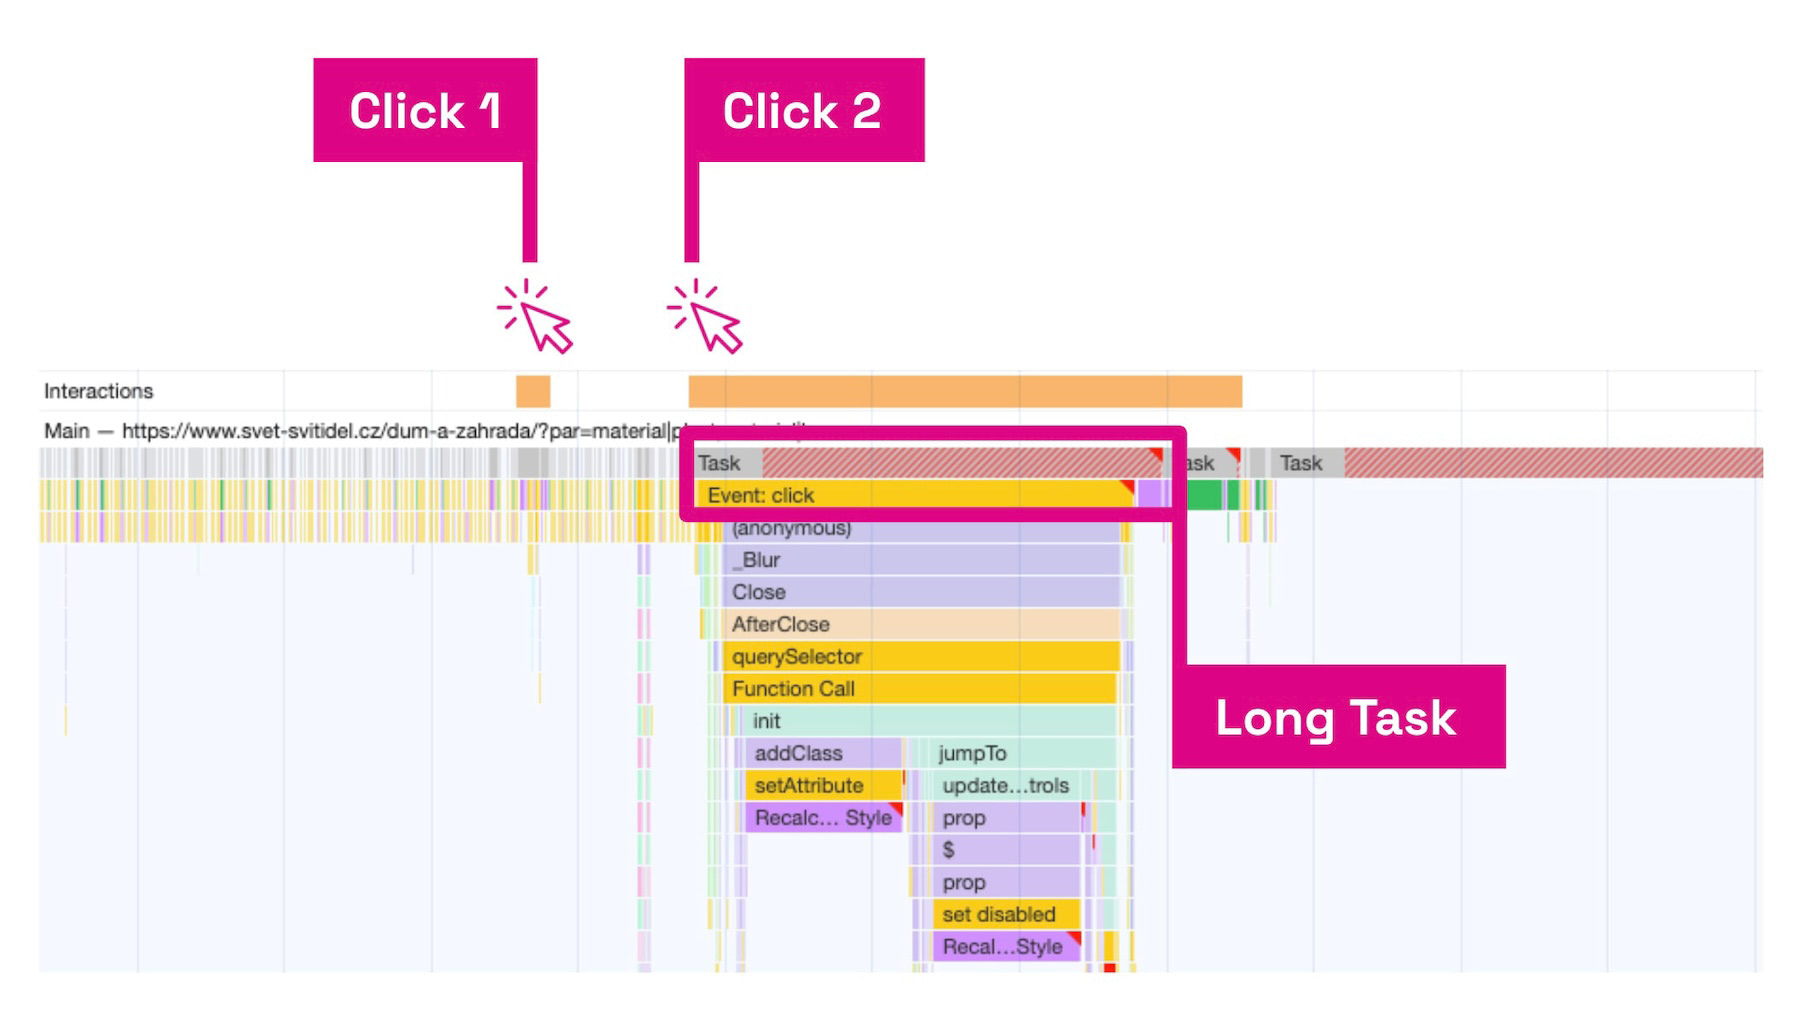 This is how the browser sees it. The user's second click coincides with a long task. The browser is now the chef chopping onions, unable to take the call from the boss.
The browser's main thread is like a script guiding how it utilizes the processor and memory. When a long task runs, the main thread is blocked. The user can't click or type during this time.
Many JS Metrics, Many Confusions
We all crave those green numbers in Core Web Vitals. The JS Long Tasks metric isn't part of this core set, but it can reveal a lot.
Clients often ask the experts at PageSpeed.ONE, what's the difference between Long Tasks and metrics like Interaction to Next Paint (INP) or Total Blocking Time (TBT).
Specifically, TBT and JSLT metrics are similar. In brief, TBT is a strict lab test, while Long Tasks in RUM are records of how the web truly struggles in users' hands. Total Blocking Time (TBT) is measured synthetically and only during loading. JSLT is measured with real users. For more on the differences between synthetic and RUM measurements, see the article synth vs CrUX vs RUM.
Here's a handy comparison table:
| Feature | Total Blocking Time (TBT) | JS Long Tasks (JSLT) |
|---|---|---|
| Data Source | Lab (simulated bot) | Real users (RUM) |
| Time Window | Only during loading (FCP → TTI) | Entire page lifecycle (even post-load) |
| What is Counted | Only time over the 50 ms limit | Entire duration of all tasks |
| Main Goal | Quick technical check | Business analysis and real UX |
| Typical Tool | Lighthouse, PageSpeed.ONE Monitoring | SpeedCurve RUM |
And the INP metric? Both TBT and JSLT can have a direct, but often indirect, relationship with that Core Web Vitals metric.
Real World Stories: Innogy and an E-commerce Client
Those who can't measure, can't manage. We measure to manage web speed because it affects business parameters.
Let's look at how this plays out in the real world with our clients.
Innogy: Taming Interactivity
At Innogy, PageSpeed.ONE tackled slow JS metrics on mobile devices. Analysis showed that bulky scripts and complex styles blocked the main thread.
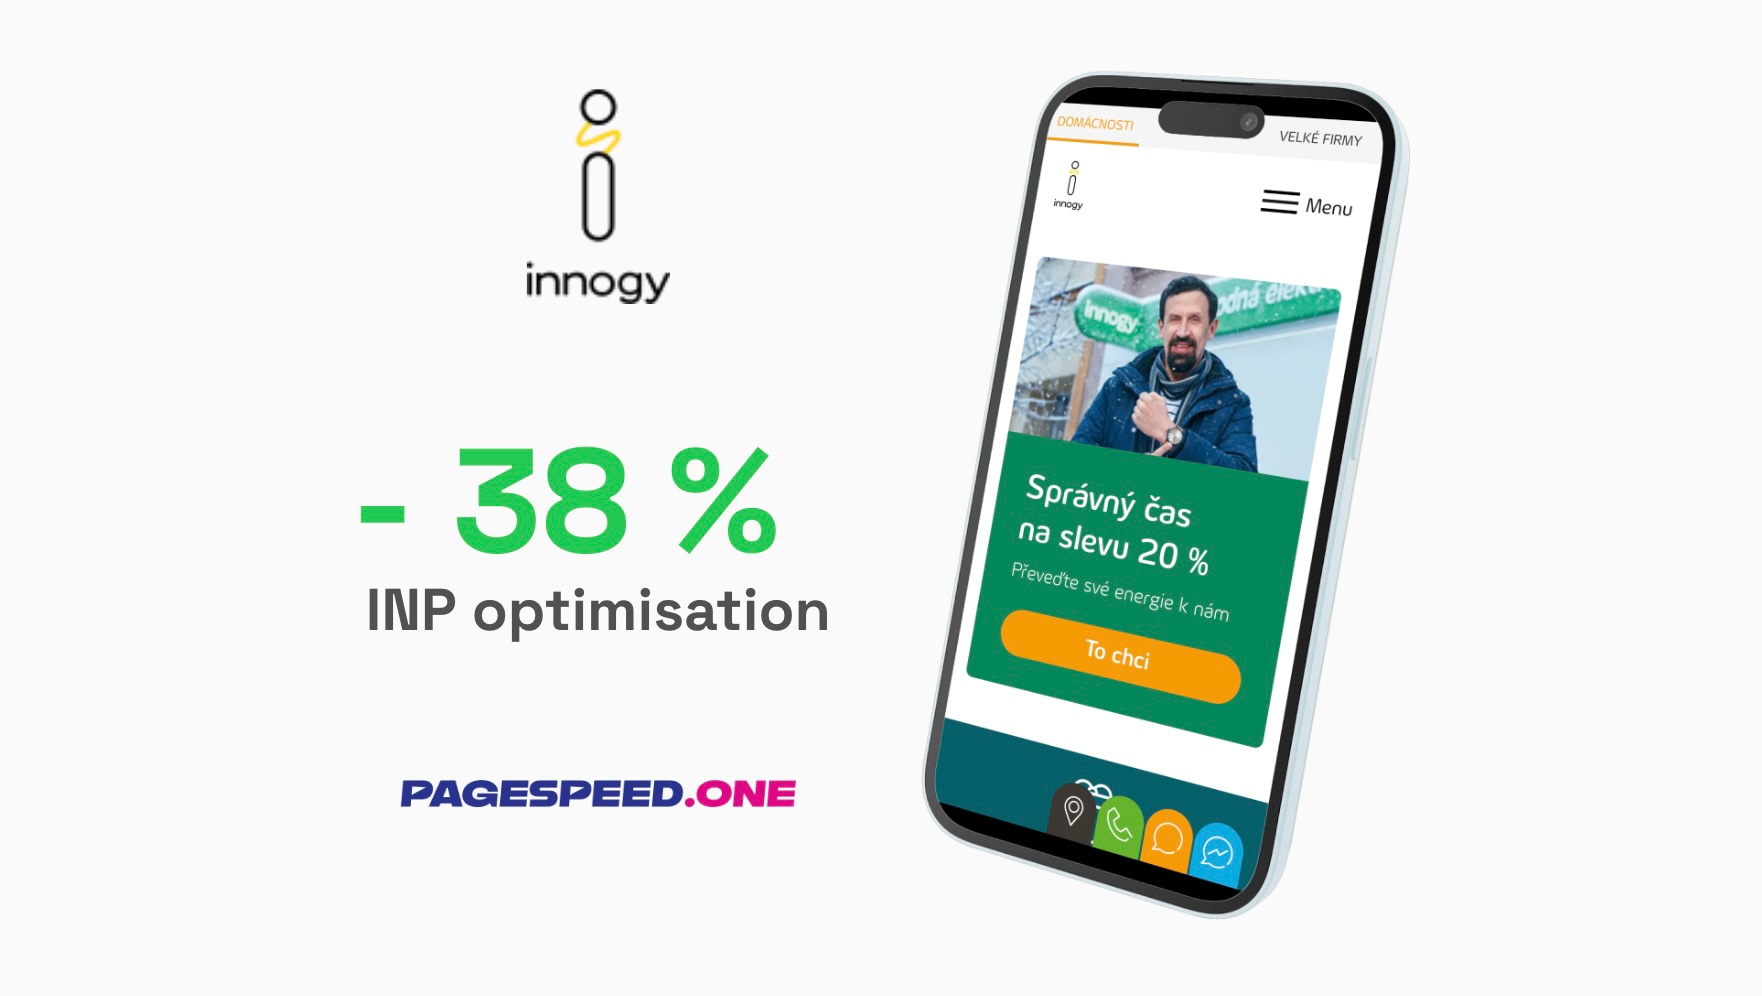 By breaking long tasks into smaller parts, we reduced the INP metric by 38%.
The website now runs smoothly even on budget phones. A case study is in the works.
Fewer JavaScript Jams, More Orders
For another client in e-commerce, our analyses found a clear correlation. The longer the JS Long Tasks and the INP metric, the lower the conversions.
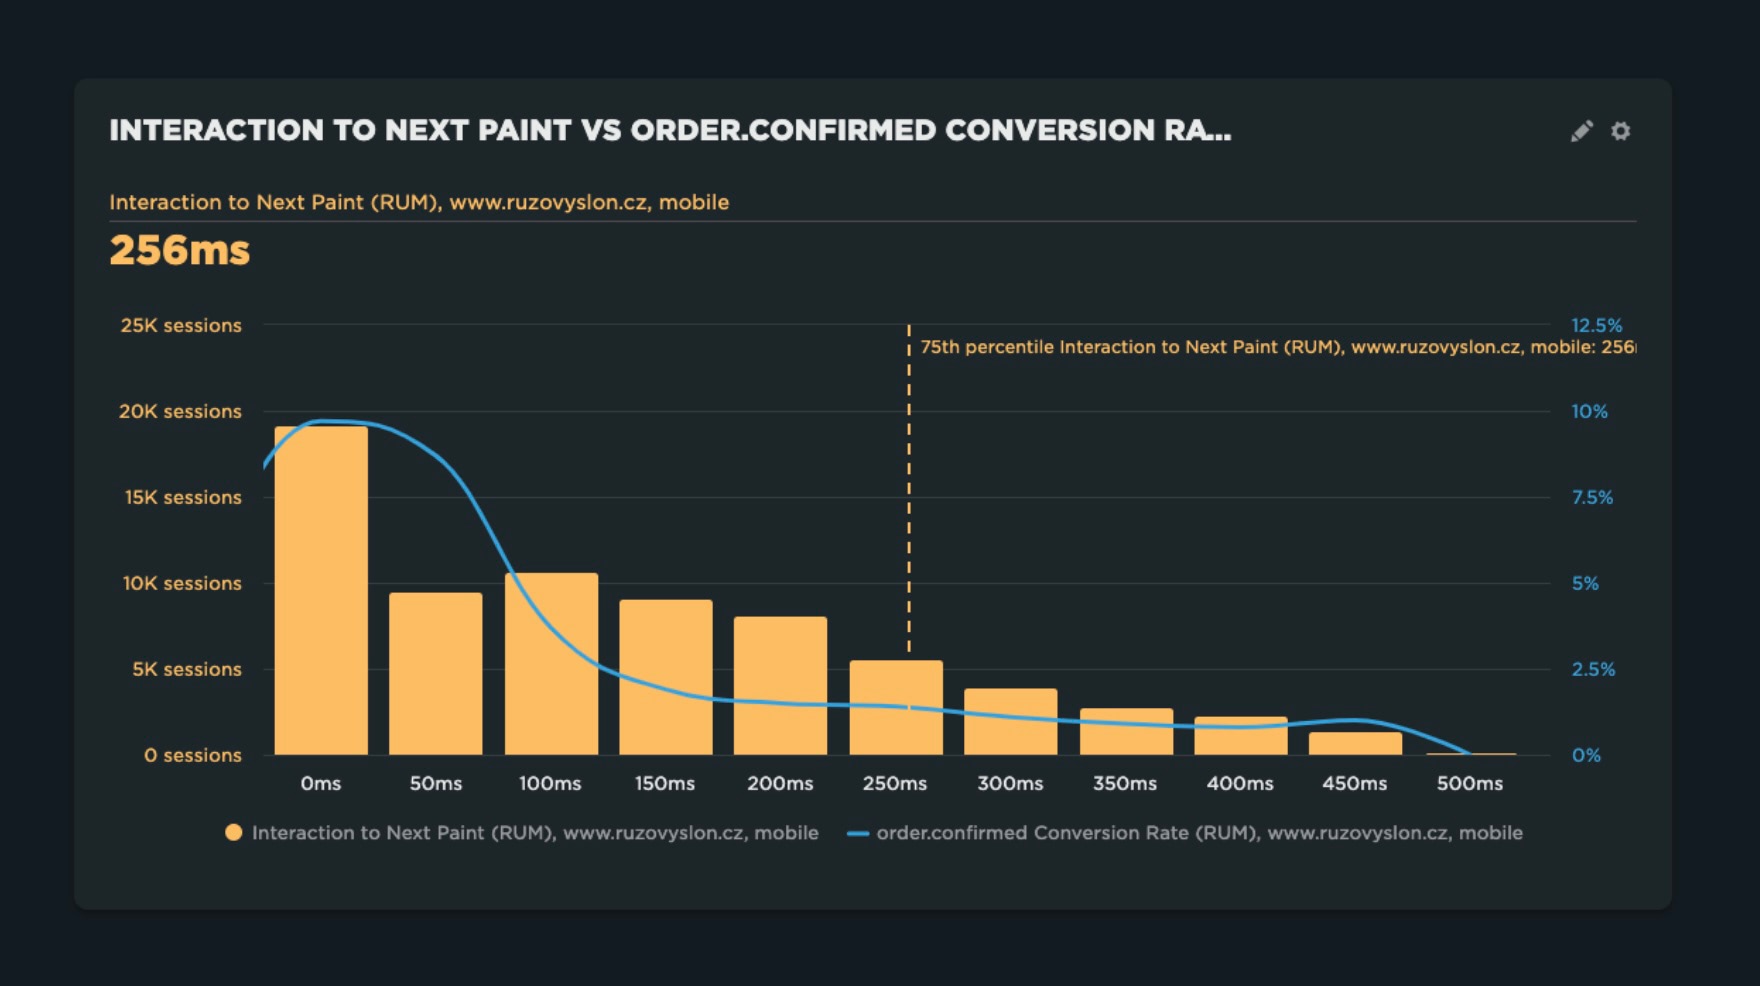 The blue line is the conversion rate, the orange bars show the metric value. More long tasks mean lower conversions.
Long tasks "froze" the website at crucial moments. That's why we focus on JS metrics for this client, optimizing them helps retain customers in the purchasing process.
In short: a smooth website free of Long Tasks can directly boost your revenue. Is this also your case? Discover it with our business analysis.
How to Optimize the JS Long Tasks Metric?
Diagnosis is the foundation. Without it, you're merely guessing. You need monitoring and Chrome DevTools. For practical tips on breaking down long tasks, see our article on INP metric optimization.
How to delve deeper? You essentially have two paths.
- Chrome DevTools: Open the Performance panel and record an action on the site. You'll see Long Tasks as blocks with a red right corner. It's a clear warning.
- Long Tasks API: If you're a developer, you can collect data using this interface in the browser.
// Example of tracking Long Tasks in the browser
const observer = new PerformanceObserver((list) => {
	for (const entry of list.getEntries()) {
		console.log(`Warning, Long Task! Duration: ${entry.duration}ms`);
	}
});
observer.observe({ entryTypes: ['longtask'] });
Just check the console and see who's falling behind in the kitchen.
Cookbook for Better JS Long Tasks
Optimizing JavaScript metrics isn't easy, let's be honest. You always need to consider the broader context of the web and choose the most effective solution. The advisory PageSpeed.ONE team can help with that.
Optimizing Long Tasks isn't magic, it's discipline. Here are the basic practices:
- Yielding: If you have a long computation, break it up. Use techniques like
setTimeout(0)or the modernscheduler.yield(). For React, check out our tips in the React optimization article. This gives the browser time to "take a break" and process user clicks. - Code Splitting: Don't send all the code to the browser at once. Split it into smaller bundles that load only when needed.
- DOM Optimization: The fewer elements your page has, the faster the modifications. A massive DOM structure slows down every browser operation.
- Web Workers: A tip for geeks. Offload heavy computations to a "side office" (secondary thread). This keeps the main thread free for user interaction.
Monitoring PLUS: Your Ever-Watchful Eye
Monitoring Long Tasks on your own computer is just the beginning. But what about your customers? Our tool monitoring PLUS tracks metrics for you. This way, you'll know in time if a new marketing script or the developers' work is starting to degrade your website's performance. Learn more about web speed monitoring in our monitoring guide.
We help you with Core Web Vitals monitoring and send you notifications in case of significant changes.
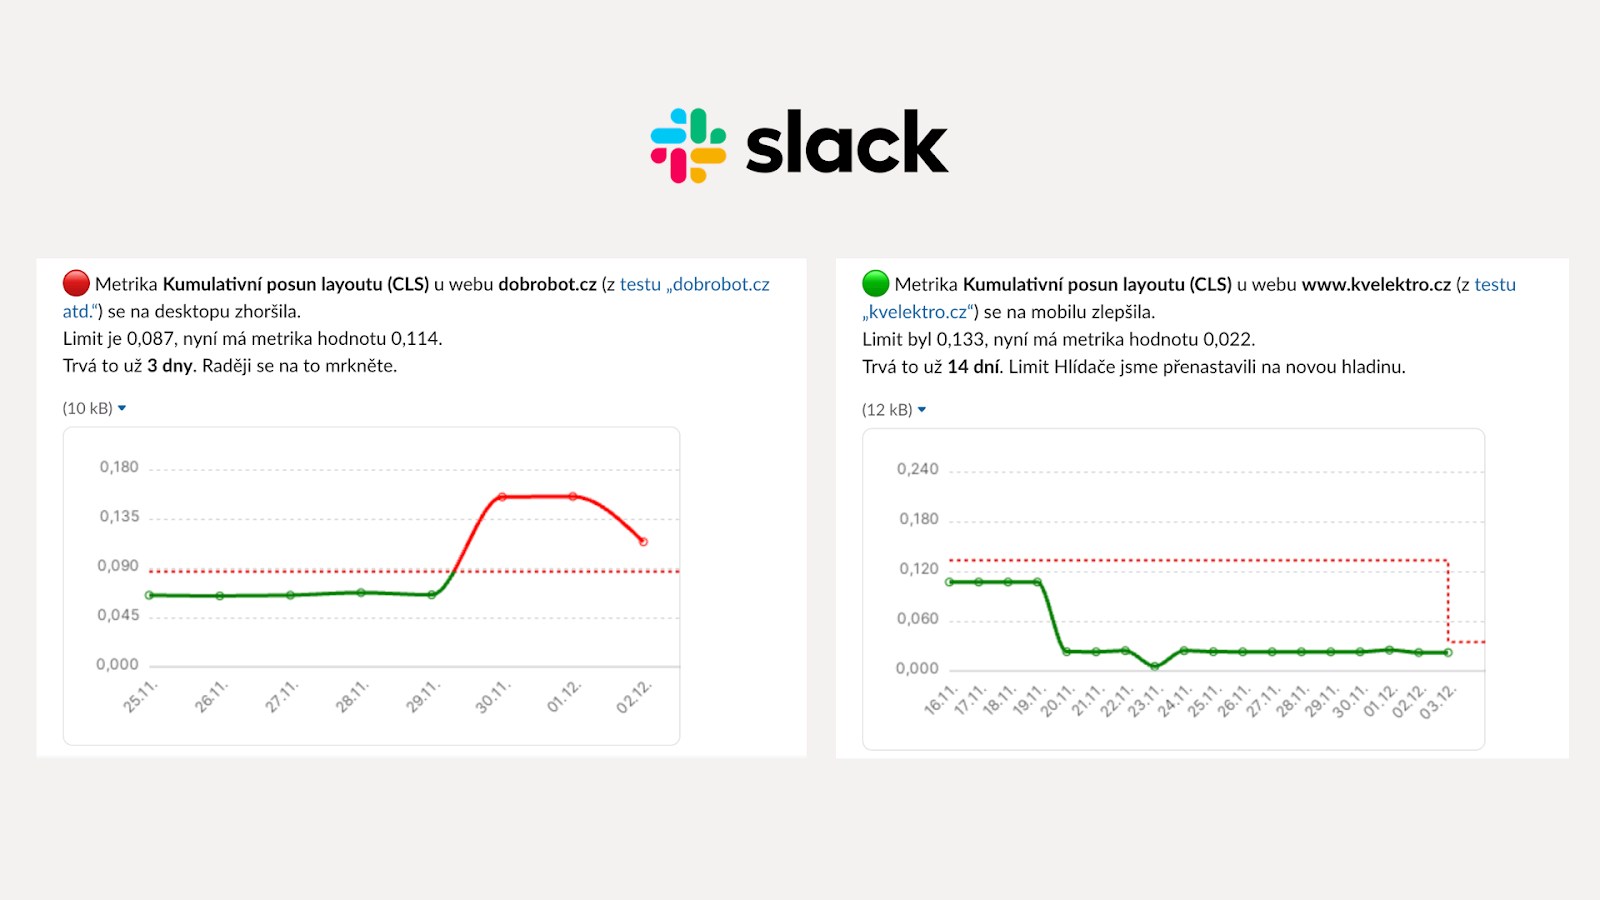 Do you receive notifications of changes in JavaScript metrics and your website's speed in general?
Conclusion
JS Long Tasks can be the stealthy killers of user experience. You can have a beautiful design, but if the website doesn't respond, conversions drop. Focus on ensuring your main thread always has room to breathe, and keep an eye on the INP, TBT, and JSLT metrics.
What's next?
- Want to know how your website is doing? Test it.
- Need to optimize metrics? Check out the SpeedSprint analysis.
Tags:MetricsINPLong TasksJavaScript
PreviousThird-Party Blocking (3PBT)NextLighthouse Score (LPS)