PageSpeed.ONE Score (SPS): How We Determine User Web Speed
 Martin MichálekUpdated 7/28/20265 minutes reading
The realm of web speed and its measurement can be quite daunting for the layperson. Consider the metrics alone. To truly comprehend the state of your website's speed from a user's perspective, you need to track at least six metric values of Core Web Vitals for each of your domains or subdomains.
Therefore, we've come up with a single figure that serves as a proxy metric for Core Web Vitals on both mobile and desktop. We call it the “PageSpeed.ONE Score” (SPS).
In this text, you'll learn about the motivation that led us to develop the speed score (SPS), how it’s calculated, and what’s new in its 2025 version.
Why Seek a Single Number to Represent the Entire Web’s Speed?
To understand the true state of your website’s speed for your users, you need to know the following:
- Differences between various measurement types (CrUX, synth, RUM).
- Details on how Google gathers user data, specifically about the Chrome UX Report.
- Values of all three Core Web Vitals metrics – LCP, CLS, INP – for all your websites, individually for mobile and desktop.
It's hardly surprising that people often simplify speed into the form of the Lighthouse score (LPS), which purports to provide “one number for the whole web”. However, using it to measure web speed is, frankly, quite misguided – and LPS often gets hacked.
This is precisely the issue our PageSpeed.ONE Score (SPS) addresses. It offers a single figure that better represents the actual speed of the web for users.
Calculating the PageSpeed.ONE Score
Below is the updated method for calculating the speed score (SPS), reflecting how real users perceive speed:
-
From the Chrome UX Report, we take the current values of the three Core Web Vitals metrics for the entire domain or URL, separately for mobile and desktop.
-
We also consider user distribution, not just the 75th percentile. Even when the 75th percentile is “green”, a significant portion of the audience might experience a slower web. The distribution shape of each metric is shown in the histogram in the Chrome UX Report.
-
Each metric carries different weights. LCP has the highest weight due to frequent correlations with conversions. CLS and INP metrics have lower weights.
-
We use data from both mobile and desktop, determining their mutual share in the calculation based on the actual traffic distribution of the given website. Thus, there’s no fixed mobile vs. desktop ratio.
-
The score is calculated in percentages. The best theoretical value is 100%, but it is practically unattainable.
-
The score has three value zones: 0–25 red; 25–75 yellow; 75–100 green.
-
If any Core Web Vitals metric falls in the orange zone, the resulting speed score (SPS) will be limited to the orange zone as well.
The result is a single number on a scale from 0–100% that indicates the website speed status for real users, spreading more evenly across the entire scale than before.
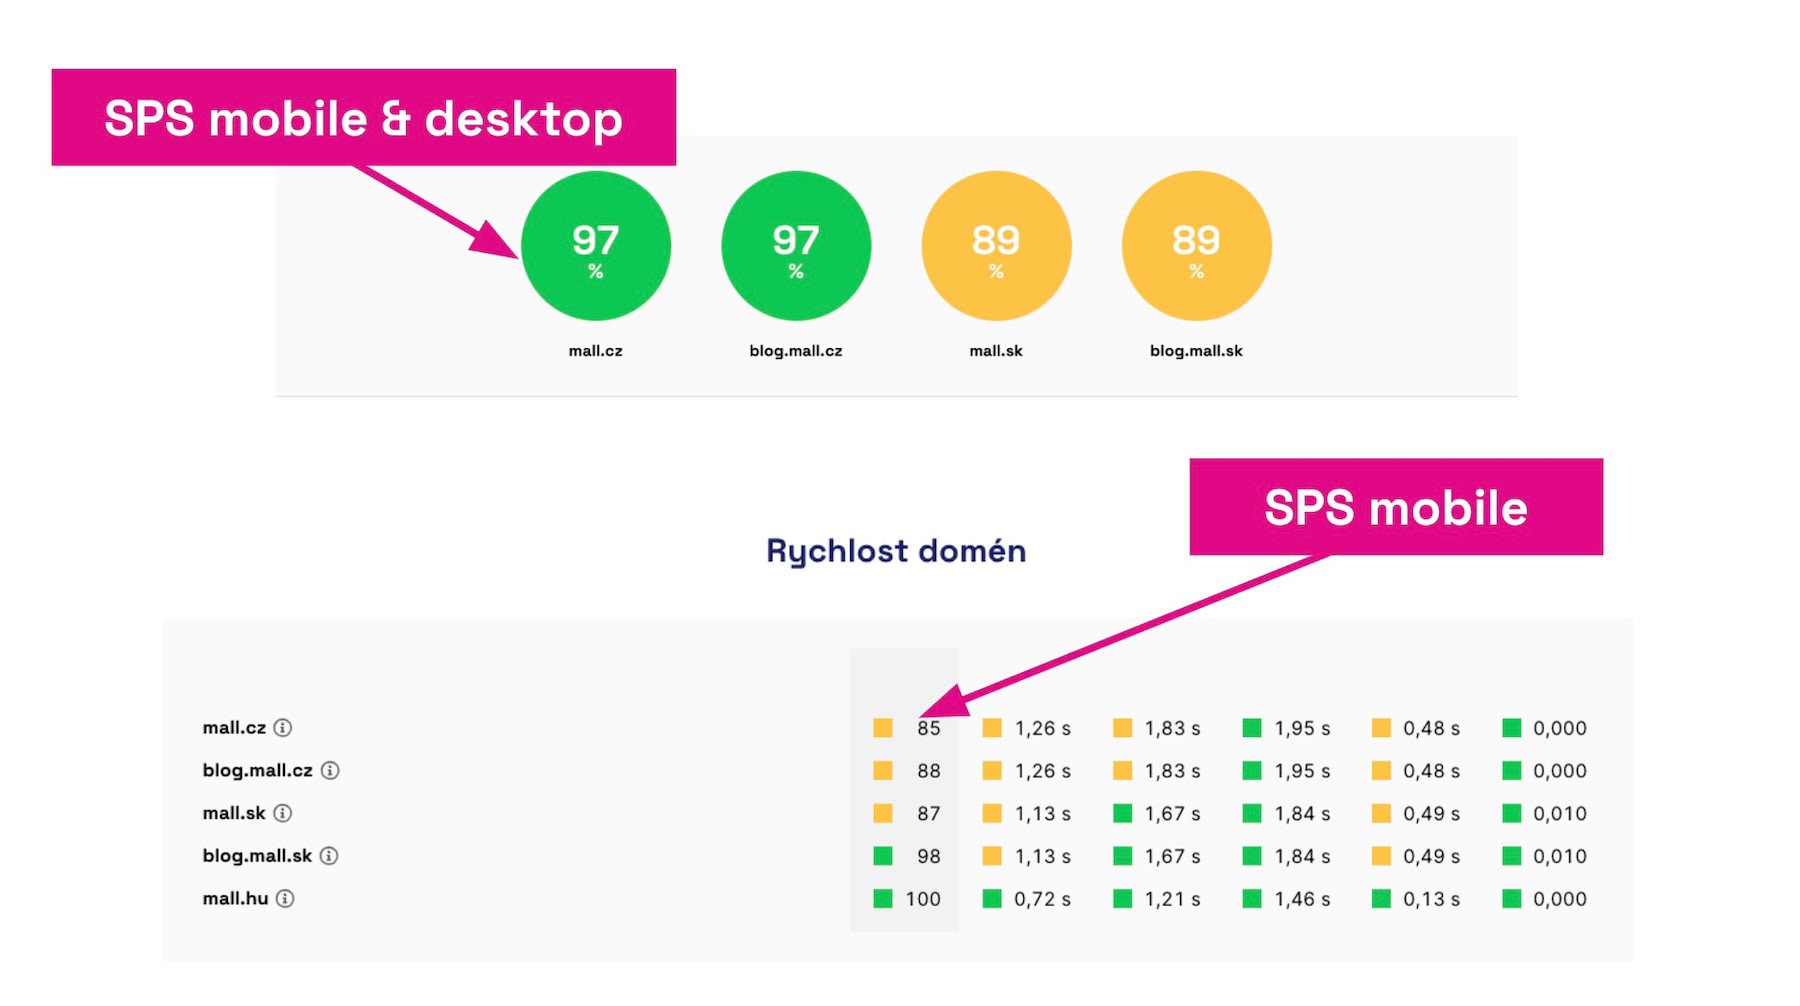 In the Summary report, you will see the speed score (SPS) for mobile and desktop, as well as for individual device types separately.
What's New in the 2025 Version?
The new version of the speed score (SPS), launching on November 28, 2025, introduces several significant changes:
-
Stricter for fast sites A value above 95% is exceptional, and 100% is nearly unattainable.
-
No more clustering at 89 and 99 Finer calculations within all zones. Websites naturally spread across the full scale, which is important for rankings and Awards.
-
Incorporating user distribution Not just the 75th percentile. The new speed score (SPS) also indicates how large a portion of users genuinely meet Core Web Vitals.
-
Mobile vs. desktop based on real traffic Device weights are not fixed. Each website is set according to where its users genuinely come from.
-
Historical speed score (SPS) and distribution In the Domains and Pages reports, you can now see the historical development of the speed score (SPS) and user distribution across various speed categories, making it much easier to track how your website's speed changes over time.
-
Ready for rankings The new calculation is designed to fairly rank e-shops and large websites within PageSpeed.ONE Awards and other studies.
We believe that the PageSpeed.ONE Score will help you navigate the speed of your websites. Nevertheless, it’s important to clarify how to handle this new metric.
How to Interpret the PageSpeed.ONE Score?
The PageSpeed.ONE web speed score is a “proxy metric”. It can assist people who are not as deeply involved in web speed as, say, developers.
The target audience for the speed score (SPS) includes website owners, marketers, project managers, and so forth. The score indicates the current state, but also the historical development of the speed status of a specific domain for users, all in a single percentage value.
However, our score by no means replaces monitoring speed at the level of Core Web Vitals and thus the three metrics for two types of devices.
PageSpeed.ONE Score is Not a Substitute for Core Web Vitals
Core Web Vitals metrics provide more insight into three areas of speed:
If you embark on optimizations, focusing on these specific metrics should be the first step. At the same time, the speed score (SPS) does not show how Google evaluates the speed of your domains or pages.
We therefore recommend monitoring both the speed score (SPS) value and Core Web Vitals metrics for optimization purposes and setting their objectives.
Where Can You Obtain the PageSpeed.ONE Score?
You can view the metric's value in the Summary report in monitoring PLUS, but it's also available in free measurement on our website – pagespeed.one. The history of the SPS score can also be accessed via public API.