How to Read Core Web Vitals in Google Search Console and Improve Web Speed
 Martin Michálek6/30/202610 minutes reading
Google Search Console (GSC) is a free tool where Google shows you how your website appears in search results. This includes insights into speed, specifically the Core Web Vitals metrics. This is where most non-experts tend to get lost.
This article is for those responsible for website speed who find themselves struggling with Search Console. For developers, marketers, project managers, and website owners who need to understand Core Web Vitals data and know what to do next.
Why us? At PageSpeed.ONE, we've successfully optimized dozens of both large and small client websites. Search Console is our second most important tool, right after our own speed monitoring. We take it seriously because we regularly see the connection between Core Web Vitals and SEO outcomes, PPC click costs, and conversions.
What is Google Search Console and Why It Matters
Google Search Console is a set of reports about how your website performs in Google Search. It shows which queries you appear for, which pages Google has indexed, any technical issues with your website, and how it rates user experience, including speed.
For web professionals, it's crucial for one simple reason: this data comes directly from Google, not a third party's guess. When Google says some of your pages are "poor" in terms of Core Web Vitals, that's the same signal that reflects in search rankings.
And why particularly for speed? Speed is a ranking signal. It affects SEO and PPC click costs, as a slow landing page worsens the Quality Score in Google Ads. We've repeatedly witnessed the impact of Core Web Vitals on business, like with the e-shop Denatura, where we combined speed optimization with ongoing analysis in Search Console and gradually saw improvements in search rankings.
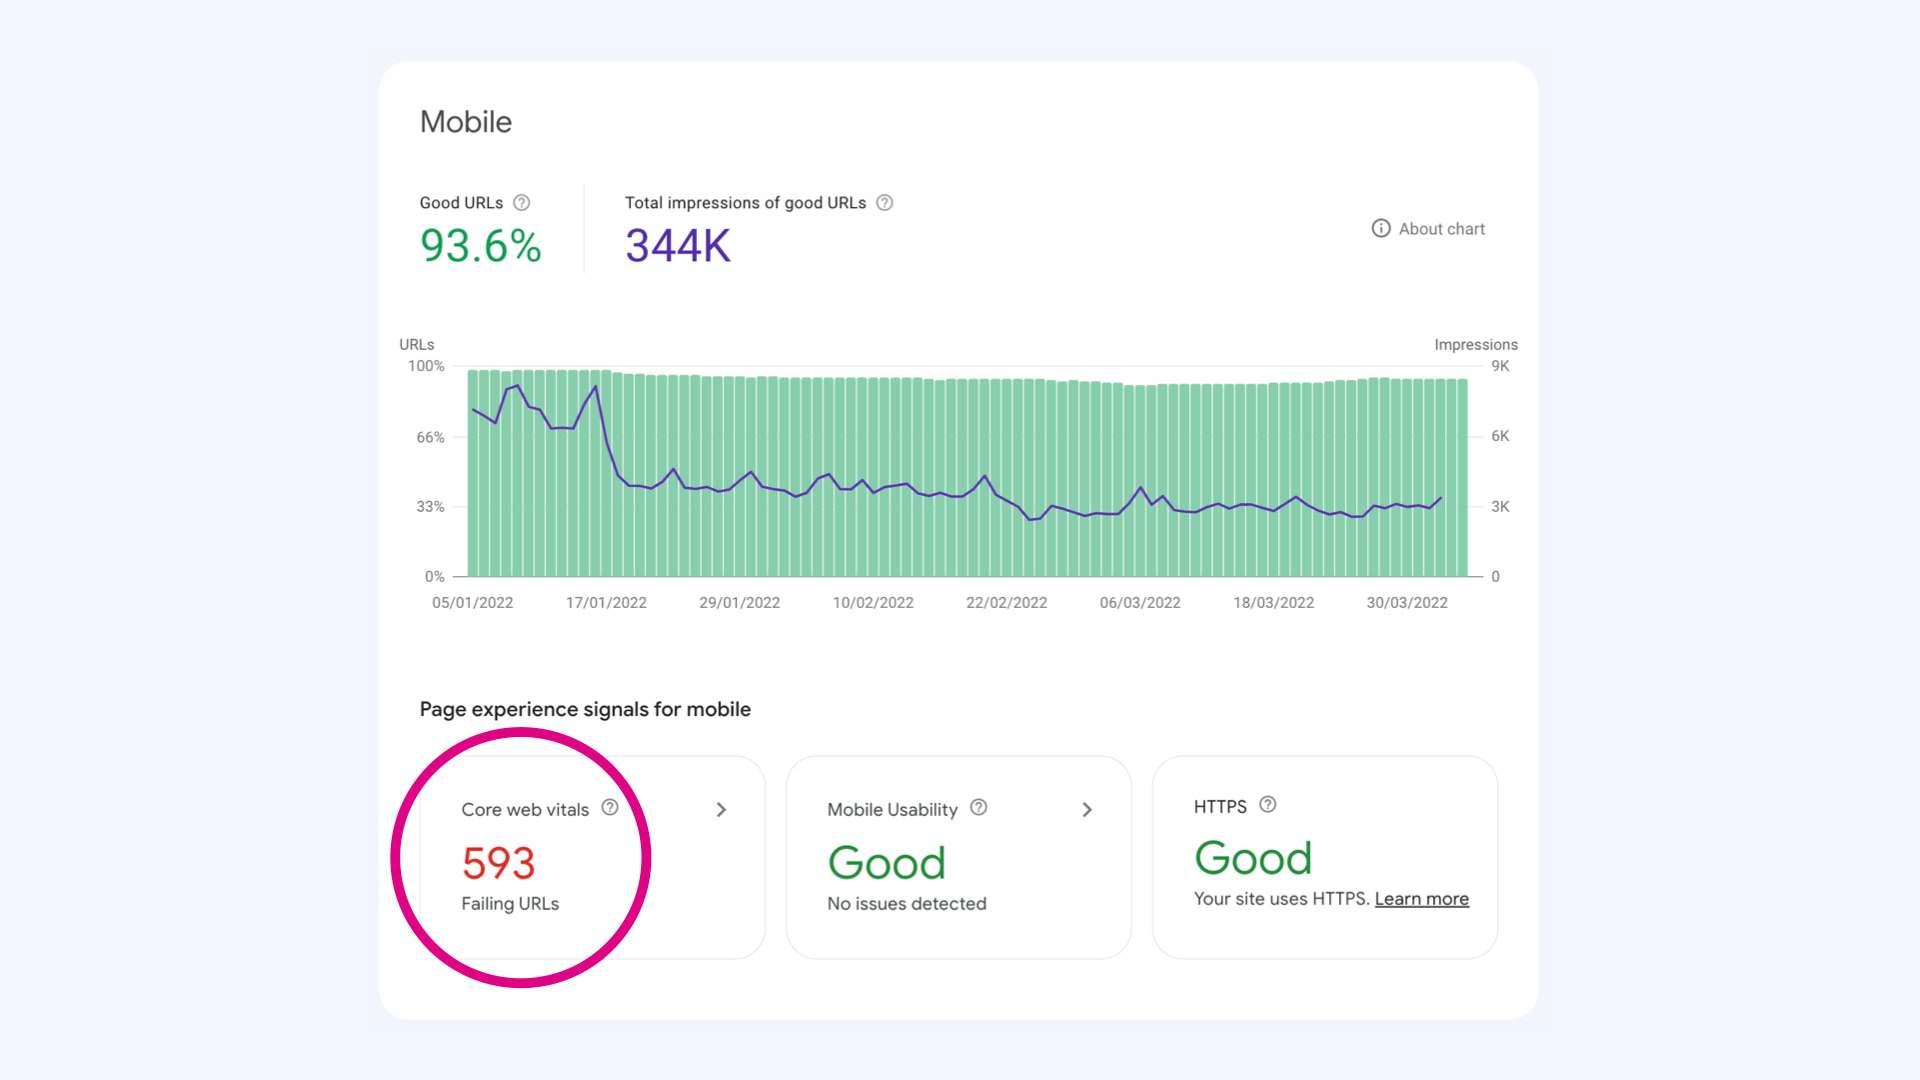 Search Console quickly reveals where Google sees problematic URLs or page groups.
How Google Measures Speed
Before diving into reports, it's essential to understand how Google measures speed. Without this, you'll lose yourself in the numbers.
Basics: Metrics, CrUX, and the Worst Metric Rule
Speed is described by three Core Web Vitals metrics: loading speed (LCP), interaction response speed (INP), and visual stability (CLS). Each has thresholds for "good", "needs improvement", and "poor" values. We explore these in detail in separate articles on LCP, INP, and CLS.
What's important is where the numbers come from. They're not one-off tests but data from real Chrome users in the Chrome UX Report (CrUX). Google collects speed data as experienced by actual visitors over the past 28 days, separately for mobile and desktop.
Beware of one rule that confuses even the advanced: a group of pages is rated based on the worst metric. If a group has a poor CLS but excellent INP, the entire group is "poor". A single problem can drag the whole group into the red.
Three Levels of Speed Measurement
Speed isn't measured at just one level. It's worth distinguishing between three because each answers a different question and uses a different tool:
- Domain level indicates how the entire website performs. This data is found in PageSpeed.ONE monitoring and other tools working with CrUX.
- Page group level shows which page types are dragging the site down. This is the realm of the Core Web Vitals report in Search Console.
- Individual pages are addressed when you need to fine-tune a single URL. This is done with the web speed test (Insights) or the CrUX API.
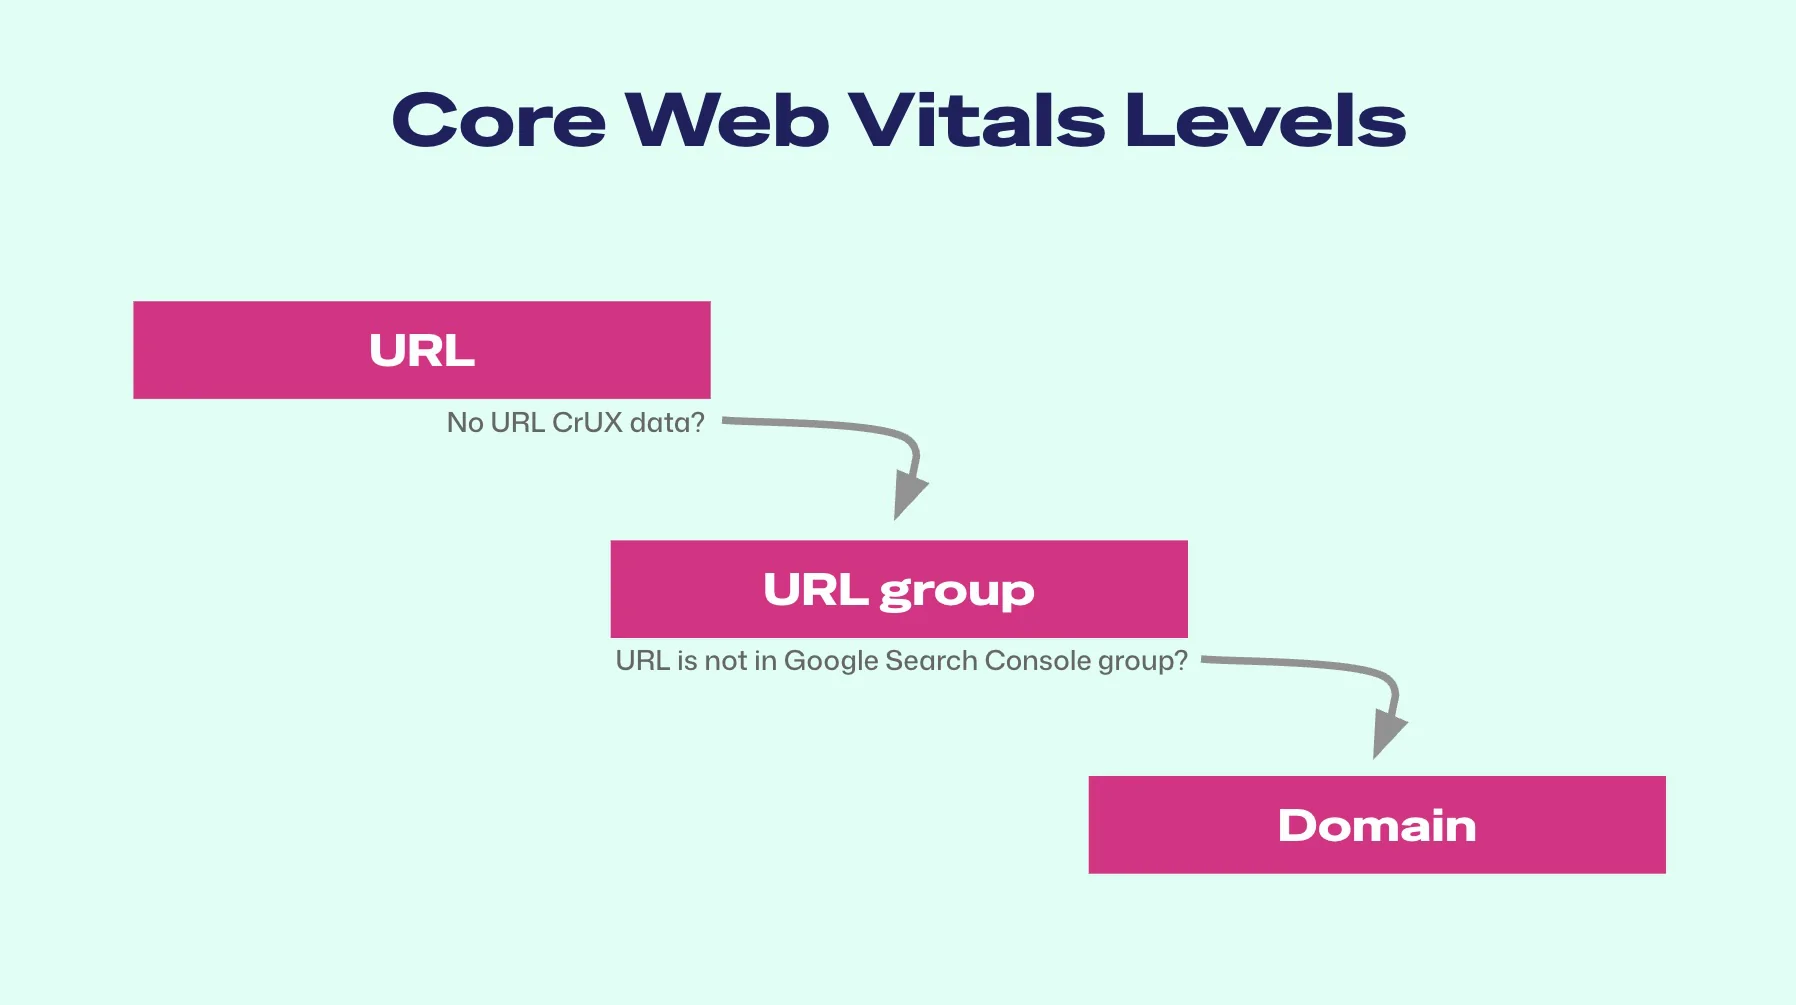 Three levels of web speed measurement. Search Console mainly covers the middle level, i.e., page groups.
We discuss each level and where to obtain data in more detail below.
Principles: How Data is Assigned
Google doesn't assign speed to all pages equally. It works in steps:
- If a specific page has enough traffic, it's assessed based on its own Core Web Vitals.
- If the page lacks its own data, Google groups it with similar pages (visible in Search Console), or uses the entire domain's rating. The domain rating covers most URLs on the site, making it crucial.
- Note that even a domain may not have CrUX data. Google simply doesn't have enough measurements for new or low-traffic sites.
These principles lead to additional CrUX rules, which are only tangentially relevant here but good to know: data runs in a 28-day cumulative window, so changes manifest with delay, and for single-page applications (SPA), some metrics are measured differently. Details are in the Chrome UX Report article.
Speed Reports in Google Search Console
Now the main part: where to find the reports and how to read them without drawing the wrong conclusions.
Core Web Vitals Report
The report is found in the left menu of Search Console under Page Experience, item Core Web Vitals. You'll see a summary divided into mobile and desktop. Always address each part separately, as mobile and desktop experiences usually differ.
Clicking on mobile or desktop takes you to the individual page groups with a problem description (e.g., "LCP longer than 2.5 s"). This is your biggest hint on what to optimize. Google also provides examples of specific URLs for each group.
Beware of the Misleading Core Web Vitals Graph
The Core Web Vitals report graph can be misleading. Non-experts might think it shows the metric's value. It doesn't. It displays the number of pages in green, orange, and red zones.
This has practical implications. Moving pages from orange to green might mean improving LCP from 2.51 s to 2.49 s, just crossing a zone boundary, but the actual speed hasn't significantly changed. Conversely, a large graph jump doesn't necessarily mean a big jump in perceived speed.
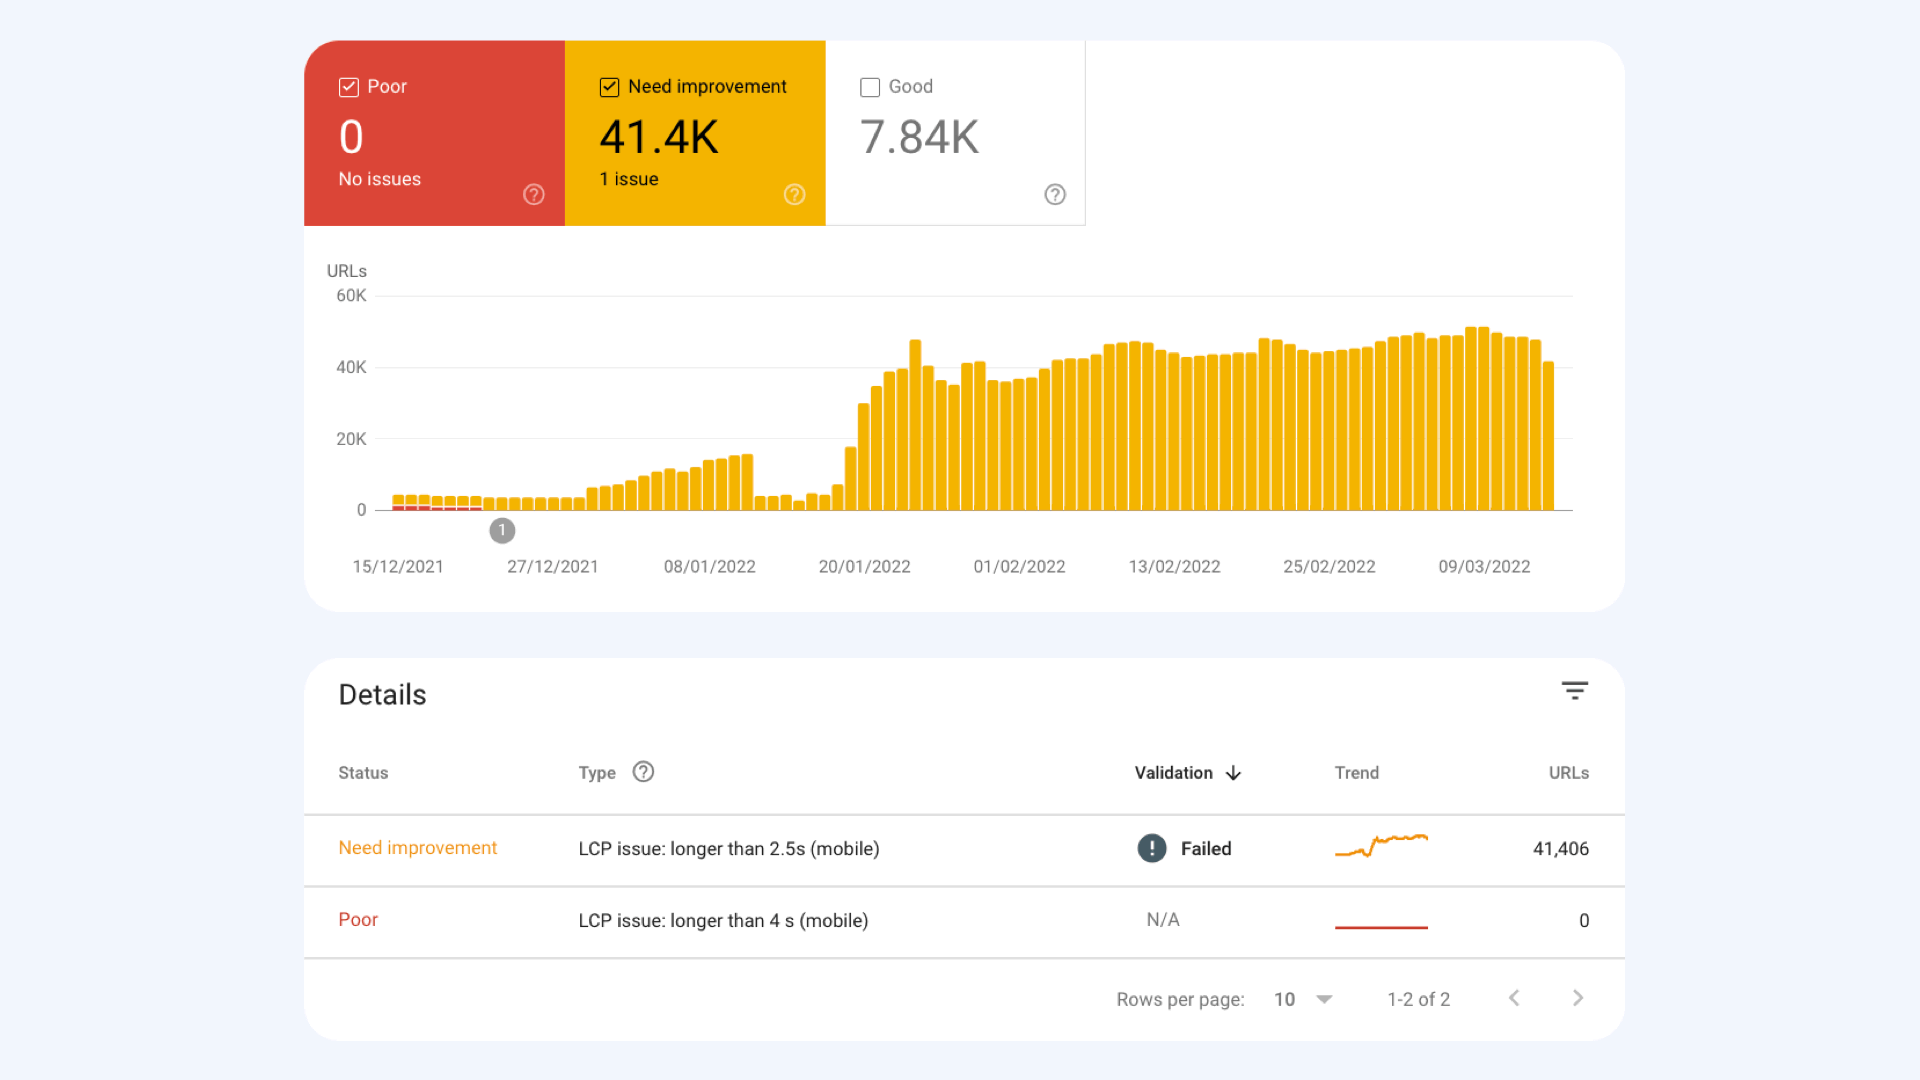 The report in Search Console shows how many URLs fall into the "needs improvement" zone, not the domain's average metric value.
How should you read it correctly? Monitor the share of orange and red pages. If more than 10% of URLs are orange or red, address it to avoid losing points with Google.
Backend Response Report
The second important report is hidden and again somewhat misleading. Find it under Settings in the Crawl stats section, where Google reports the average server response time. It's essentially TTFB, the time before the server starts responding. Though tucked away, it's crucial for two reasons.
Firstly, server response directly affects Core Web Vitals metrics. A slow backend delays loading, impacting LCP in particular. Secondly, it influences the so-called Crawl Budget, meaning how many pages and how often Google is willing to crawl. The slower the server, the less Google can process. The concept and recommendations are detailed in Google's Crawl Budget documentation.
How to interpret response time?
- If it's consistently over 0.8 s, address it with infrastructure, developers, or experts.
- If spikes to worse numbers correlate with traffic, strengthen infrastructure as your server can't keep up with peak loads.
- If spikes don't correlate with traffic, bots might be to blame. Increasingly, these are AI bots, for which we have an AI Bots Strategy.
How to Measure Speed with Google Search Console
Search Console is a great piece of the puzzle, but it's not sufficient on its own. Let's go through what to extract from it and what to complement it with.
You Need Domain Data
The domain view, i.e., how the entire website's speed fares over time, isn't well-handled by Search Console. You need this elsewhere, in monitoring. Three things are key: alerts, long-term measurement with data history, and debugging information for developers.
In PageSpeed.ONE, Domain Report provides complete CrUX data. You'll see progress over days and months and debugging data like LCP breakdown into parts. Plus, a free trial version, Watchdog, that alerts you to deteriorations, and other features. This is precisely the part Search Console doesn't cover, which is why standalone monitoring is essential for serious speed work.
Speed Monitoring PLUS
Try our monitoring app free for a month.
5,400 CZK annually per website. Invoice only, no credit card needed.
For one-off status checks, PageSpeed.ONE web speed test or Google's PageSpeed Insights suffice. They're good for quick checks, not for tracking progress over time.
Individual URLs
We recommend addressing specific URLs only for truly important pages, typically the homepage, or for websites where domain and group data (see below) are already in order. There's no point in fine-tuning one page while entire groups are broken.
You Need Page Groups
Page groups are the domain of Search Console, not available elsewhere in such a neat package. Work with the two reports described above: the Core Web Vitals report and the backend response report. The first tells you which page types are problematic, the second reveals a slow server.
Fixed a Problem but It's Still Haunting You in Google Search Console?
Search Console often lags and isn't perfectly accurate, so fixes might not show immediately. Don't panic. After addressing issues, you can click the Start Tracking button in the Core Web Vitals report. A 28-day monitoring window will automatically verify if the fix worked. URL statuses will show as Pending, Passed, or Failed.
What Does "No data available" Mean?
Sometimes you'll encounter "No data available" in a report. This means one of two things: either the property in Search Console is new and Google has nothing to show, or the website has low traffic and lacks CrUX data. In both cases, supplement the domain view with synthetic measurements in monitoring.
Practical Checklists
Finally, two lists to guide you in practice.
What to Do Regularly
- Monitor domain performance. The domain view of speed gives the quickest overview of the entire website's status. Ideally from a tool that alerts you automatically.
- Monitor page groups in Search Console. Here you'll see which page types are dragging the rating down and where to start with fixes.
- Look for impacts on SEO and PPC. Relate speed improvements or degradations to data from the Performance report in Search Console. See if it reflects in rankings and clicks.
- Choose the right frequency. Small websites can be checked monthly, large websites weekly or even daily. The ideal state is when tools report themselves: PageSpeed.ONE monitoring does, but you need to check Search Console manually.
What to Do When a Group in Core Web Vitals is Orange or Red
- Prioritize it. These are URLs receiving lower ratings. Find specific page examples in the group, Search Console will offer them.
- Monitor these URLs. Keep them under watch to see progress, not just a snapshot.
- Look at debugging data. Combine synthetic measurements and CrUX debugging data to know precisely what's causing metric issues.
- Test the page in a browser. How to do this is described in the article on Web Vitals in the Browser.
- Refer to our guides. For problematic metrics, check optimizations for LCP, INP, or CLS. Quick start: for LCP, address image size and format and server response, for INP unnecessary JavaScript and third-party code, for CLS always specify image dimensions and reserve space for later-loading elements.
- Need help? Contact experts. We can assist with optimization and data interpretation as part of our services.
- After fixing, start tracking. In the Core Web Vitals reports, initiate tracking and let Google verify the fix.