Measuring Website Speed: From Domain to Competitors to Page Types
 Martin Michálek11/6/20265 minutes reading
Curious about your website's true performance? One test on PageSpeed Insights won't suffice. A comprehensive evaluation draws from three layers: the domain's performance for real users, how you stack up against competitors, and which templates or sections drag your scores down.
We use this approach in speed analyses for clients. Below, it's laid out so you can tackle it yourself—with links to deeper articles if you need more details.
What You Need
- An overview of Core Web Vitals metrics and why addressing speed matters.
- Basic understanding of types of measurement: Google user data (CrUX), synthetic data, and possibly Real User Monitoring.
- Access to Google Search Console for your site, if verified.
- A tool with CrUX data over time and domain comparison capabilities—such as our PageSpeed.ONE monitoring or a one-time speed test.
Step 1: Domain and Core Web Vitals from Users
Start with origin data from the Chrome UX Report, which aggregates data for the entire domain. Google uses these metrics to evaluate your site in search results and ads.
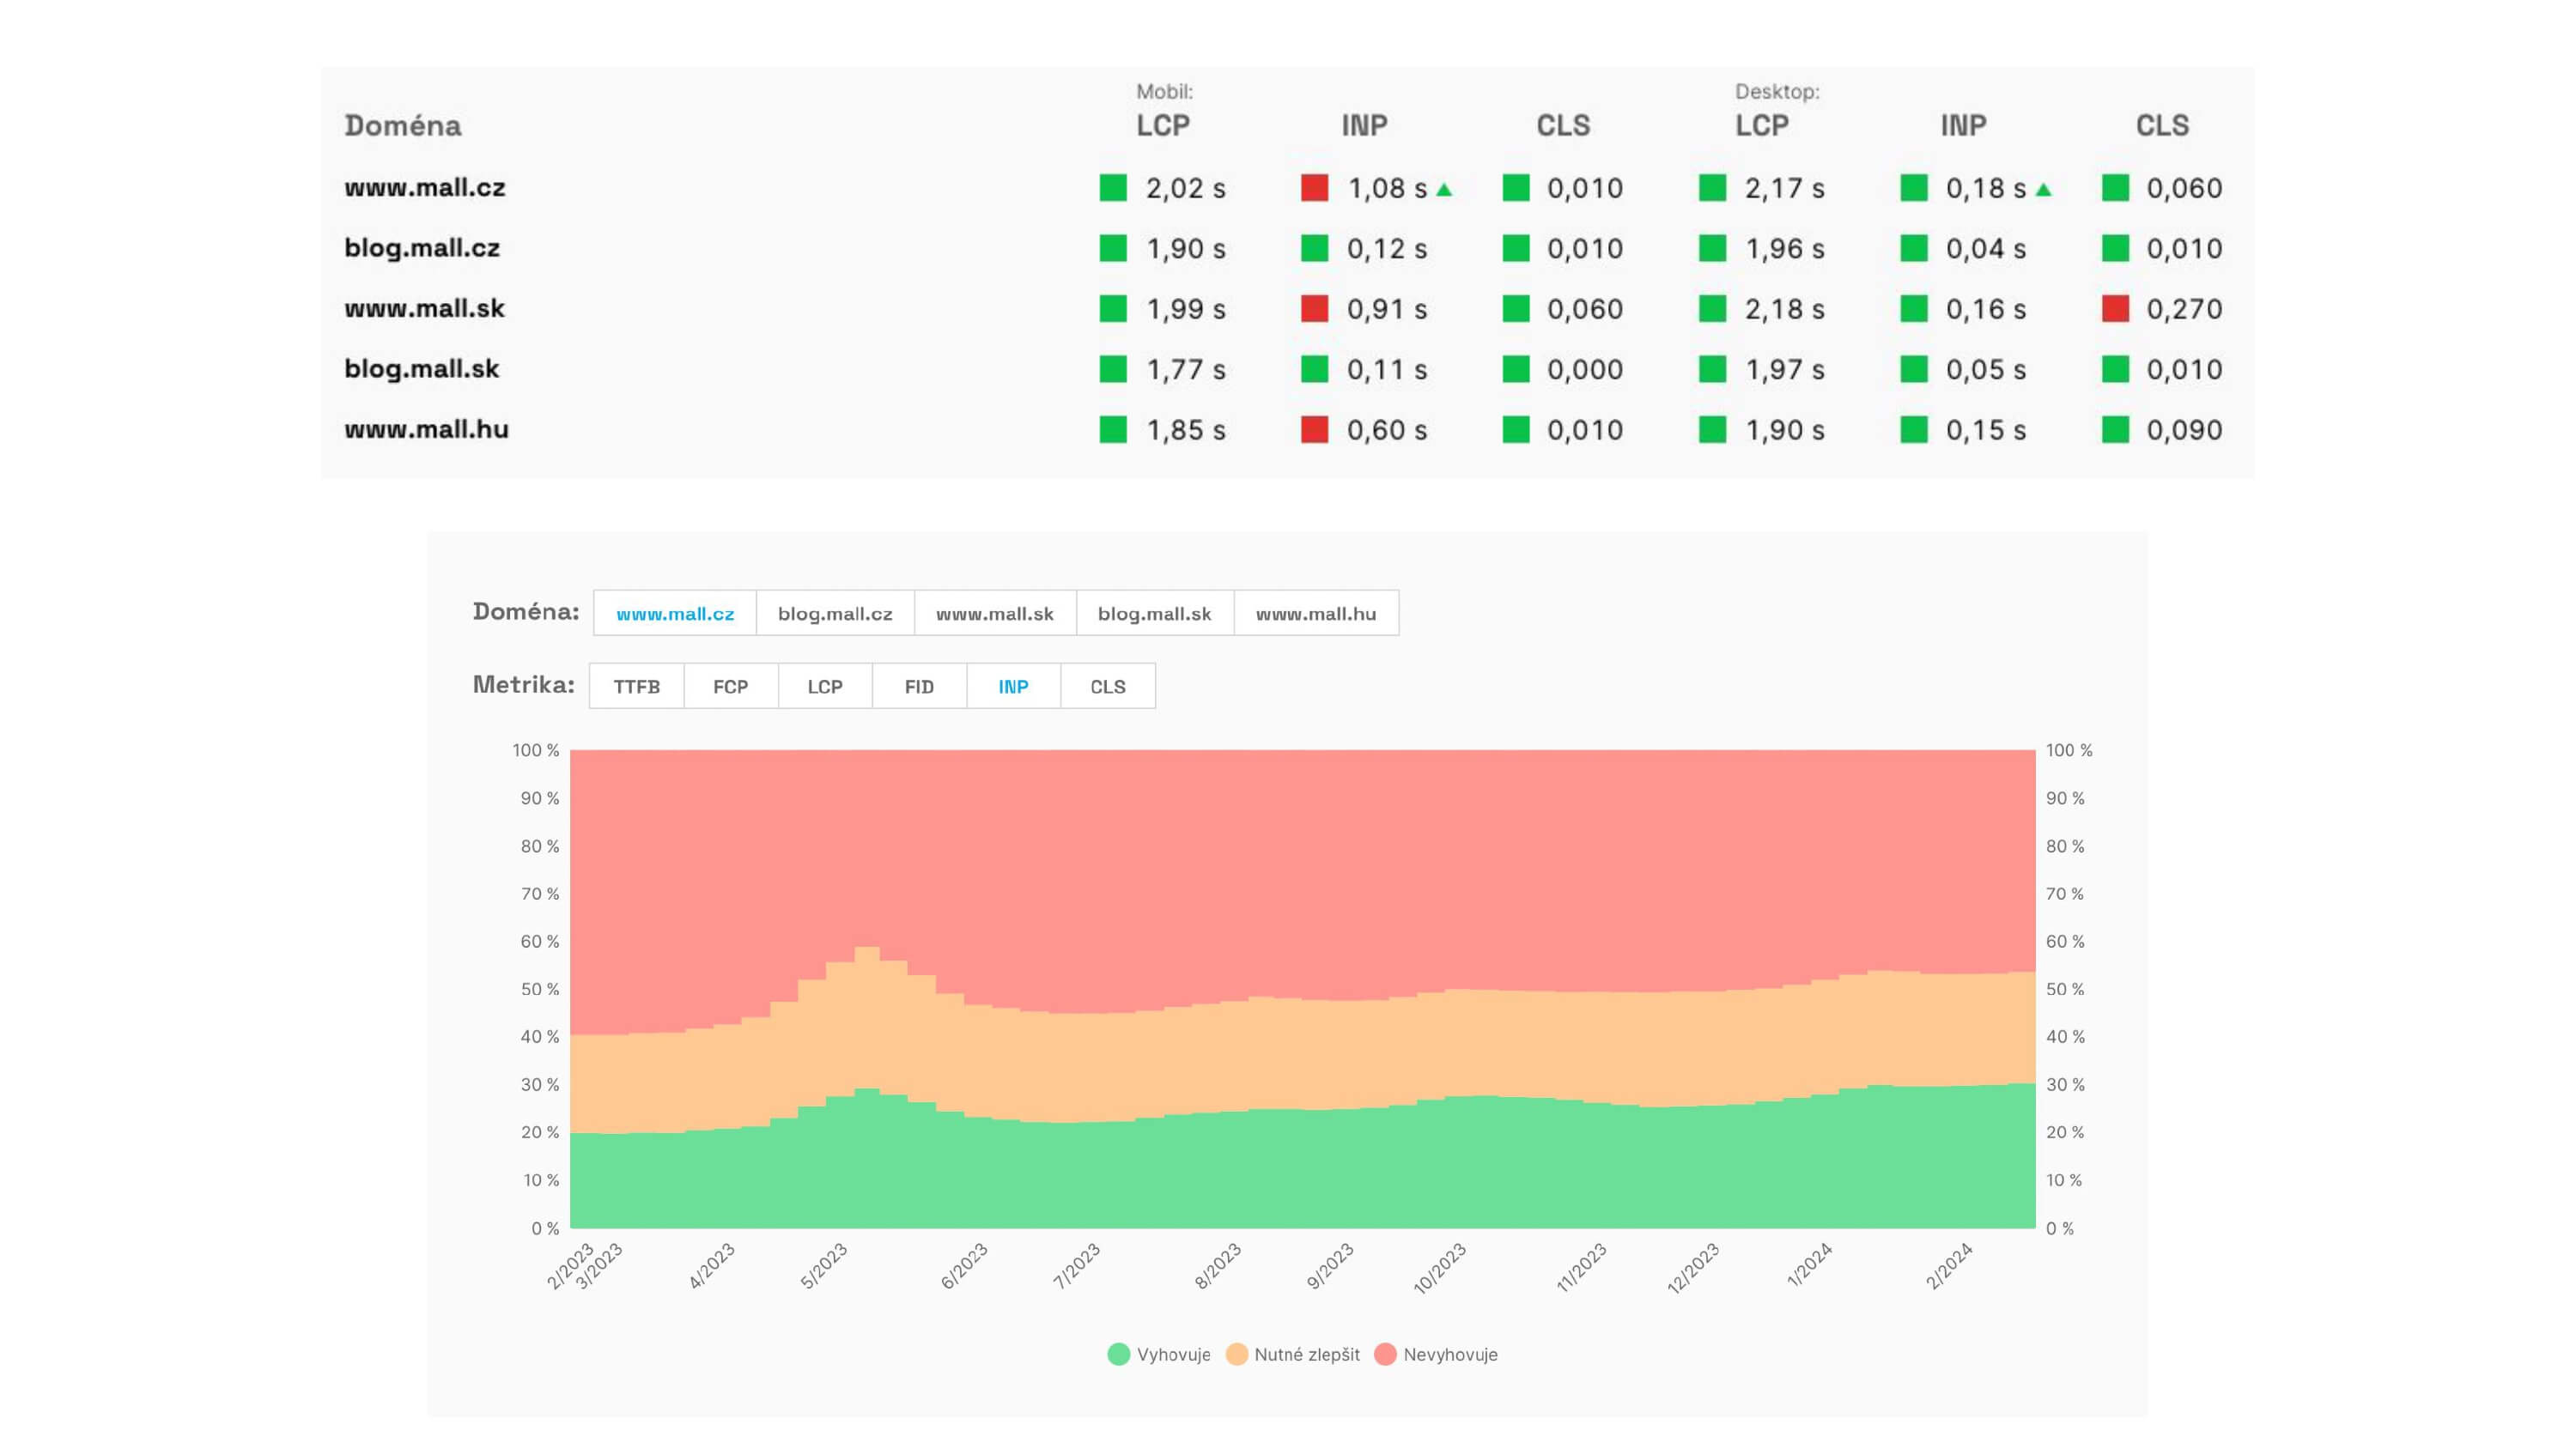 Domain-level view of Core Web Vitals from real users—a foundation for any website speed measurement.
Clarify for each device (mobile and desktop separately):
- Largest Contentful Paint — the loading speed of the main content (LCP).
- Interaction to Next Paint — response time to interactions (INP).
- Cumulative Layout Shift — layout stability (CLS).
CrUX works with the 75th percentile over the last 28 days. The “good / needs improvement / poor” color codes are familiar from PageSpeed Insights and our reports. Key rule: Google evaluates your site based on the worst metric and the worst device. An orange INP on mobile can overshadow a green LCP and CLS.
CrUX data isn't daily—changes take weeks to reflect. For daily monitoring and alerts, supplement with synthetic measurement; but for assessing “how Google sees us,” CrUX remains the authority.
Step 2: Competitor Comparison
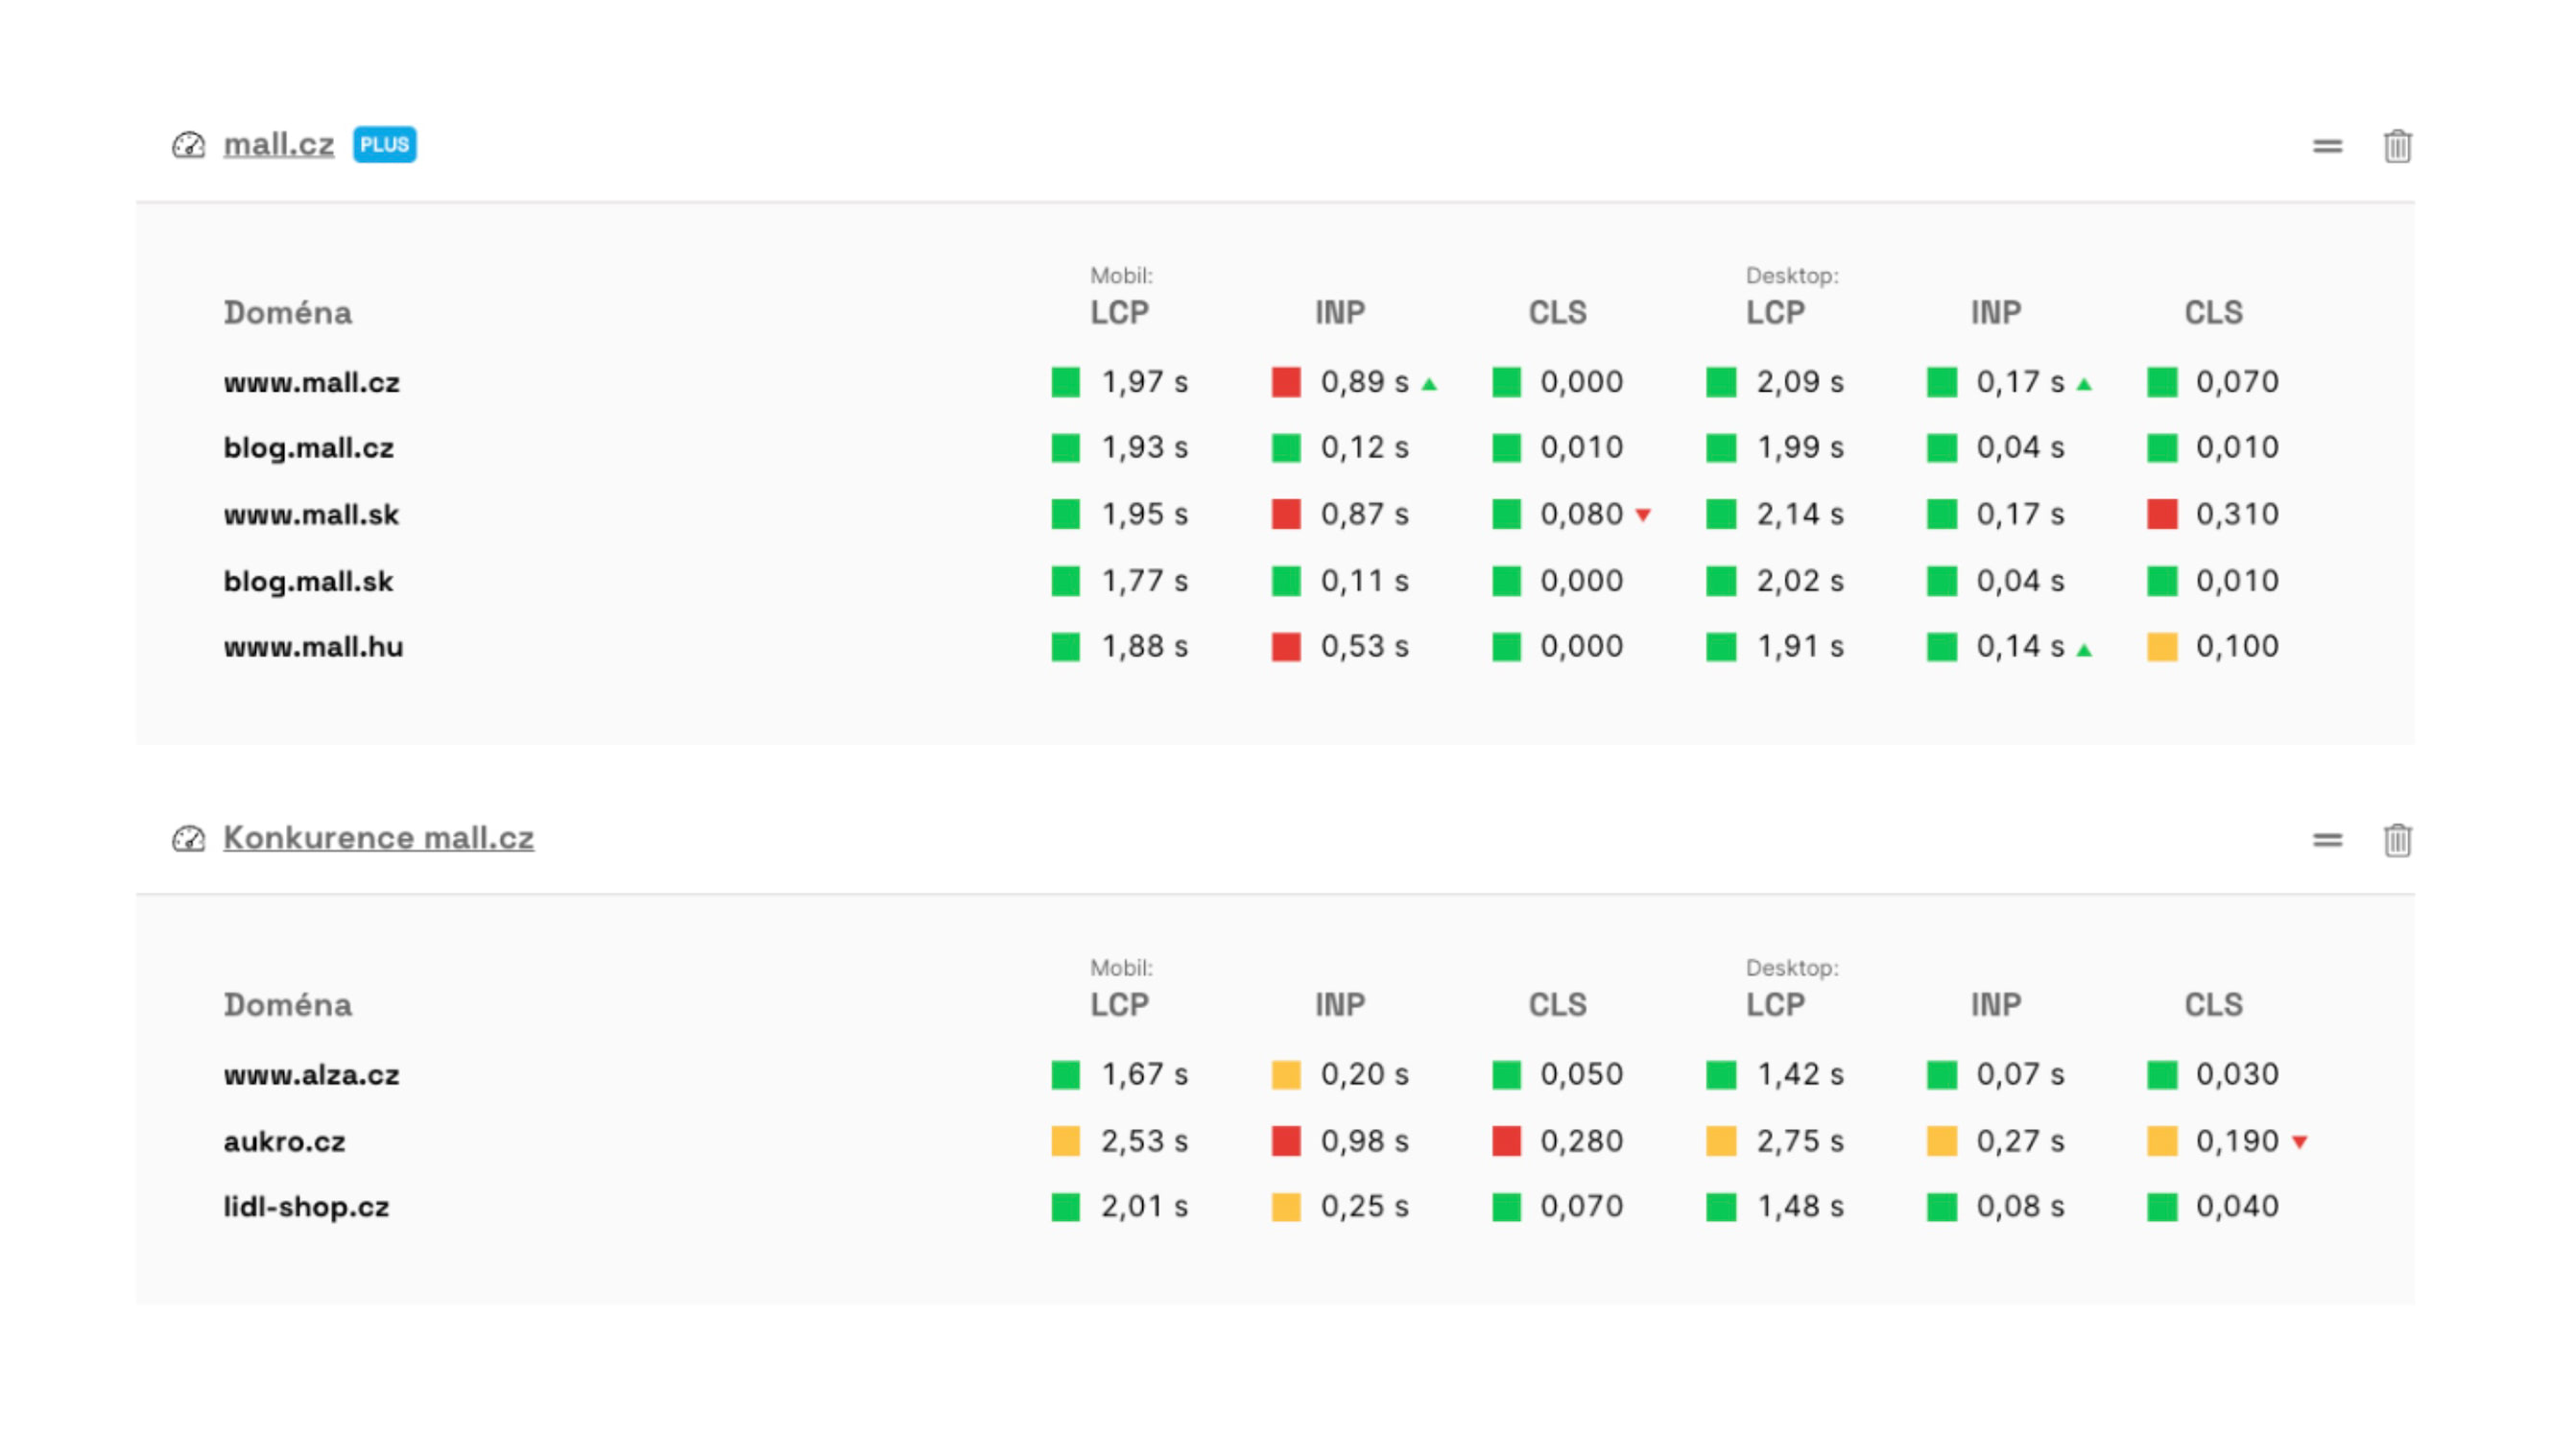
Compare these same metrics with 2–4 domains that make sense for you: direct competitors, industry leaders, or sites you aspire to emulate.
 In one overview, see the state of metrics for your domain and the competitors you track.
What to look for:
- Overall rating — who is in the green, orange, or red zone on mobile and desktop.
- Weakness vs. strength — you might excel in CLS but lag in INP; this determines optimization priorities.
- Traffic context — a smaller site may have less CrUX data than a large competitor; missing data doesn't mean “we're faster.”
Comparison isn't a race for a single number. It's about whether you're acceptably fast to Google and users relative to the market and where you have the most room for improvement.
Step 3: Page Types in Google Search Console
The domain might be all green, yet entire groups of URLs could be problematic—such as an e-commerce category, product detail, blog, or campaign landing pages.
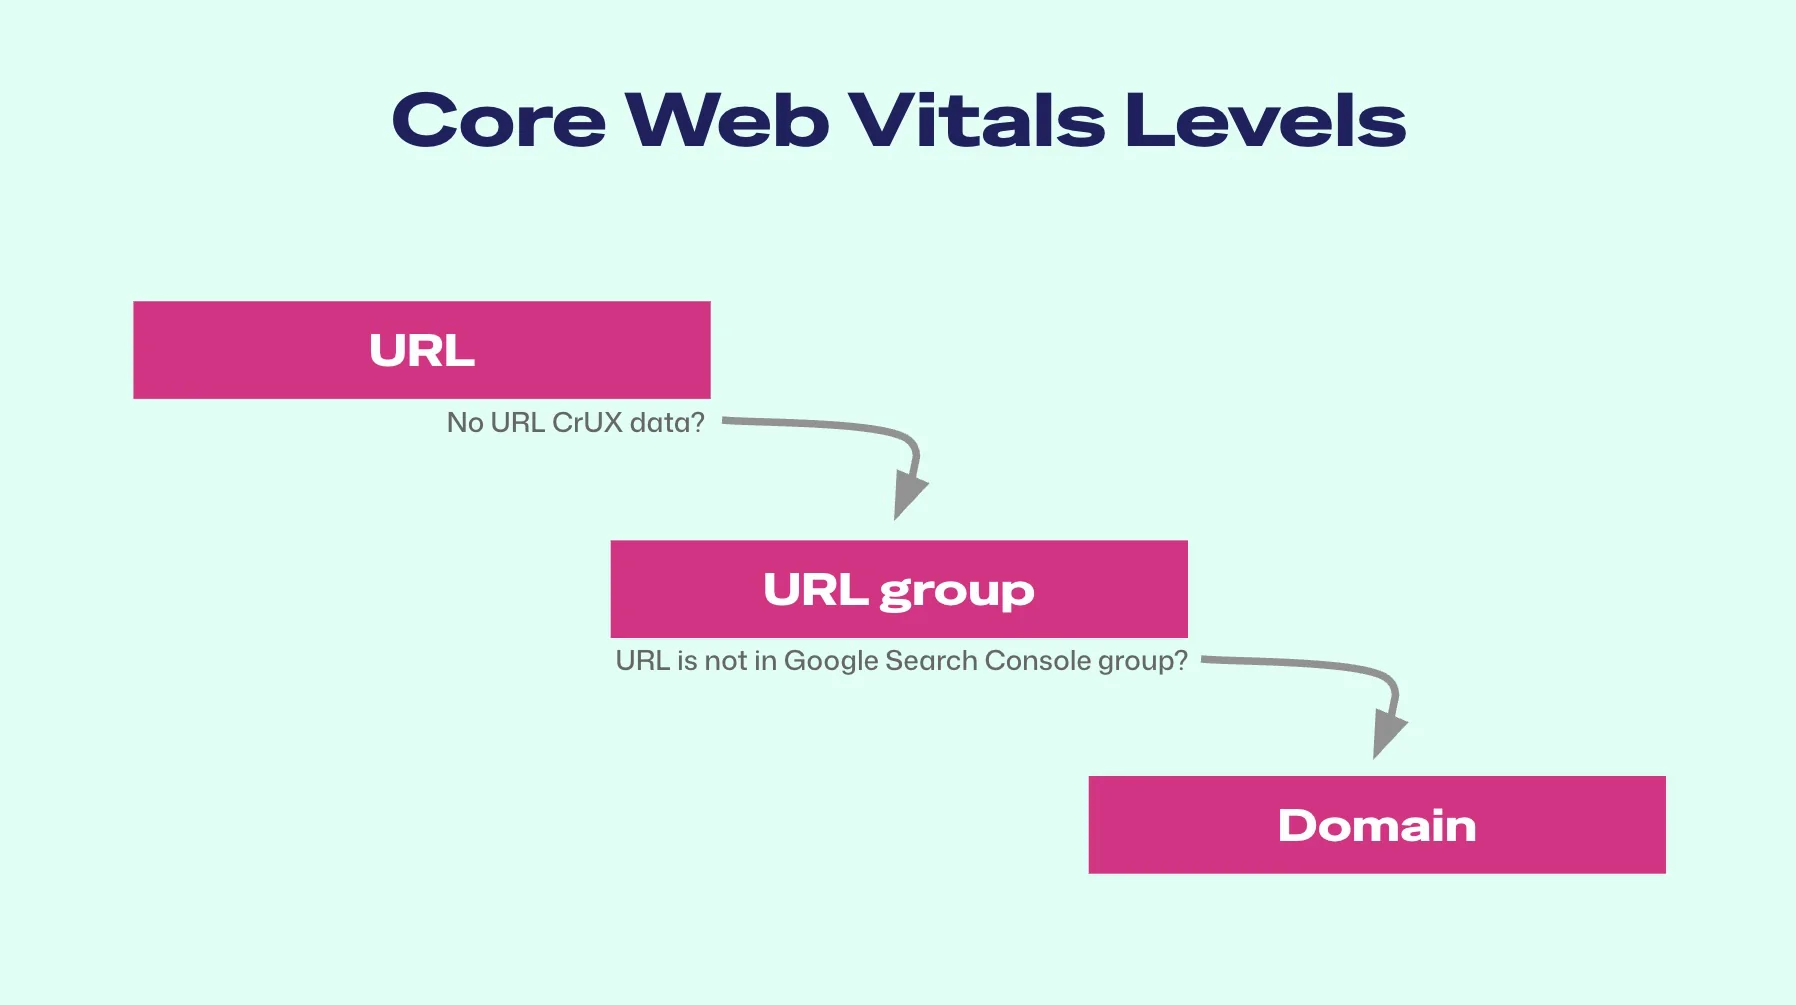 Search Console mainly covers page groups—template types that often reveal hidden issues in audits.
In Search Console, open the Core Web Vitals report (Page Experience → Core Web Vitals) and work separately with mobile and desktop. You'll see:
- how many URLs are in good condition, need improvement, or have poor results;
- groups of similar pages with a specific problematic metric (e.g., slow INP on category listings).
A detailed guide to interpreting these reports is in the article Google Search Console and Core Web Vitals. Search Console can't replace domain-level monitoring over time—it complements it by showing where on the site the issue recurs.
Typical scenarios:
- Domain is fine, mobile groups in red → systemic issue with the mobile template.
- Poor rating only for one metric in a group → focus optimization (LCP, INP, or CLS).
Step 4: Synthetic for Detail and Daily Work
CrUX and Search Console won't tell you why a metric is bad. For that, use synthetic tests (Lighthouse) in monitoring:
 Synthetic complements CrUX with daily tests and developer material—traces, HAR, or specific opportunities for improvement.
- monitor LCP and CLS in synthetic tests daily;
- for interactions, use Total Blocking Time instead of INP in synthetic analysis;
- don't use Lighthouse scores as the sole “speed rating”—for business and SEO, Core Web Vitals from CrUX are decisive.
After identifying problematic groups in GSC, add representative URLs to monitoring and track progress post-fix.
Step 5: What to Do Next
Measurement reveals the problem—this step unites priorities, tools, and team into the next phase of work.
 Continuous measurement and test overview are fundamental—without them, step 5 quickly circles back to the beginning.
- Prioritize — worst metric × biggest business impact (homepage, checkout, main categories).
- Set up continuous measurement — monitoring and performance budgets to prevent the site from slowing again after fixes.
- Engage the team — developers implement, management maintains priority; see Performance Culture.
- Verify in GSC after fixes — use Start Tracking for problematic groups.
Need a quick first assessment without tool setup? See CrUX and synthetic data for selected URLs, including comparison with other domains, in the test below.
Measure your website speed
The website speed test shows you the results straight away.