Common Mistakes That Ruin Web Vitals

Under the banner of the PageSpeed.ONE project, I've conducted dozens of speed audits and smaller analyses for websites of varying sizes. I've decided to review all these analyses to identify the most frequent mistakes that recur in our audits and spoil Core Web Vitals metrics.
You can watch the recorded talk on the Frontendisti YouTube channel. If you prefer reading, dive into today's article below.
Contents
- Web Vitals in a Nutshell
- How to Measure Your Website's Speed?
- FID – A JavaScript Metric Hardly Needing Optimization
- LCP – Probably the Most Crucial and My Favourite Metric
- CLS – A Metric Full of Misunderstandings
Web Vitals in a Nutshell
Website speed is an ever-expanding and complex topic, where one can easily get lost. And then there are the Web Vitals. What are they, and why should we care?
Web Vitals are metrics from Google intended to become one of the ranking criteria for search results. Further details about Google Page Experience merit a separate article, so if you're curious about this update, I’ll point you to Martin Michálek's blog post on Google Page Experience.
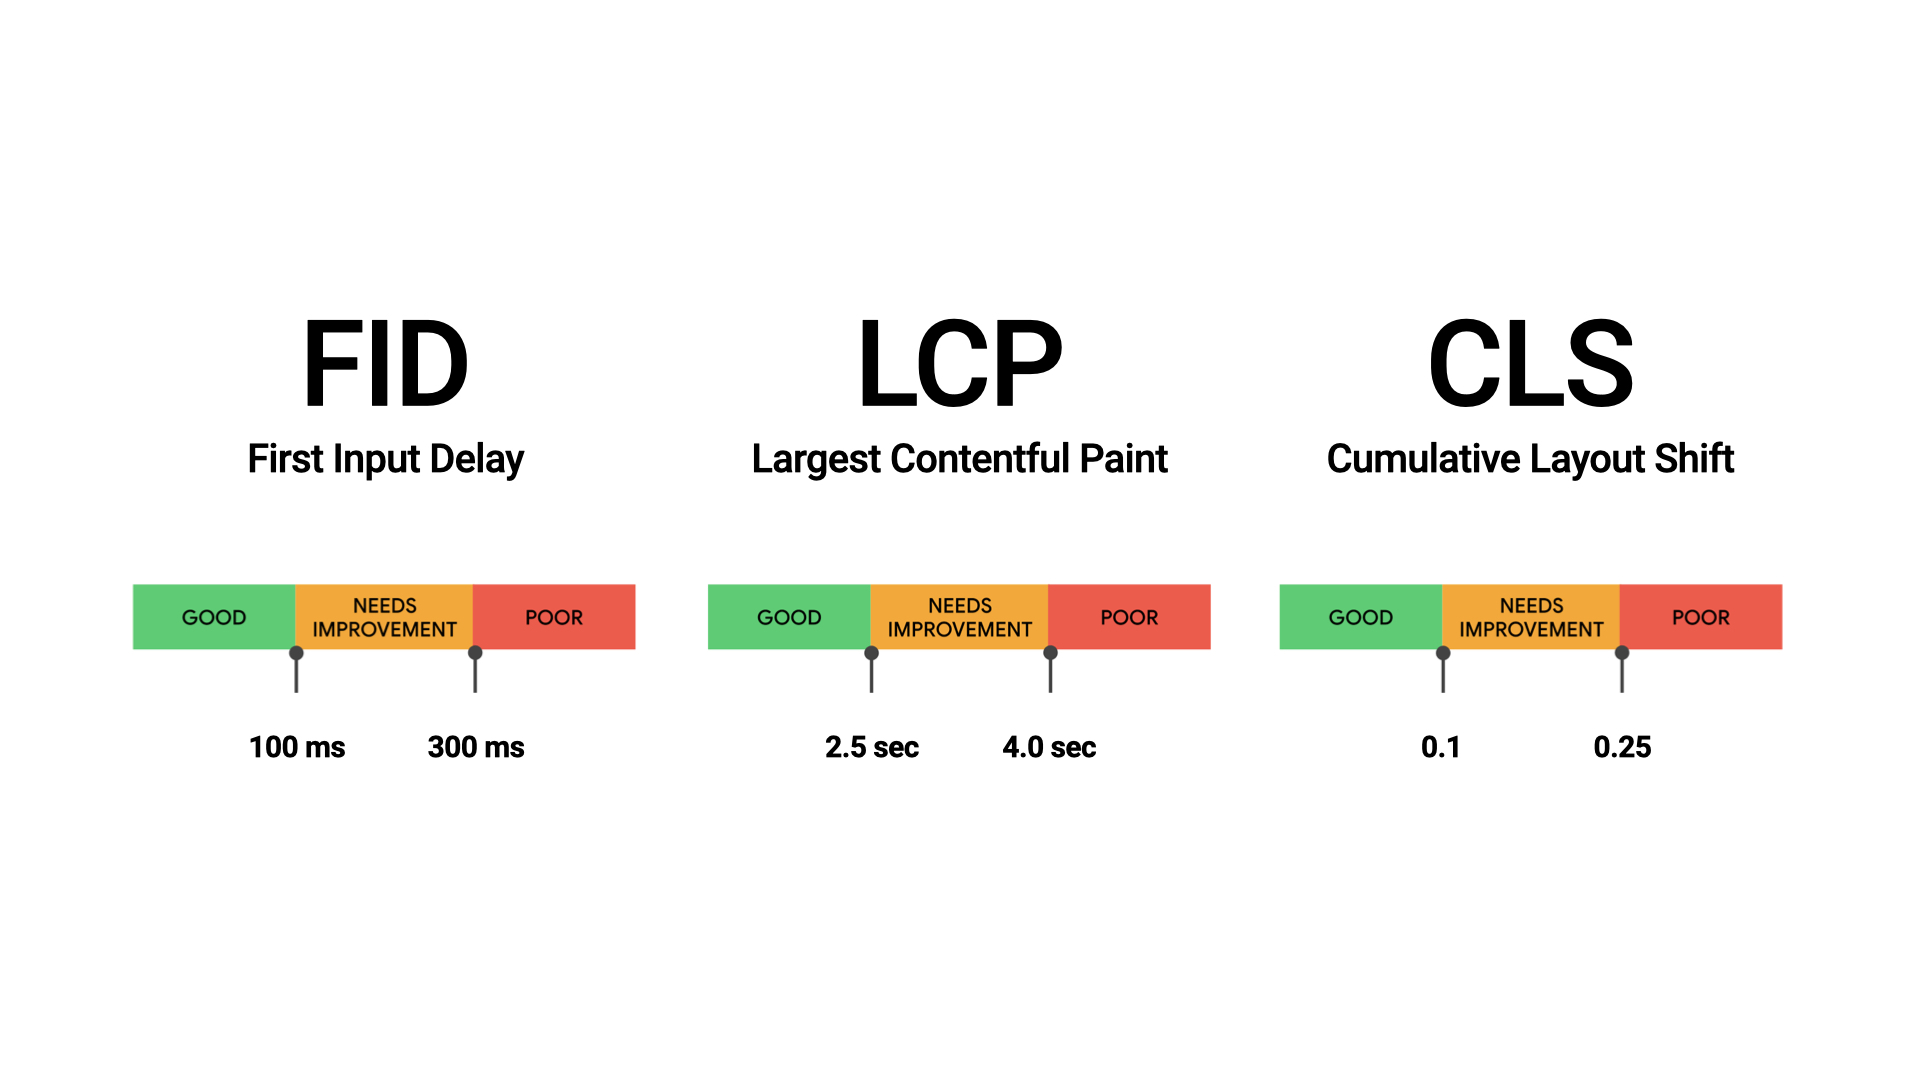
Now, a quick glance at Web Vitals. There are three core metrics: First Input Delay (FID), Largest Contentful Paint (LCP), and Cumulative Layout Shift (CLS). Each metric has recommended values, visible in the image.
But we still don't know how to measure Web Vitals.
How to Measure Your Website's Speed?
There are many options. One tool is Google Data Studio, where you can create reports with individual metric results. Unfortunately, working with Data Studio can often be complicated and time-consuming.
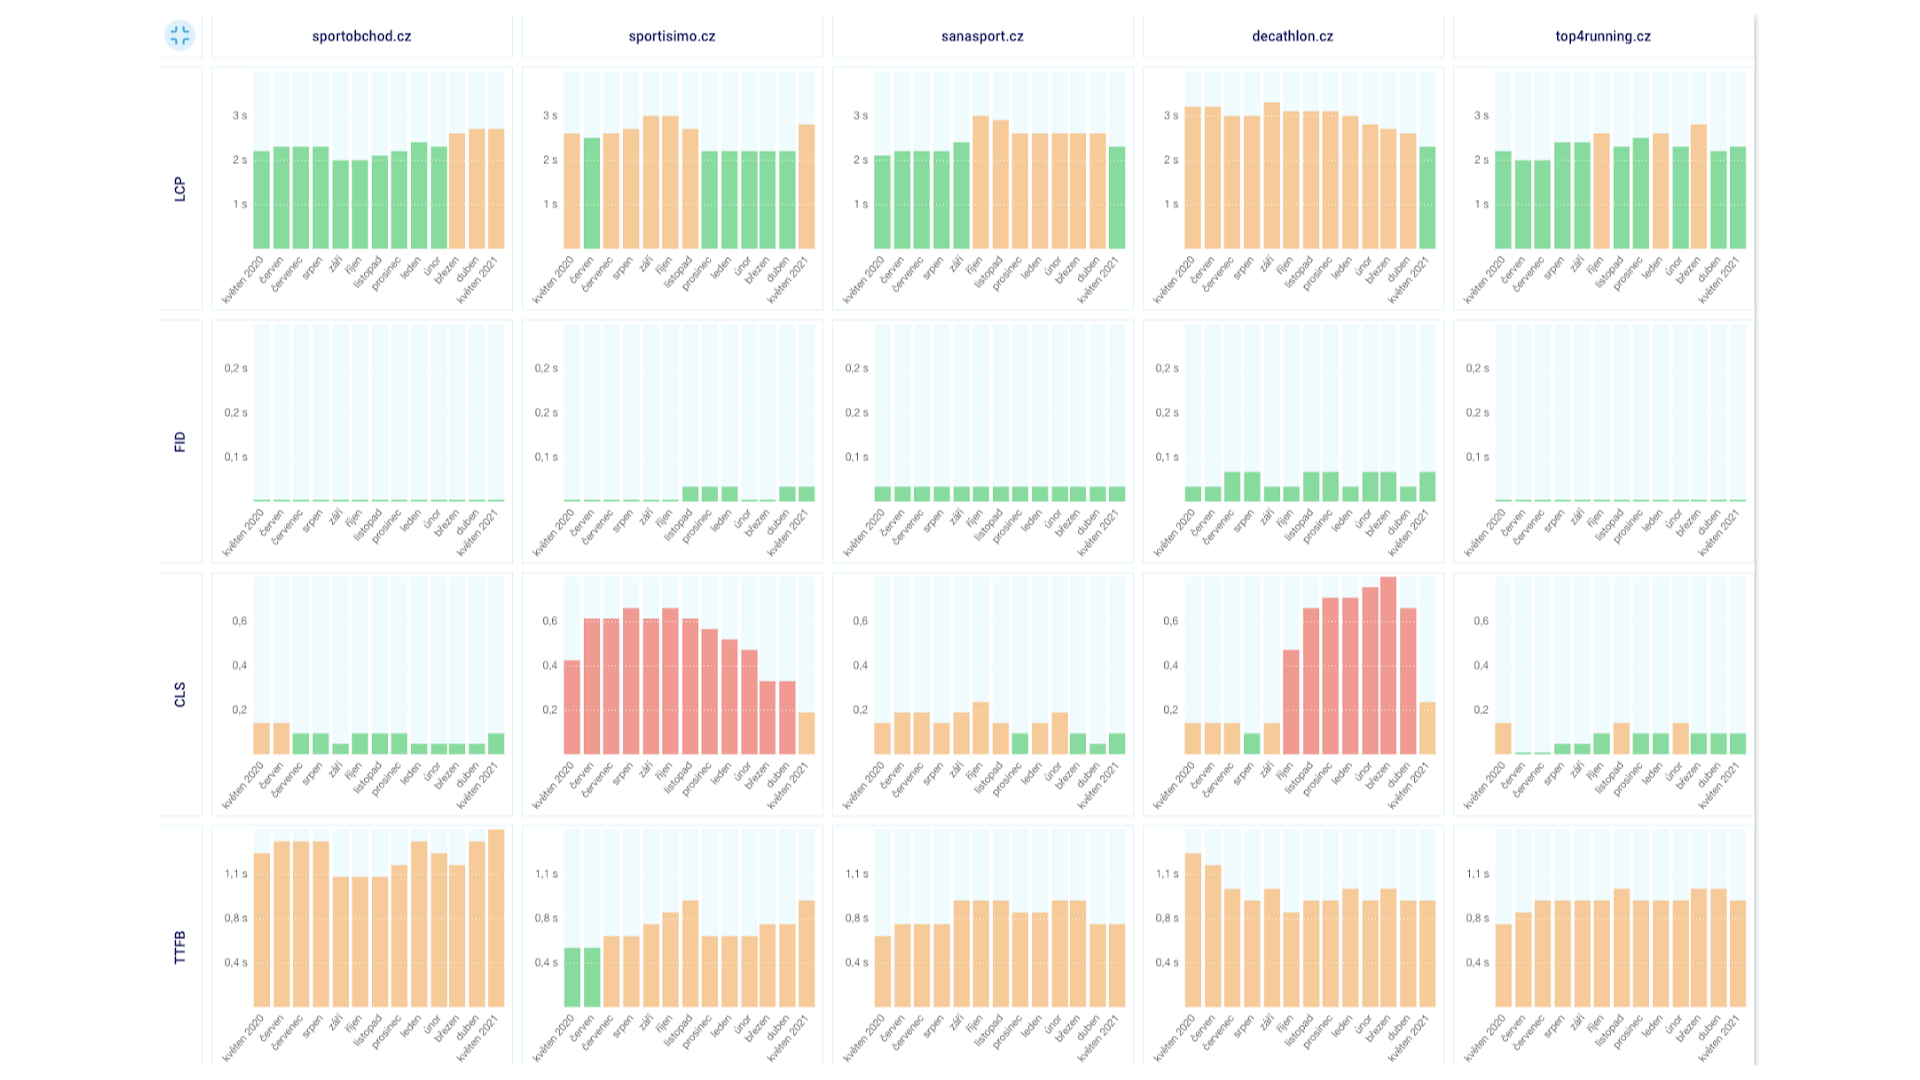
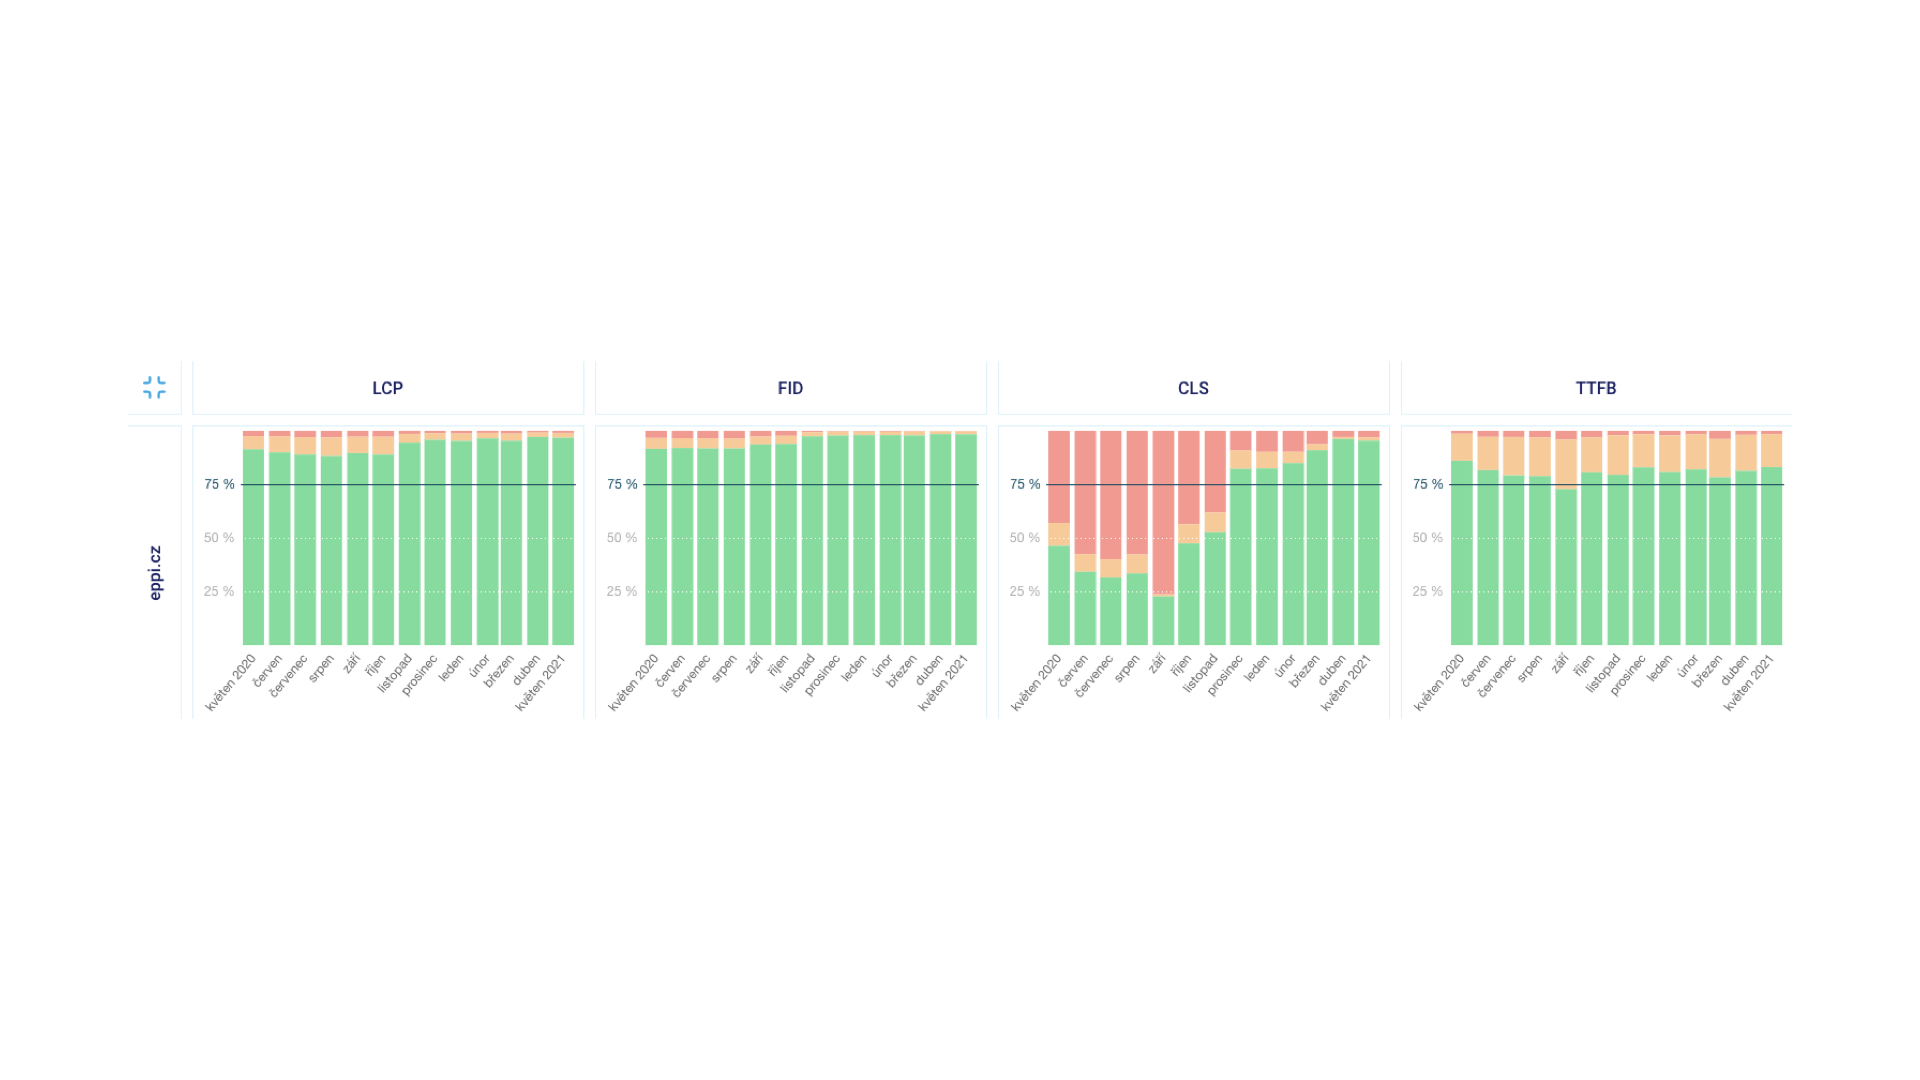
Web Vitals can also be displayed by PageSpeed Insights, but the data there is quite limited and simplified. At PageSpeed.ONE, we addressed this with the tester 2.0 update, offering a comprehensive overview of user data – easily and clearly.
If you've just entered your website addresses into the tester and aren’t thrilled with the results, I have good news. Many errors occur on nearly every site, so let's explore what you should be looking for.
FID – First Input Delay
Let's start with the First Input Delay metric. Despite its name, it concerns JavaScript, measuring the time from a user's first interaction with a page to the browser's processing of that interaction.
FID hasn't required significant attention yet, as it seems to be a forgiving metric. Its threshold for a good rating is 100 ms, which websites generally manage to achieve.
A similar JS metric is Total Blocking Time (TBT), which Google links to FID. However, in practice, we've found that a poor TBT doesn't necessarily mean a poor FID score. Yet, optimizing TBT often enhances the FID metric.
Here's an example of flawed JavaScript metrics. The first half of the screen below shows a page measurement result where a YouTube video in an iframe, a known metric killer for TBT and Time to Interactive (TTI), wreaks havoc. The metrics are high because YouTube downloads large CSS and JS files.
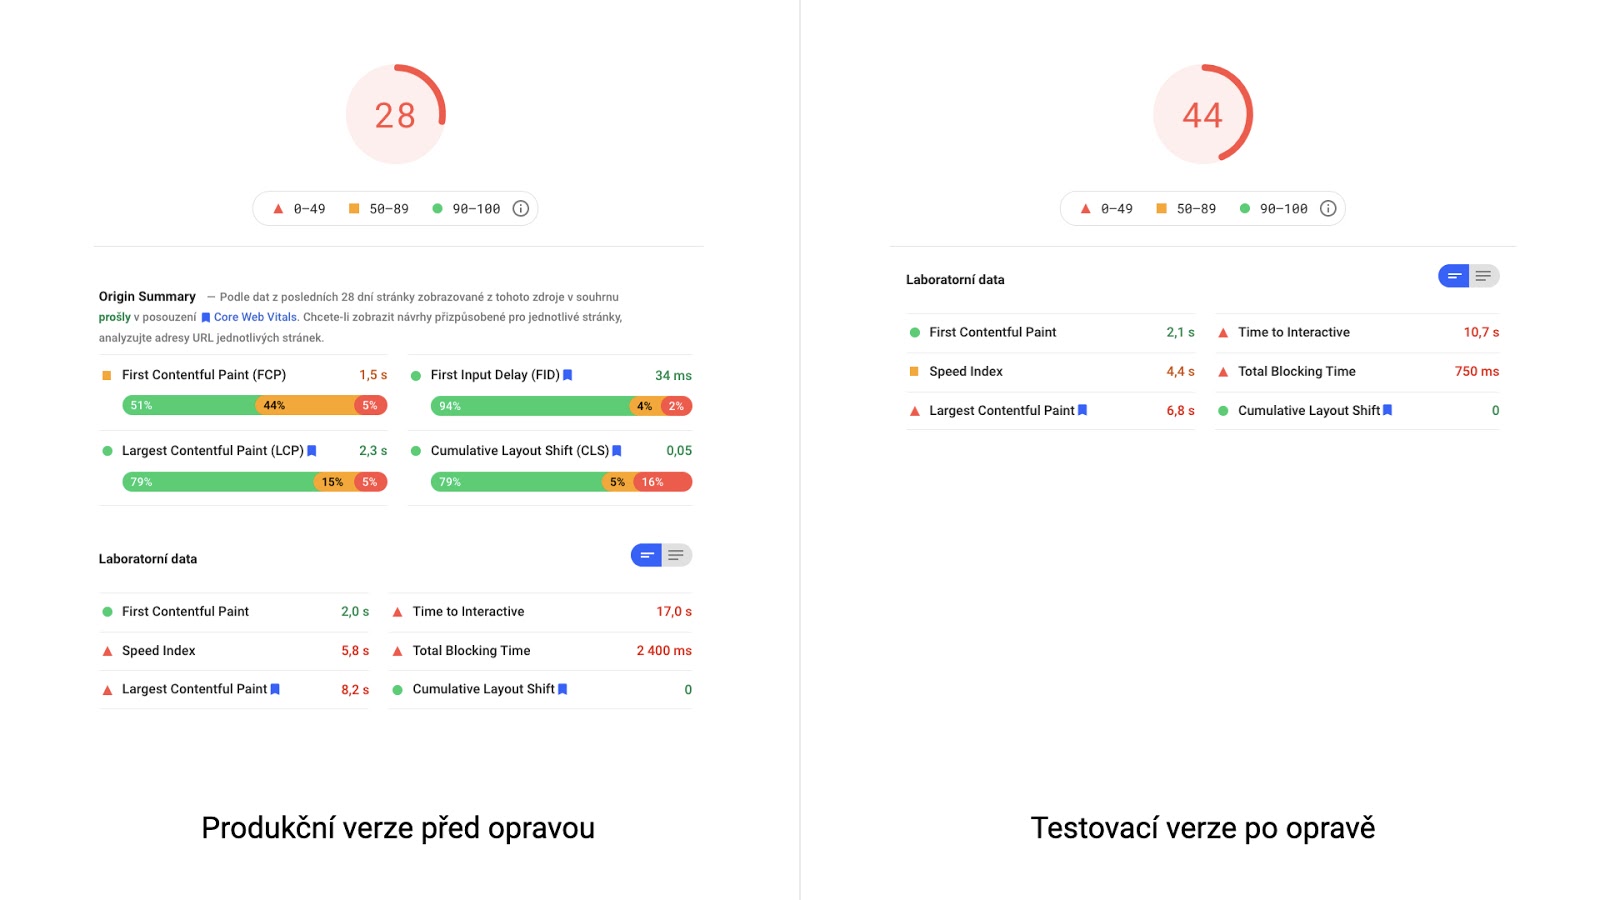
Solutions for better metrics? For YT embedded via iframe, either use native lazyloading or Youtube Lite Embed.
LCP – Largest Contentful Paint
My favourite metric is Largest Contentful Paint. It's my favourite because it's comprehensive. To optimize it, you need to master many areas during loading. It thoroughly tests coders' knowledge in the loading process and allows us to measure the rendering of the largest element on the page.
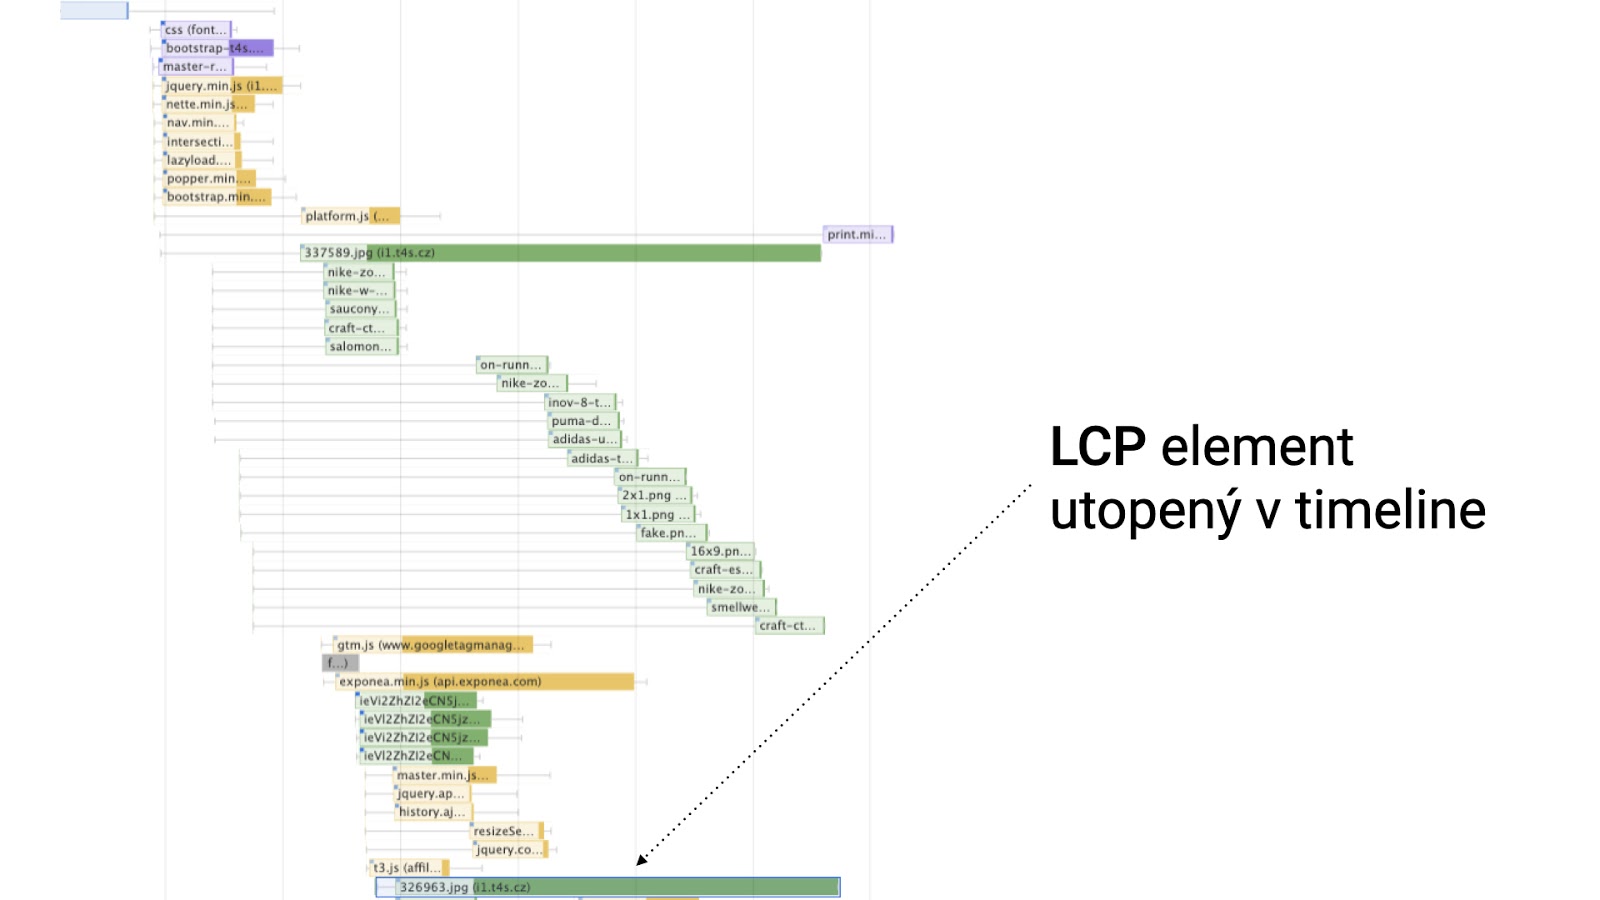
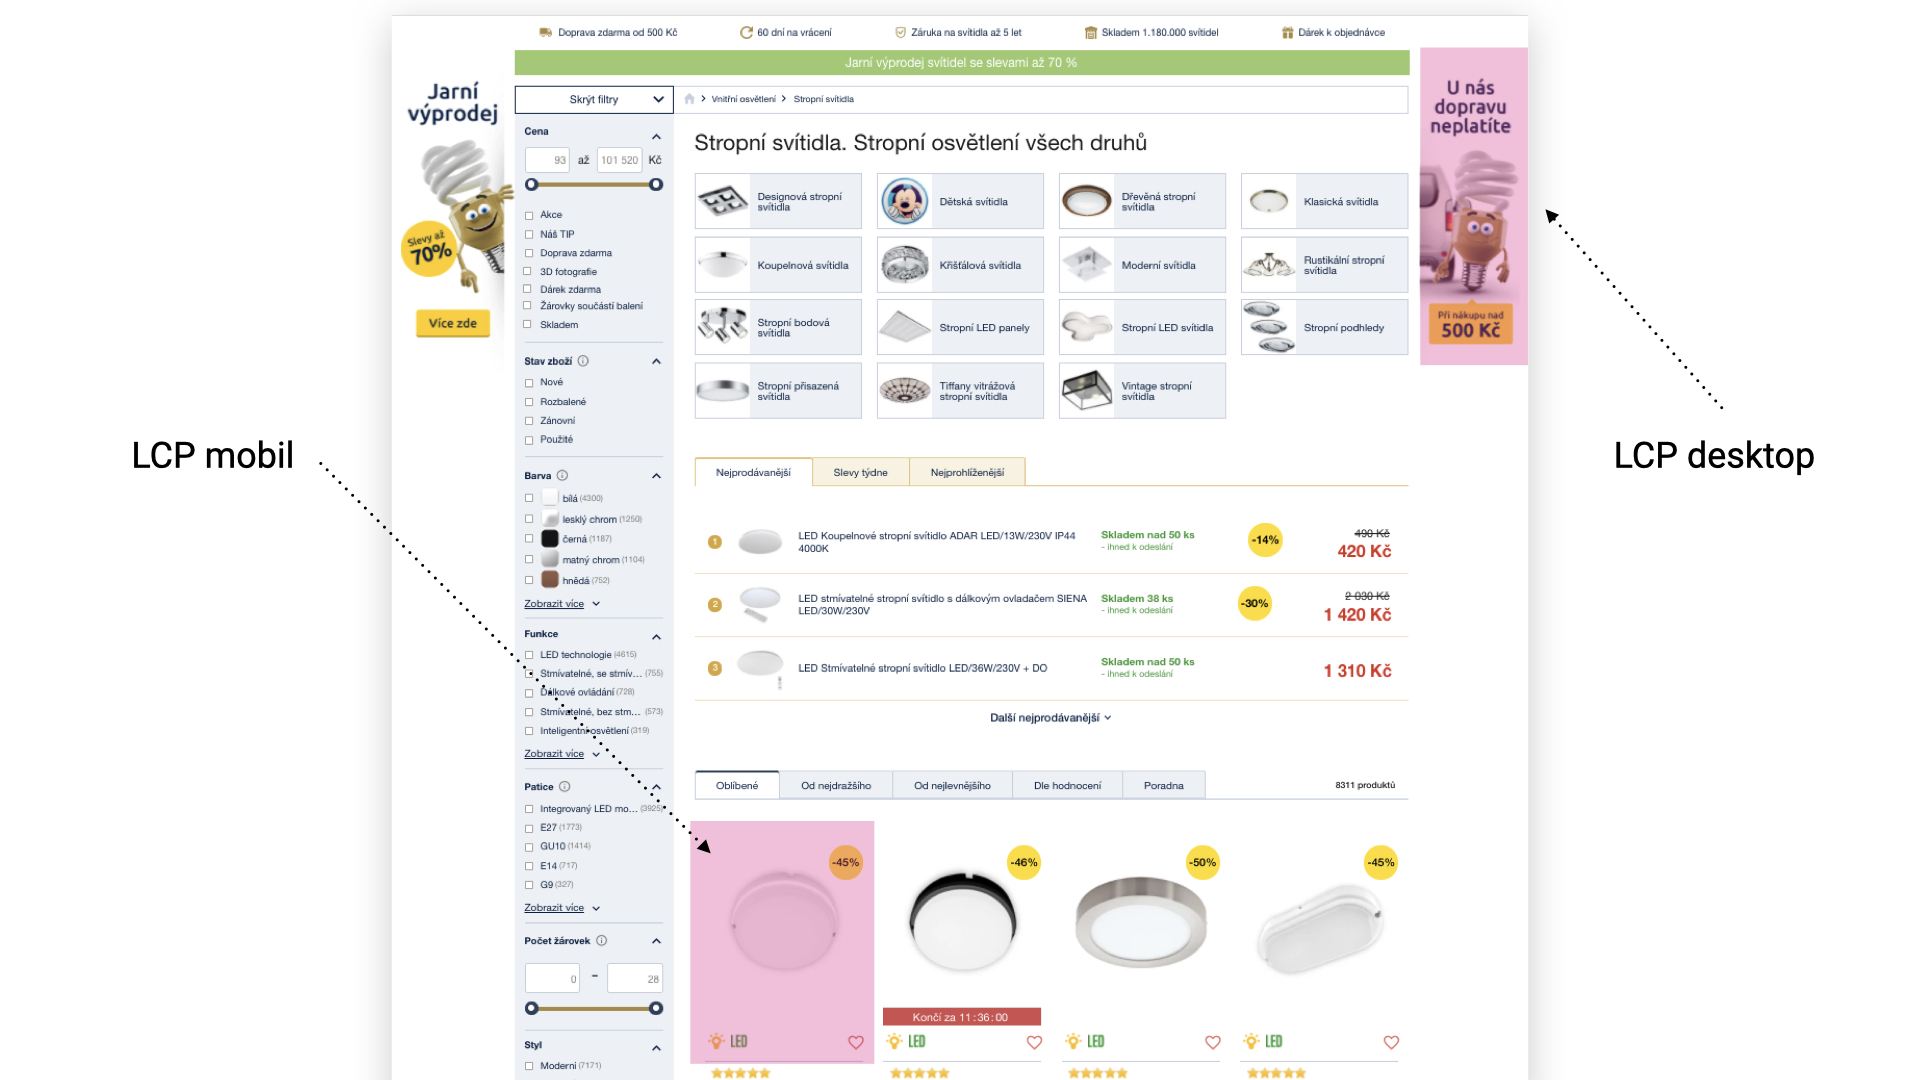
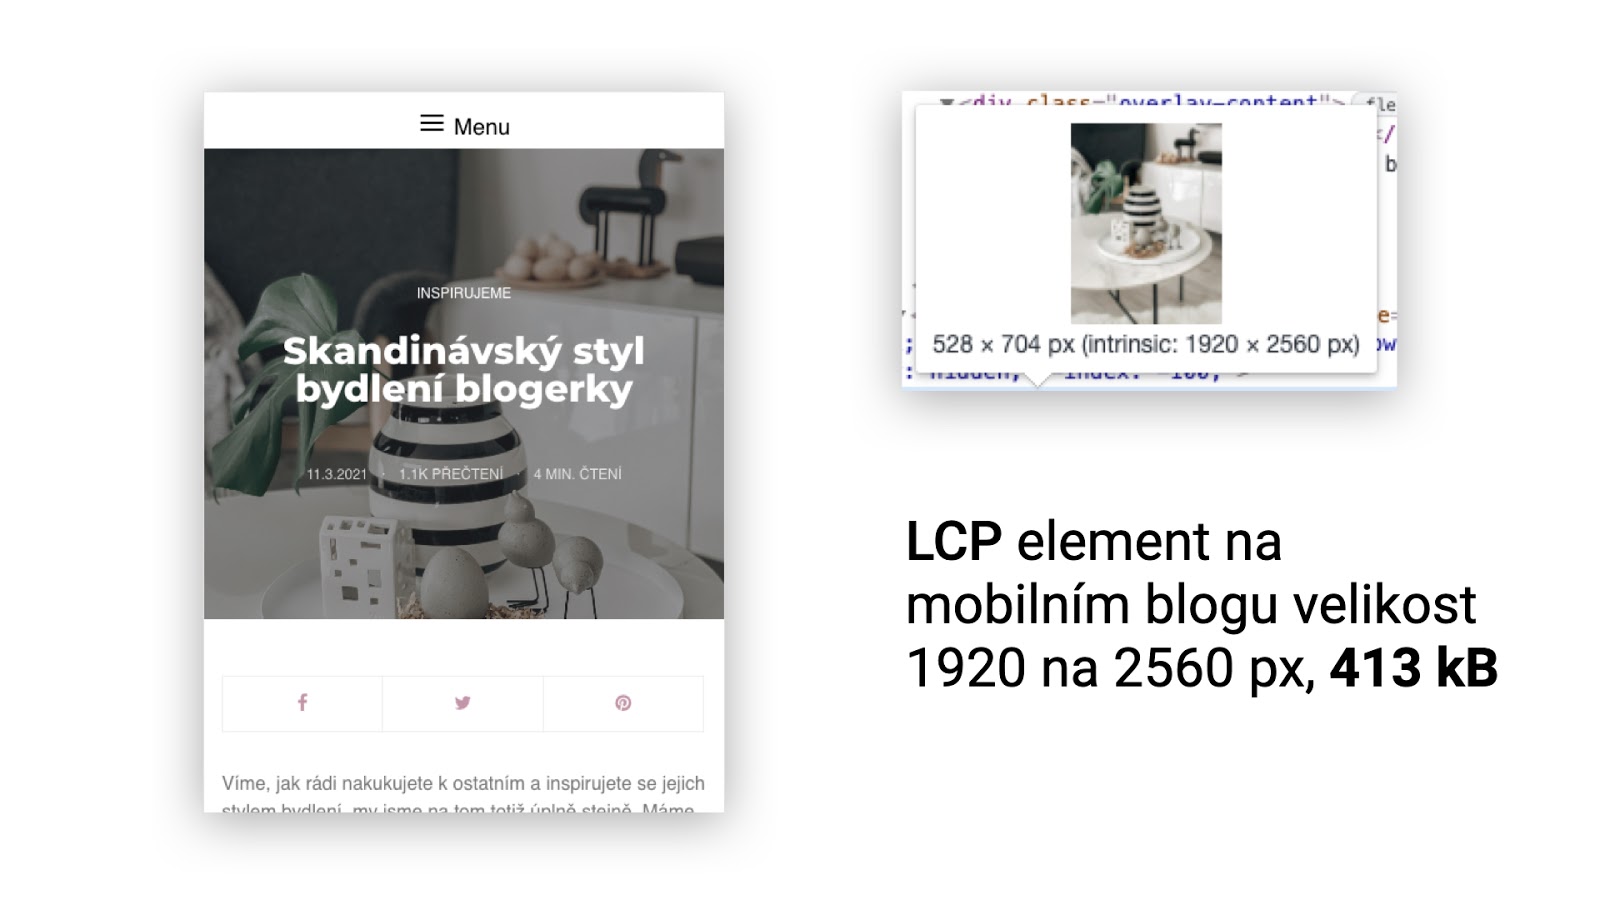
When tuning LCP, the first step is identifying LCP elements. They often differ for mobile and desktop. You can reliably identify your LCP elements using Lighthouse, PageSpeed Insights, or in the test details of our PageSpeed.ONE tool.
LCP and Lazy Loading
The vast majority of websites damage their LCP metric with poorly implemented lazy loading. It's crucial to understand that lazy loading changes the image download order.
A common mistake is applying lazy loading only to large images on the page. Yes, logically, deferring the loading of the largest images saves the most data, but in the case of an LCP element, it undermines your efforts.
The rule is that images without lazy loading are downloaded first. Images with lazy loading are delayed, even if they're in the viewport. If you have lazy loading on an image that's also an LCP element, it will load much later, increasing LCP time.
You have likely deduced the solution already: remove lazy loading from LCP elements on your site, and apply lazy loading to all other elements.
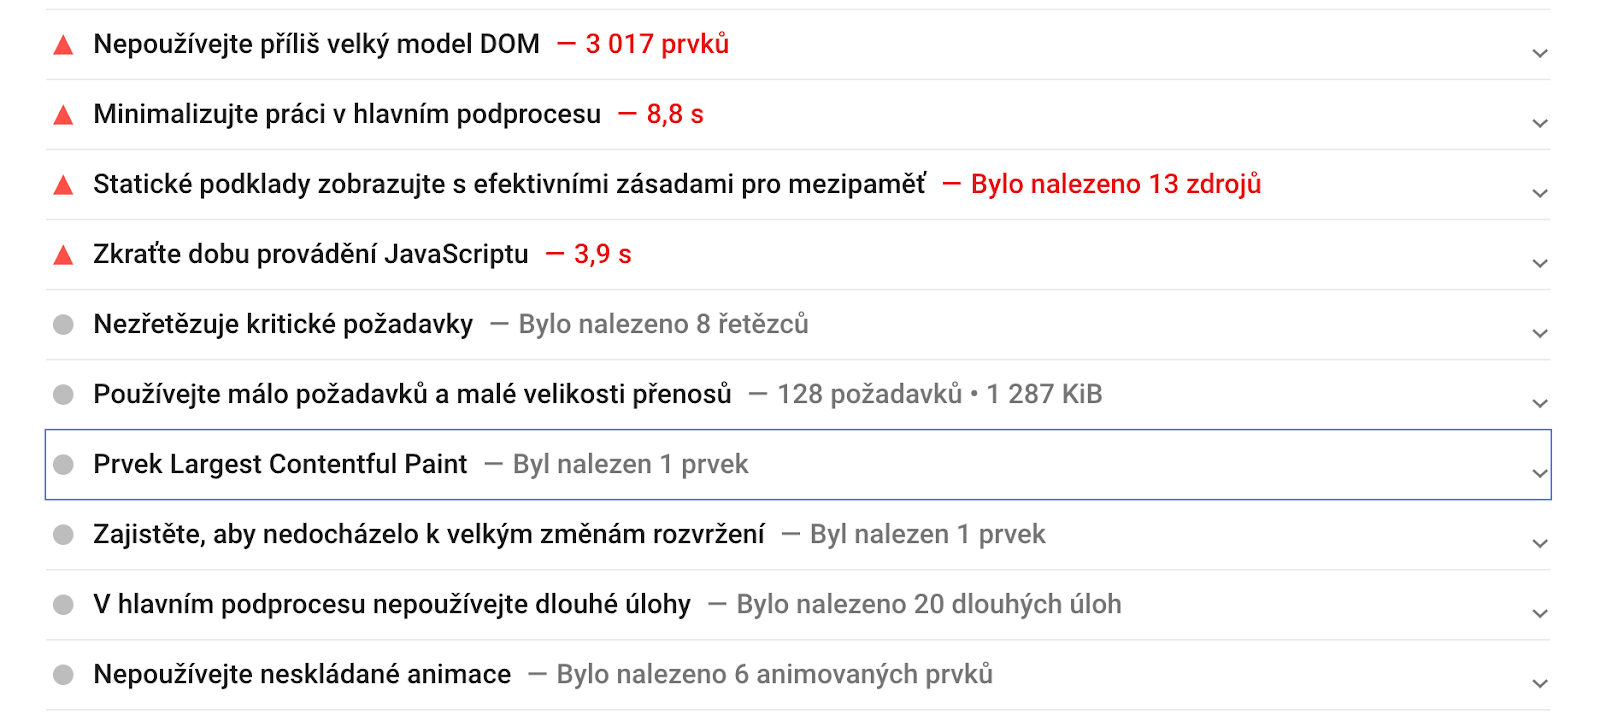
LCP and Complex DOM
Bad news to start – this often takes considerable time to optimize. On the bright side, I'll share a hotfix until you can make more comprehensive code changes.
The issue often arises in design, with significant differences between desktop and mobile versions. You must address this, usually by hiding elements on mobile.
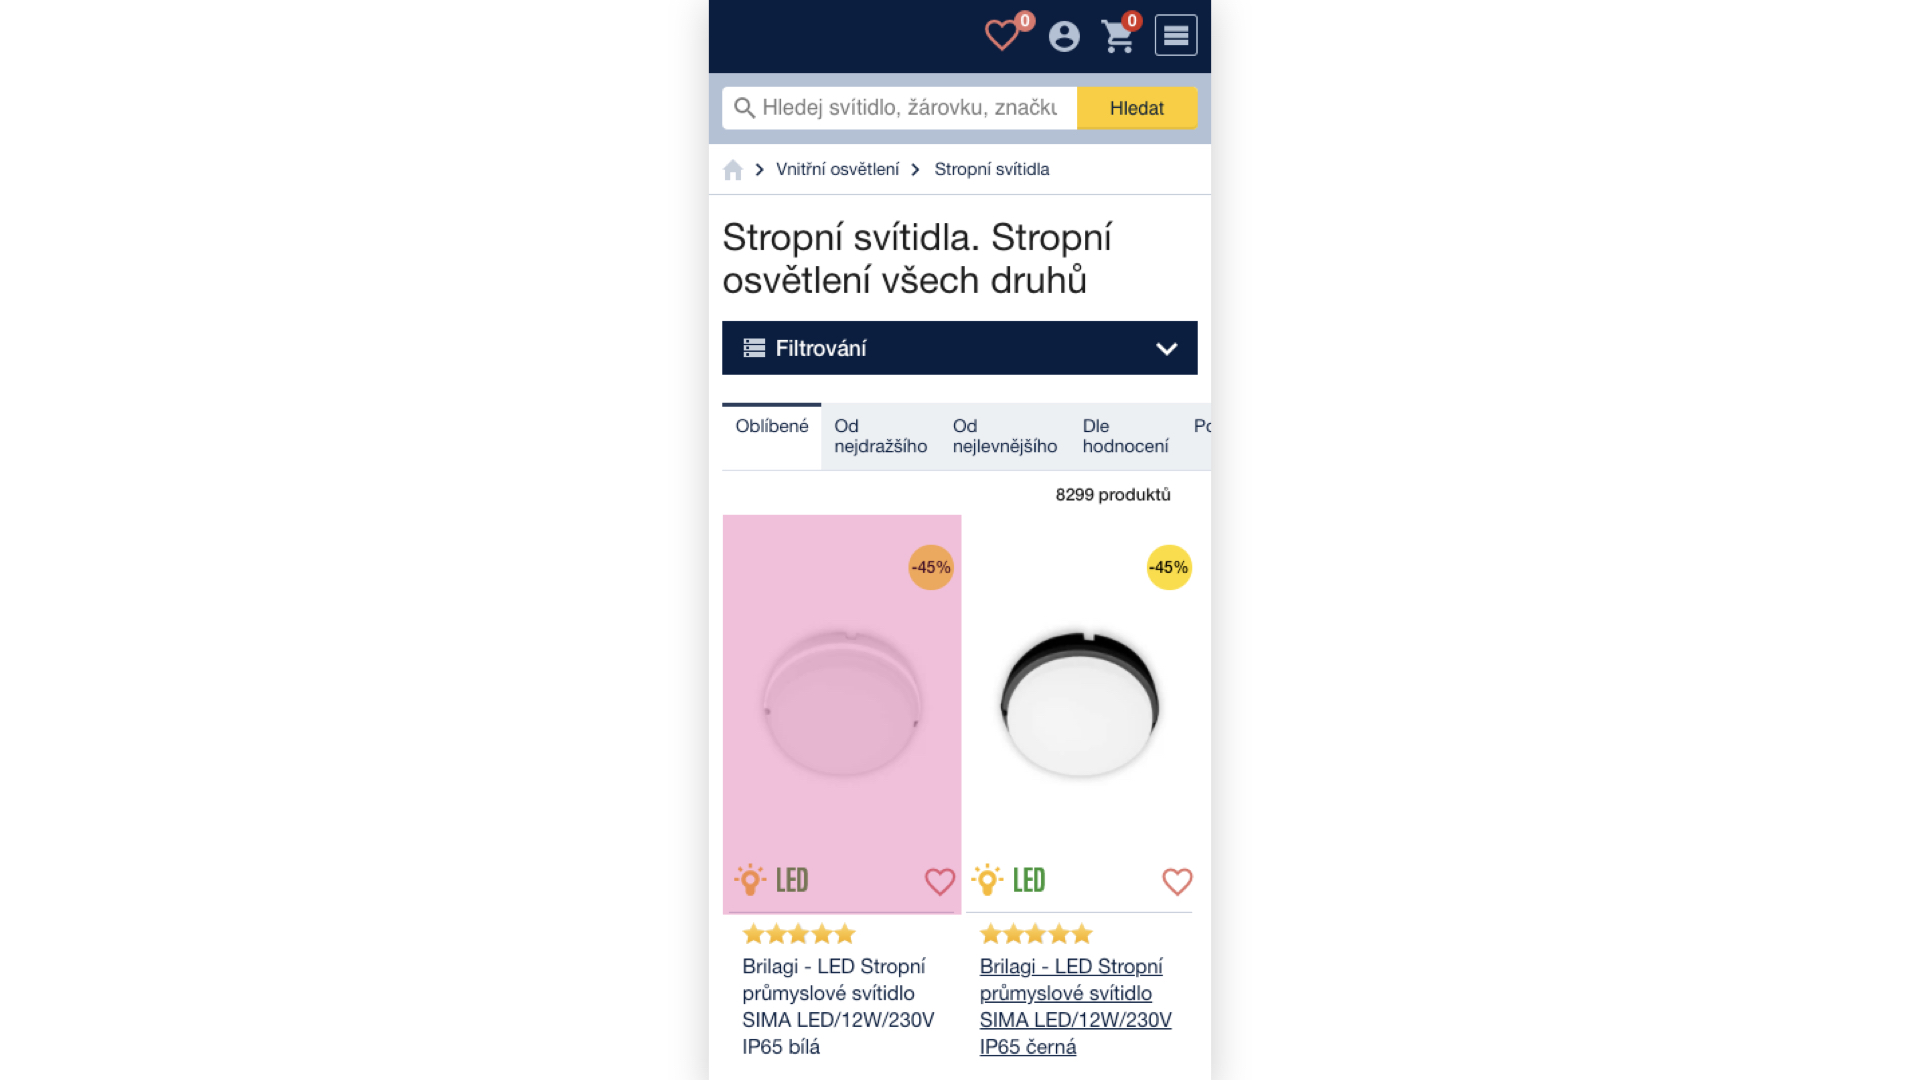
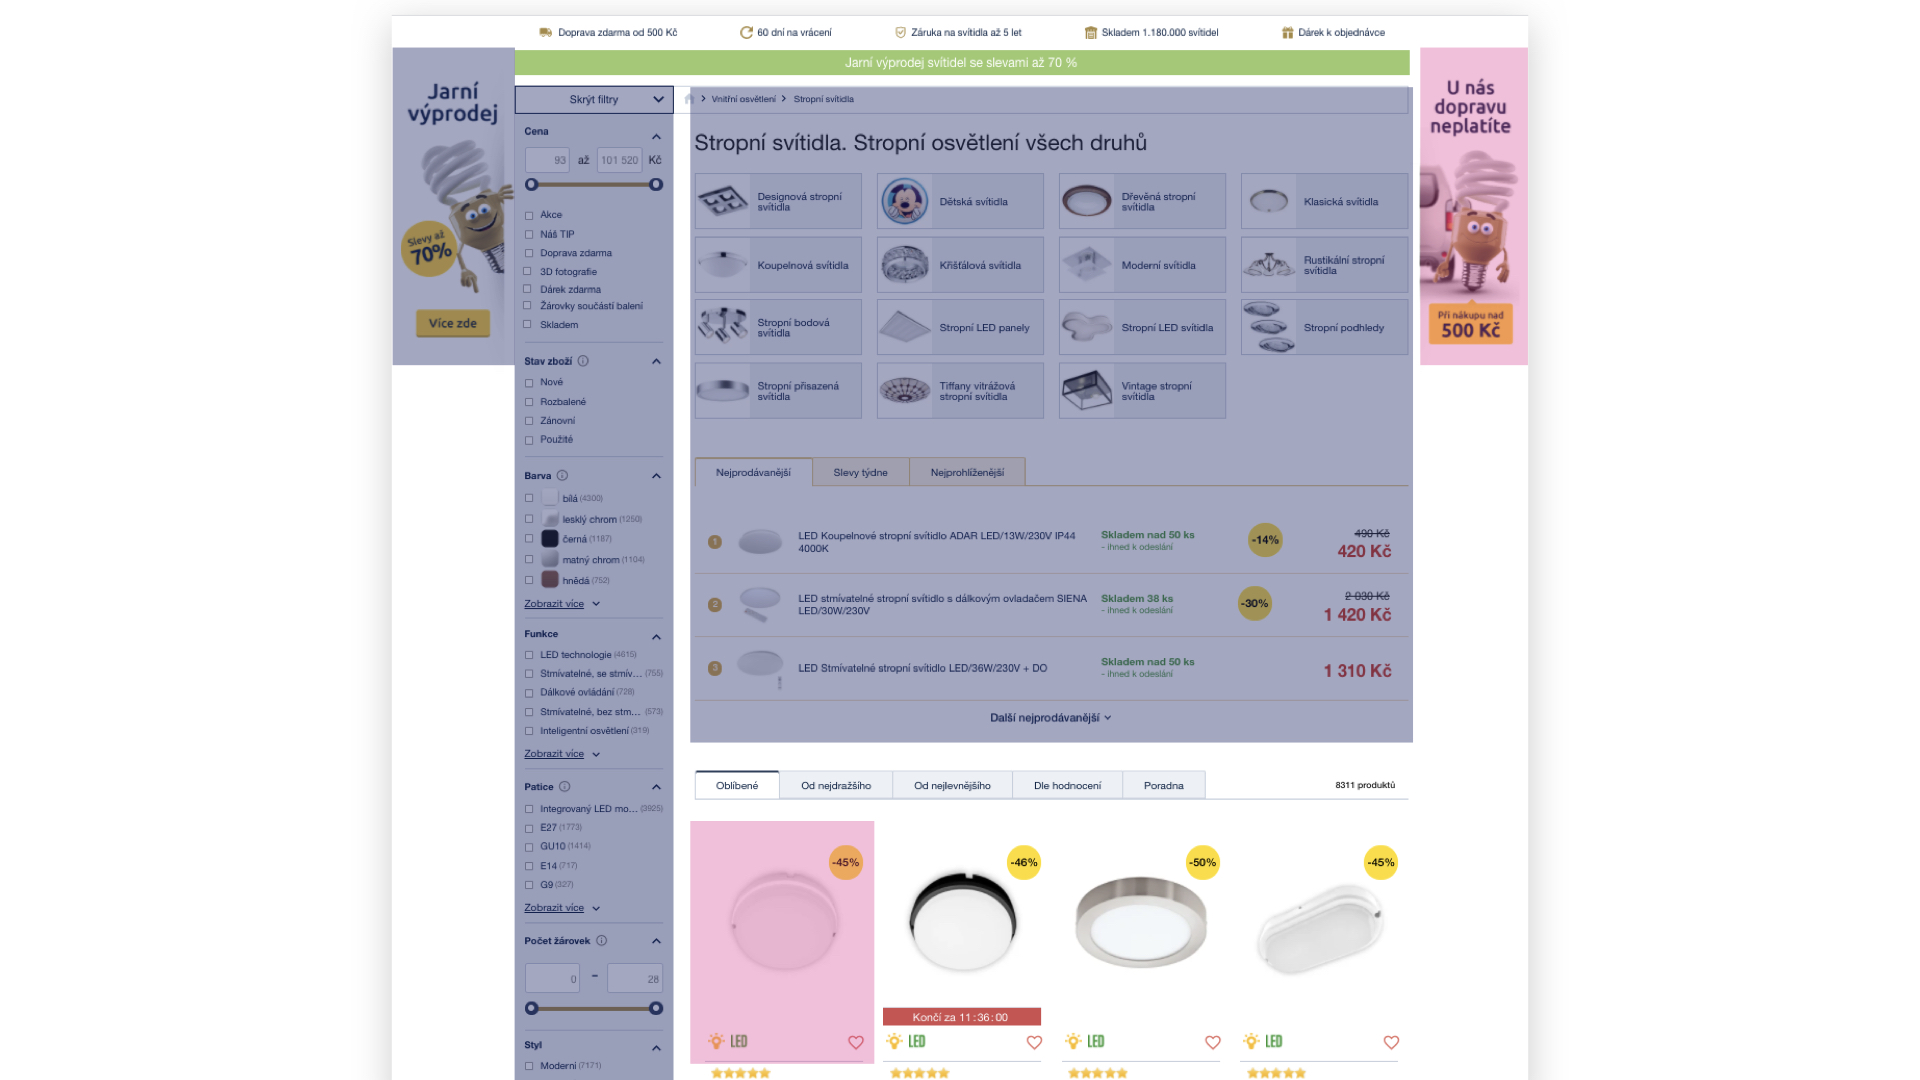
The dark blue area is quite extensive, isn't it? This disrupts your LCP metric. It's important to note that this wouldn't be an issue if we were dealing with simple DOM text elements. The problem here is the multitude of images that will download even when not visible.
There are several solutions. If you have time and resources, rewrite the HTML to reflect LCP elements. You can also use preload for the image identified as LCP on mobile.
<link rel="preload" as="image" href="image.jpg" />
Be cautious with preload, especially if you have other preloads on the page. You can also use loading="lazy", as images in hidden elements with this attribute won't download.
LCP and Images from WYSIWYG
Handling images in the editor requires oversight. Many e-commerce sites have blogs under their domain, which can negatively impact metrics, and often do. I'm not picking on developers and coders, but what users upload through WYSIWYG is also your responsibility. You need to manage sizes, compression, suitable formats, and srcsets.
CLS – Cumulative Layout Shift
Cumulative Layout Shift is a metric dealing with the shifting and jumping of a page's layout. Critical are not only layout shifts during loading – measured by synthetic tools – but also layout shifts during page browsing. You can find this out by looking at user data from the Chrome UX report.
How to test such CLS? Ideally, through a Chrome extension called Web Vitals, or in Chrome itself under the rendering tab with the "Core Web Vitals" checkbox.
CLS and Width and Height Attributes
Regarding CLS, we frequently highlight missing width and height attributes on image tags on every website. It's often a mistake from negligence, so it's necessary to search for all images on the project and check for missing attributes.
<img src="image.jpg" alt="img" width="150" height="200" />
Another future solution for preventing not only image but also other content element shifts is the CSS property aspect-ratio. One line of code will determine the space an element reserves for its content.
.box {
  aspect-ratio: 4/3;
  background: grey;
}
If you need a foolproof solution right away, we recommend the padding-top trick.
CLS and Carousels (for example)
Not only carousels but any JavaScript-initialized content can worsen your cumulative layout shift. Common culprits include various quizzes, calculators, widgets, etc.
JavaScript initialization usually occurs quite late, increasing CLS. It's unwise to address things with JavaScript that can be styled in CSS. This often includes the widths of carousel items.
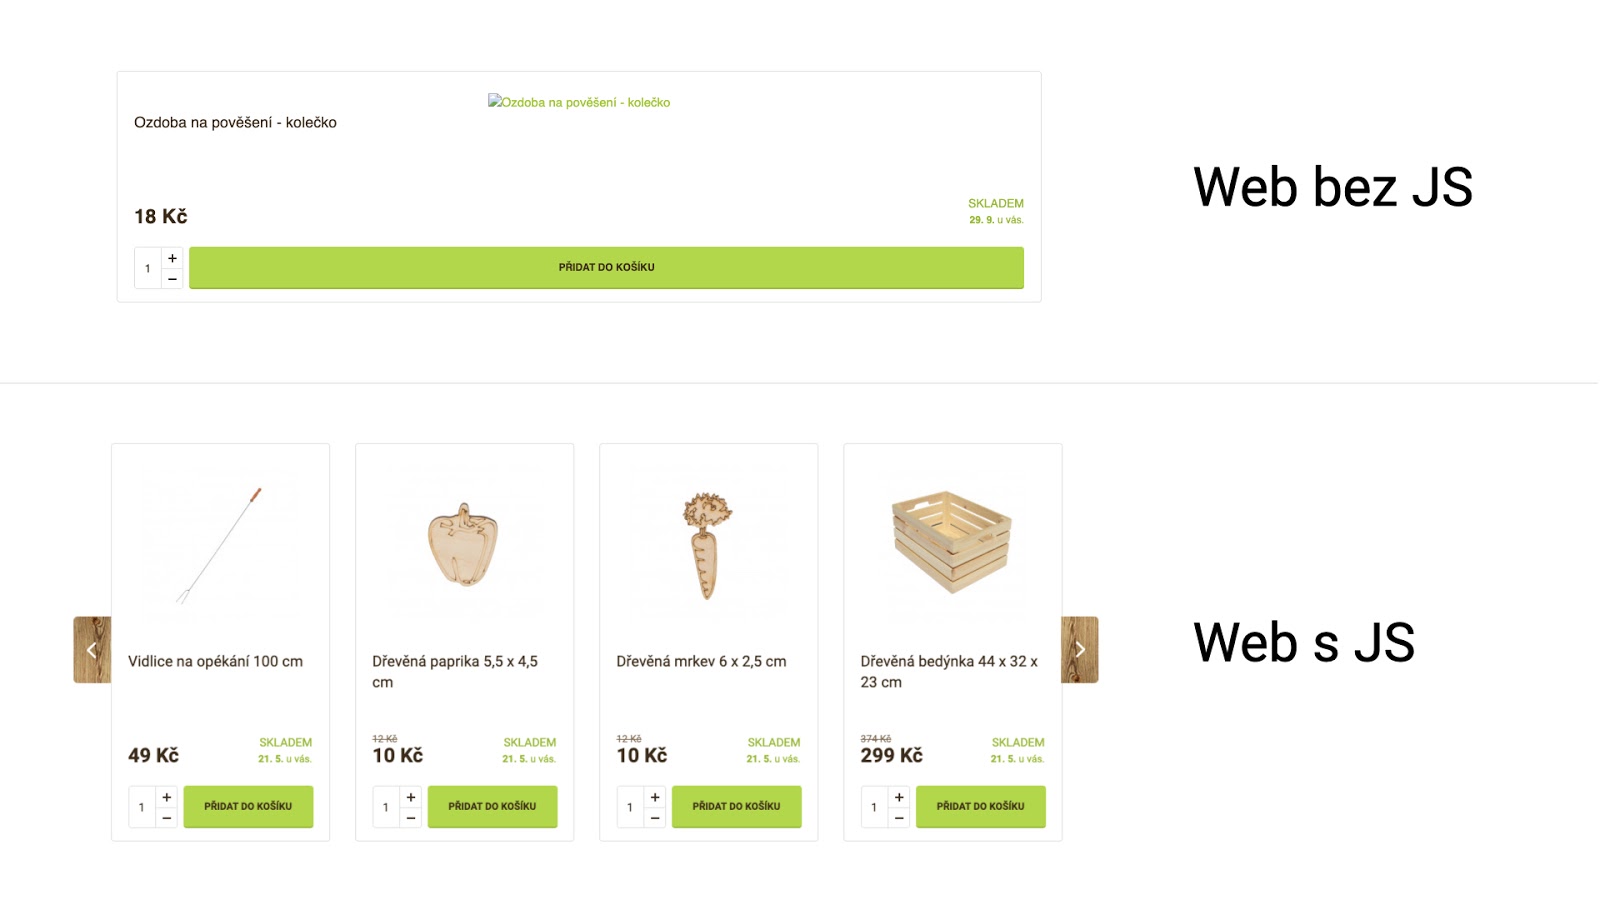
Therefore, handle element widths and heights in CSS, and test your site with JavaScript disabled. This will help you identify weak points on the site. A helpful tool might be the Chrome extension Web Developer, where JavaScript can be disabled with a single click.
CLS and AJAX
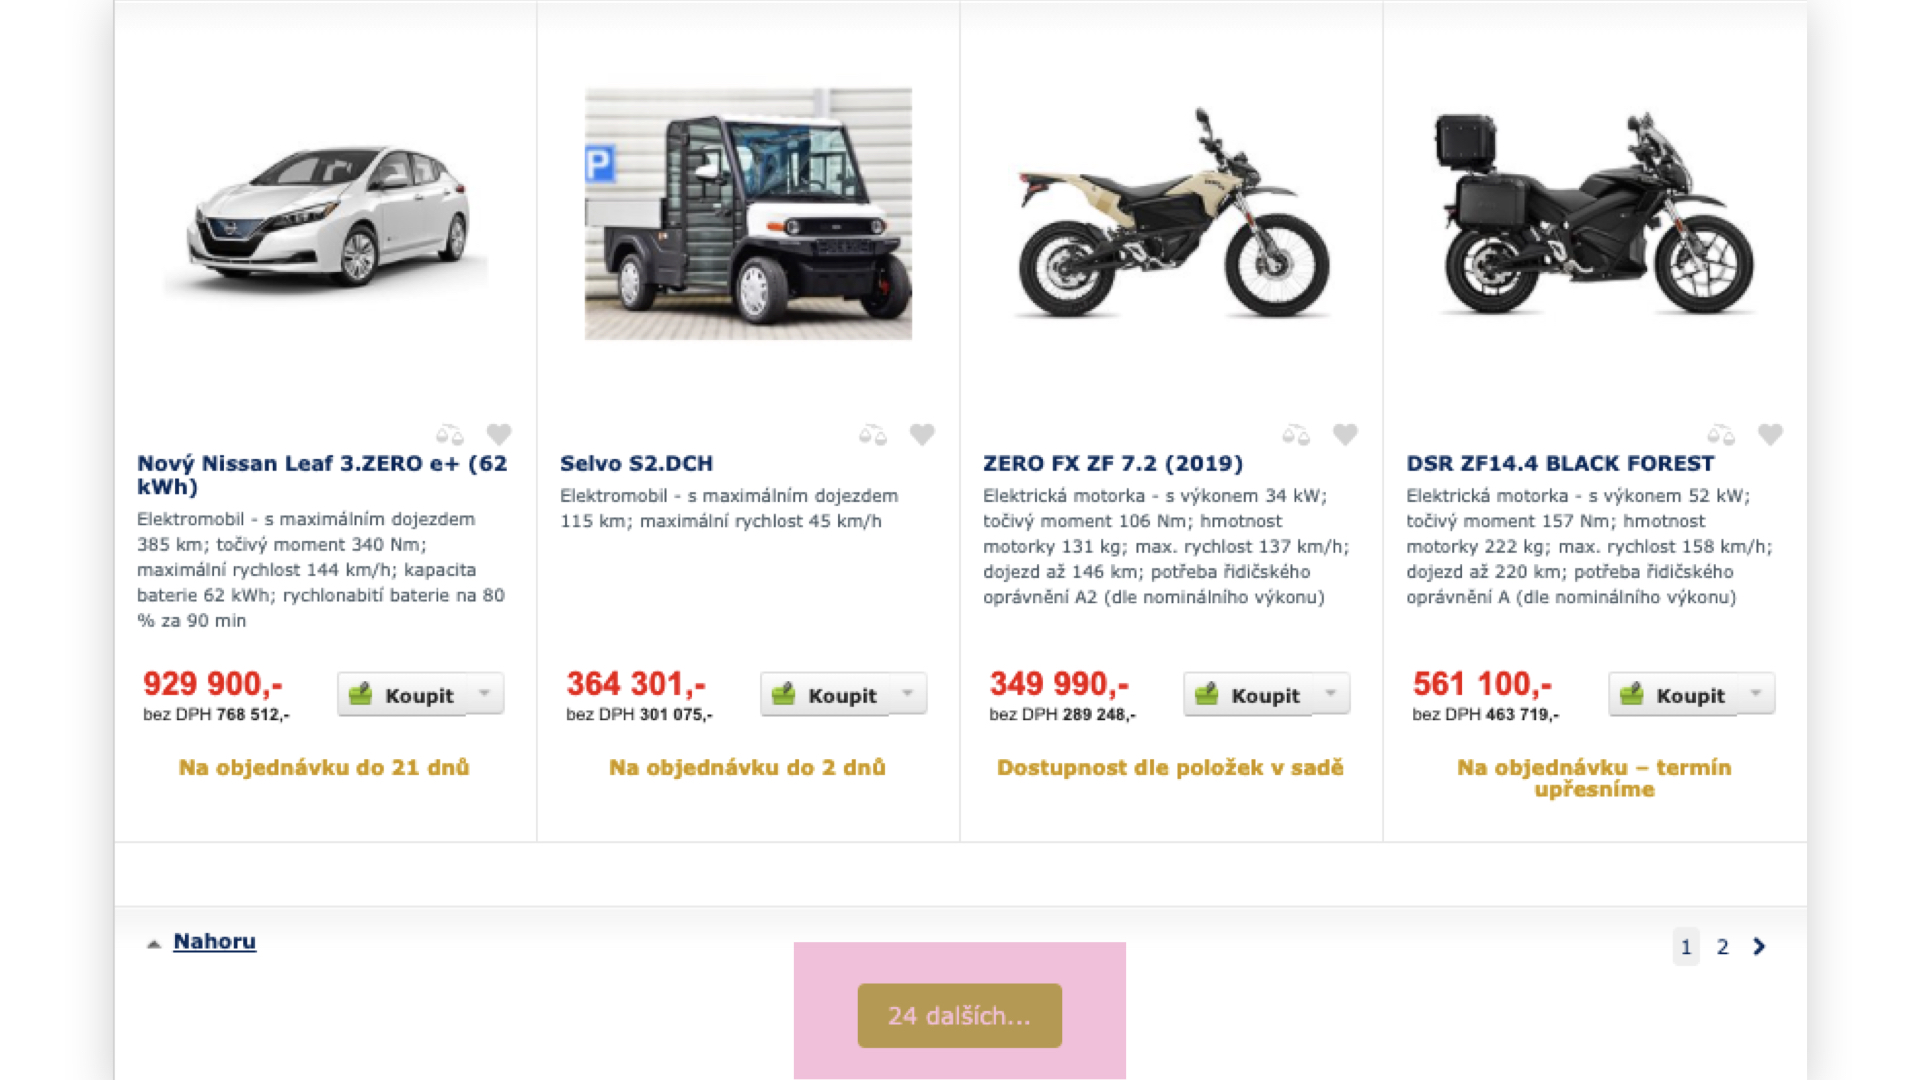
The CLS metric doesn't only account for shifts at page load but also during user interactions. If a user chooses to, say, "Load 24 more products" on a website, you have a 0.5-second window to display content without increasing CLS further.
Instructions for such situations are as follows: Test slow networks and load content deferred while the browser is "idle", using RequestIdleCallback().
A Few Final Words
If you're new to website speed and I've overwhelmed you with a deluge of new information, don't despair. First, go make yourself a coffee, then focus on data collection and testing. You should be interested not only in user data from Web Vitals but also in synthetic measurements. Ideally, all of this should be viewed over several months.
Regarding synthetic data, Lighthouse has released version 8, which, for instance, adjusts the calculation of scores. For example, TBT and LCP metrics together account for 55% of the total score calculation. This alone suggests which metrics you should focus on.
Finally, I want to encourage all developers to have enough enthusiasm and curiosity to understand how browsers really work. Focus on DevTools and the Performance tab for optimizations, think holistically, and strive to understand how different elements on the web interact. You can also learn to optimize both problematic metrics – CLS and LCP.
Discussion
Following the lecture, there was also a moderated discussion where I, along with Michal Matuška, answered questions from the audience.
How Fast Is Your Website?
How does your website speed compare to your competitors? Find out using our online tester.
Tags:Core Web Vitals