Measuring Website Speed for Marketers Step-by-Step
 Martin Michálek4/26/202212 minutes reading
Measuring website speed can be rather a tricky affair, especially with the ever-evolving landscape — take, for instance, Google's recent introduction of the Page Experience update.
Individuals not fully immersed in the "web performance" realm — such as marketers, managers, or designers — often stumble over using inappropriate tools at unsuitable phases of measurement.
On April 7th, I had the pleasure of discussing this topic at the SEO Restart conference. In the following article, I'll share the main takeaway: demonstrating the simplest method to acquire speed data and the recommended approach to conveying it to developers.
I will illustrate this using screenshots from our version 3.0 speed tester, which we recently enhanced with user accounts and the ability to monitor multiple client websites on a dashboard, even alongside colleagues.
As a sample website, I've chosen the domain Mall.cz, which isn't among our clients but is intriguing due to its size and variety of page types. A public speed test of Mall can be found at pagespeed.one/app/r/73f8e7b84404.
The Website Speed Work Cycle
Let's start with a broad overview of the general process involved in working on speed.
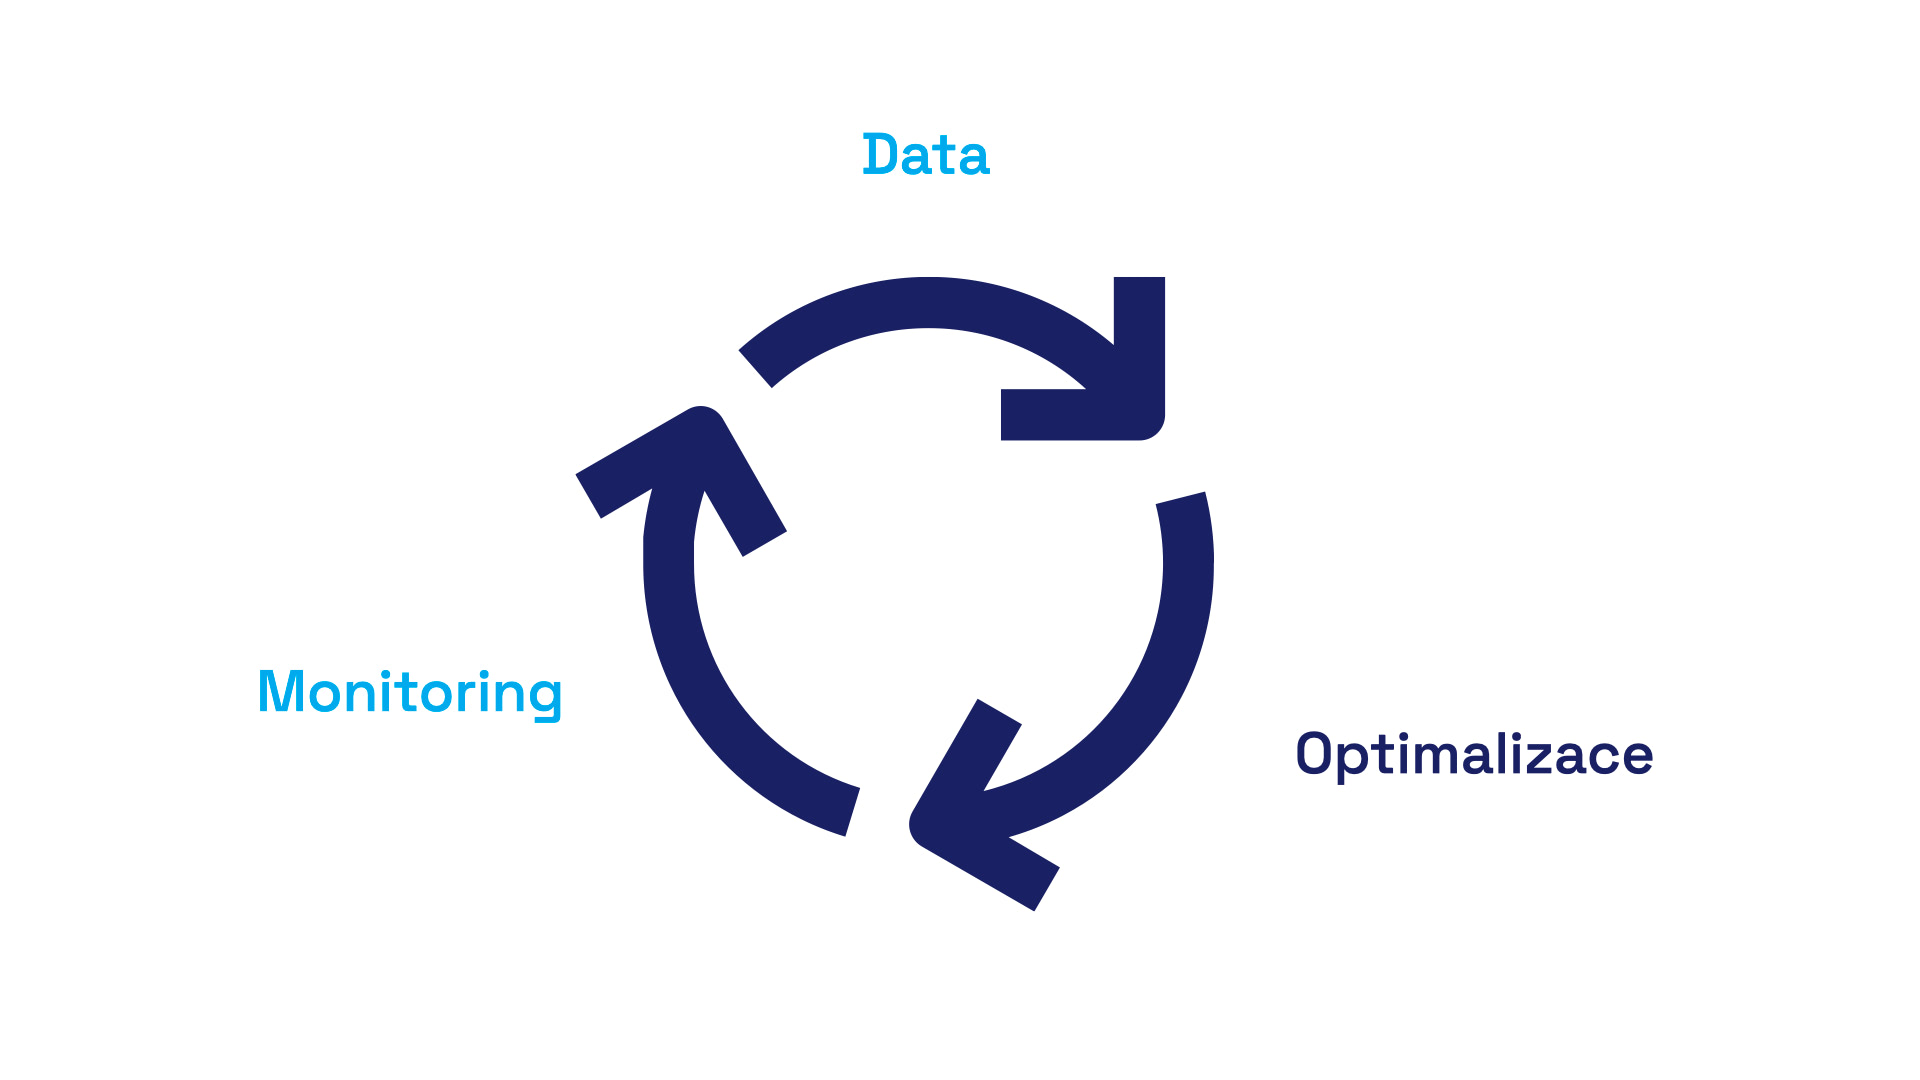
Google defines the process in its materials as a three-step cycle. First, we collect data, then we optimize, and finally, we monitor because, as is the nature of things, something typically goes awry a few weeks after optimizations.
Allow me to simplify this process into two steps:
- Optimization (usually handled by developers).
- Data and monitoring (also known as data collection over time — developers can handle this, but it's usually someone analytical, who views the project from a more non-technical and "top-down" perspective).
Within the framework of PageSpeed.ONE's services, we work at the intersection of both — we monitor data while simultaneously providing developers with specific optimization opportunities.
Google Page Experience and Pages, Groups, Domains
For those unfamiliar, let me reiterate that website speed is evaluated using Core Web Vitals metrics within a set of ranking signals that Google has named Page Experience.
These metrics are derived from the Chrome UX Report (CrUX), meaning they reflect the experience of real users visiting your site, not data from tools like Lighthouse or PageSpeed Insights.
By the way, the Lighthouse score isn't something to overly concern yourself with. It's merely a rough estimate, lacking any direct connection to your users, and can be somewhat misleading to the untrained eye.
The user data you need can often be found in Google Search Console:
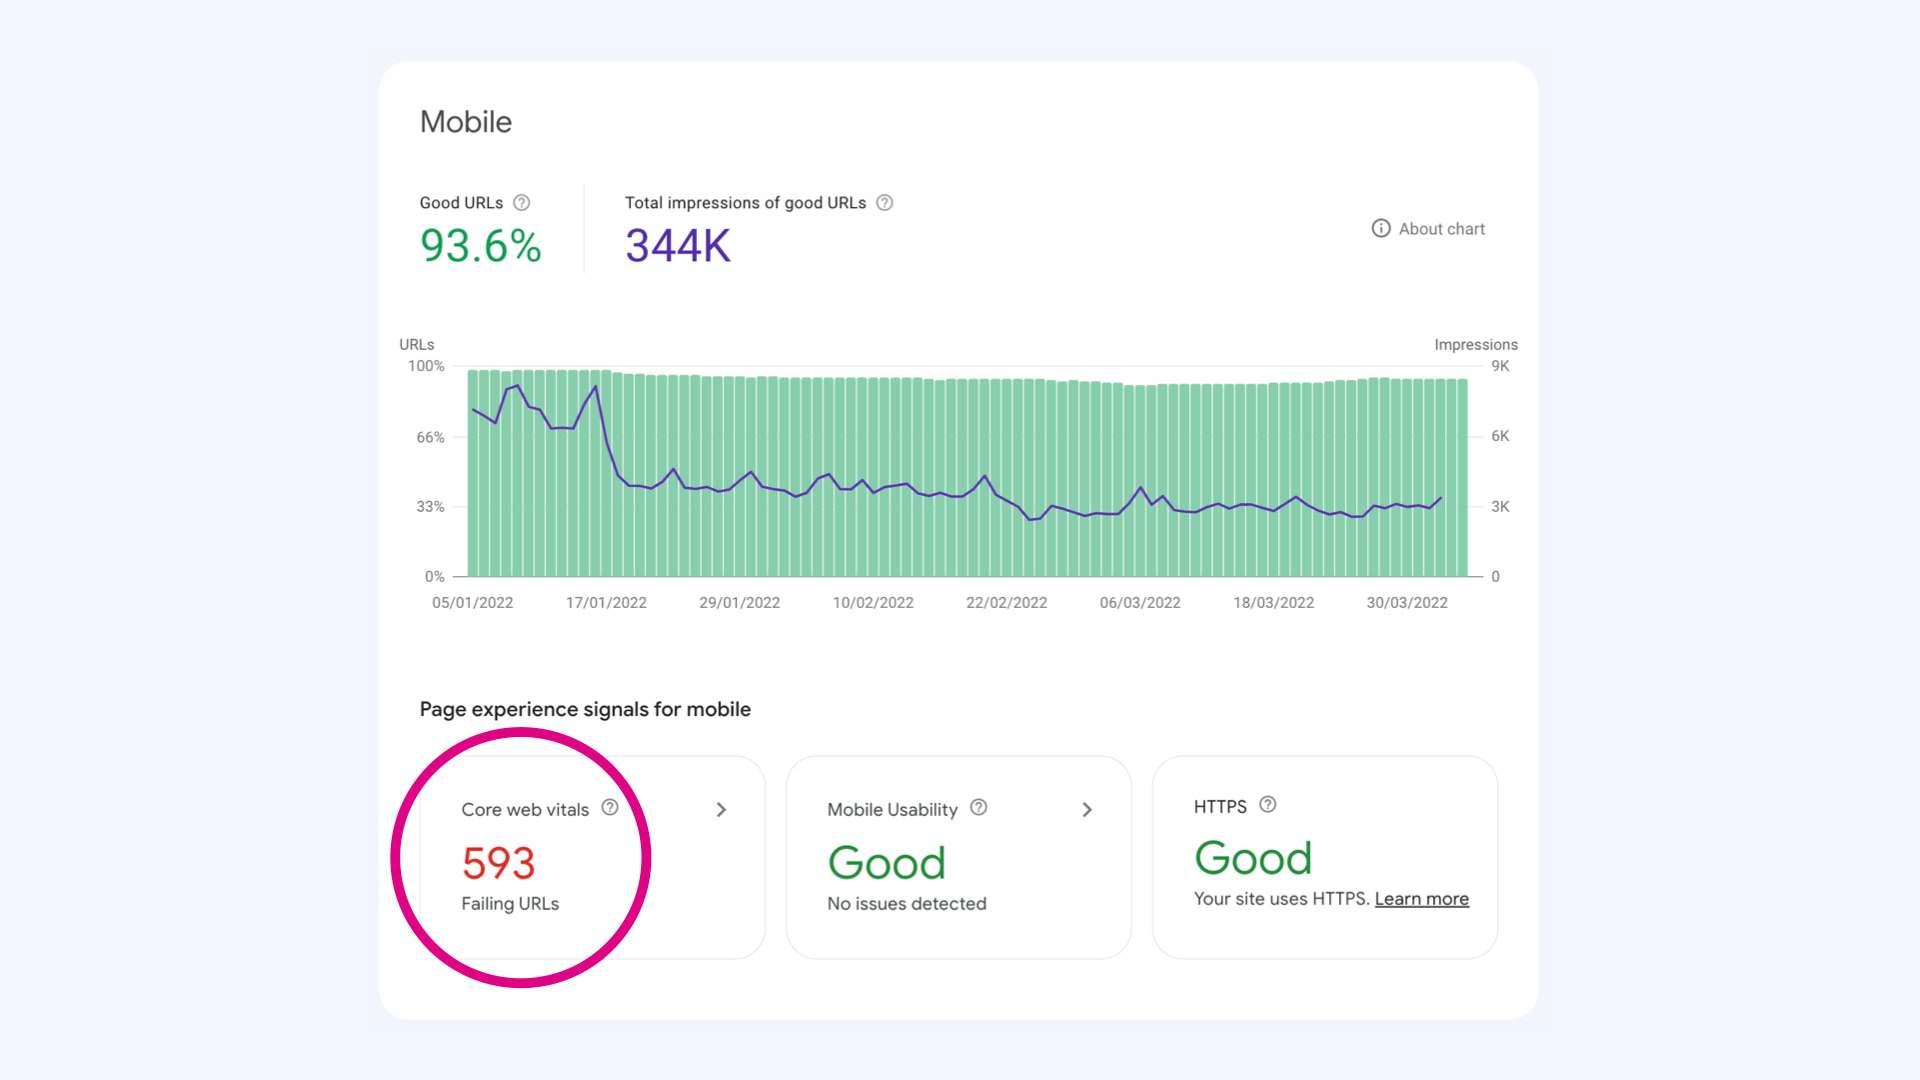
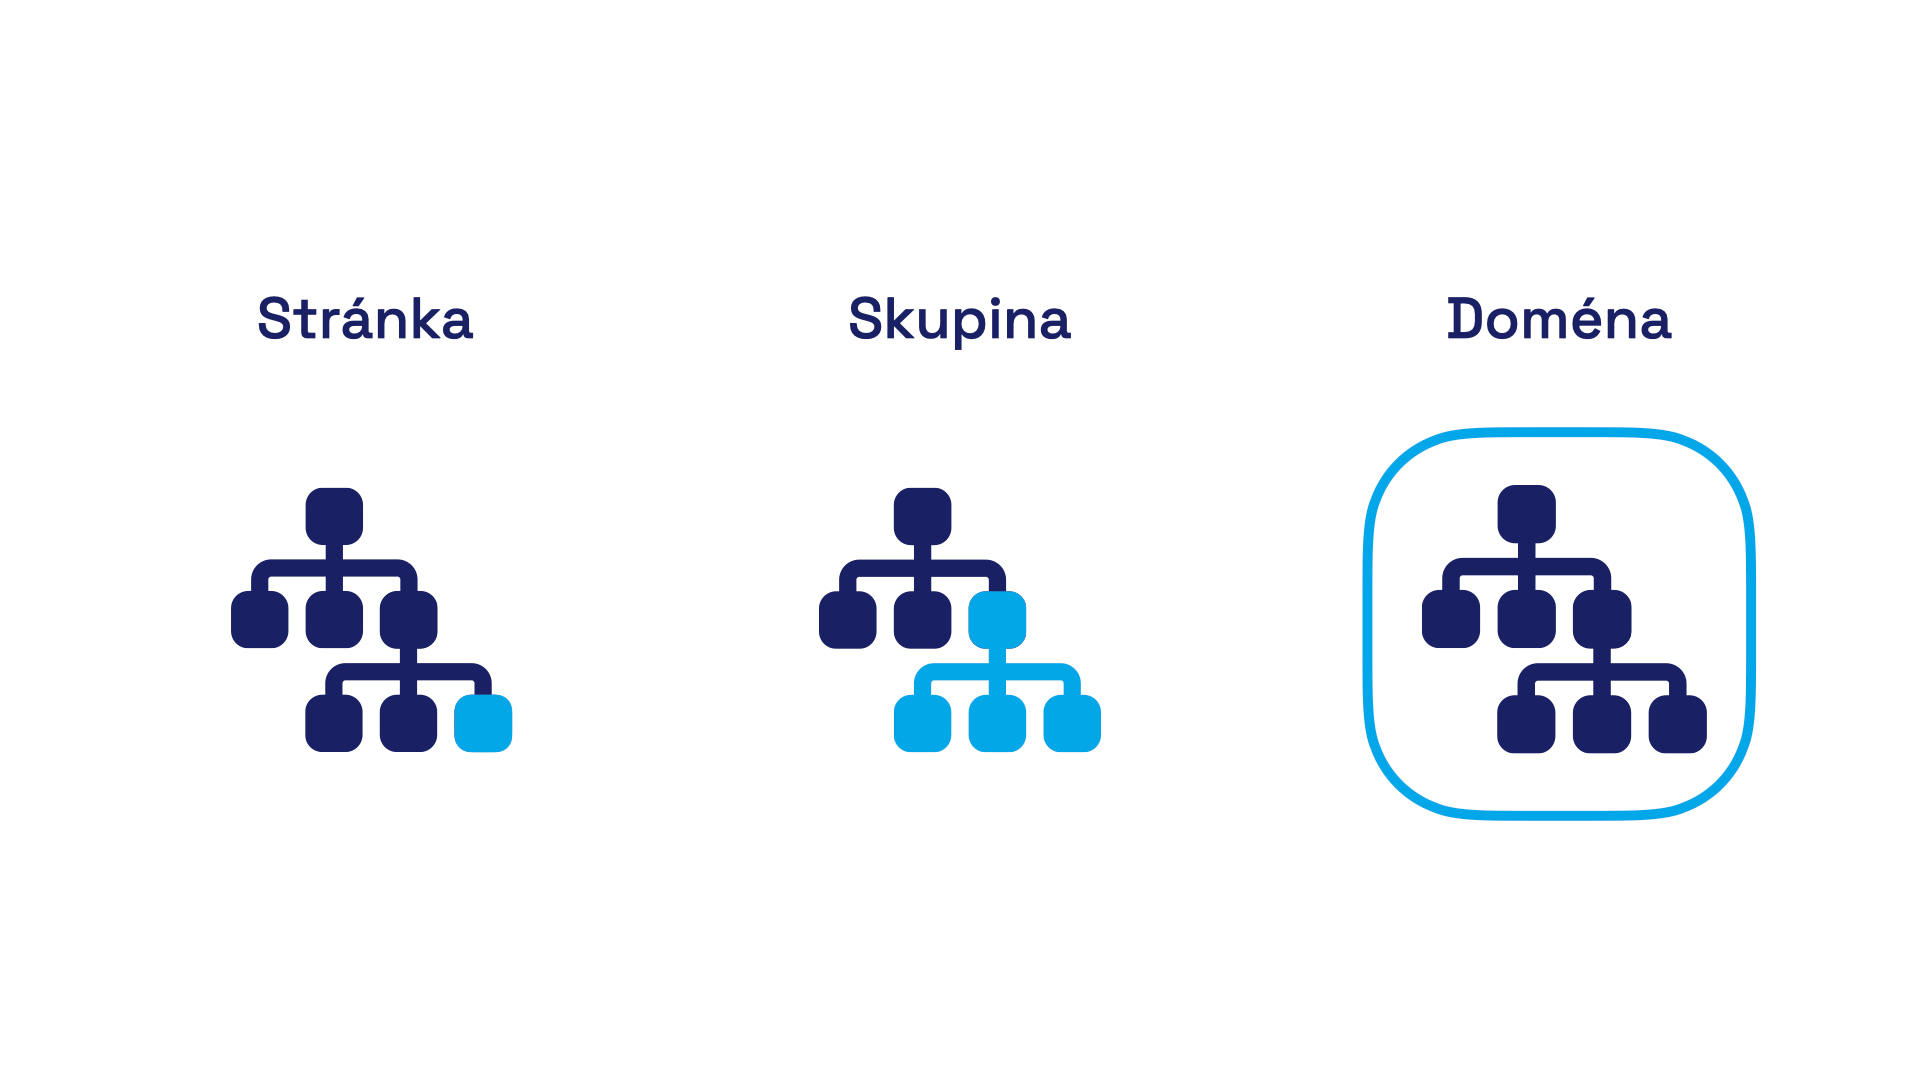
For the process mentioned in this article, it's crucial to understand that Web Vitals are assessed at three levels:
- Specific URL – the most visited addresses have their own evaluation.
- Page Group – if a URL lacks its own Core Web Vitals data, Google uses a group evaluation. For instance, an e-commerce site might have a group for product detail pages.
- Domain – if a URL doesn't have its own evaluation or doesn't belong to a group, Google uses data for the entire domain.
In all cases, Google calculates the 75th percentile of Core Web Vitals metrics from all visits over the last 28 days cumulatively. These are the data you see in all tools that use CrUX as a data source, including our tester on pagespeed.one.
Originally, I assumed nearly every URL would be included in at least a page group, but reality might be different.
For our clients, I've observed that URL evaluations never exceed a few dozen addresses, and for less visited sites, it's often just a handful. Group assessments, which can only be seen in Search Console, account for about half of all URLs for our clients.
There are extremes, too. Large sites like Livesport.cz can have up to 90% of URLs adopting the domain's evaluation. This is inferred from the difference between the total number of URLs Google knows and the number of URLs included in page groups in the Web Vitals reports within Google Search Console.
What does this imply? Perhaps a slightly inconvenient truth — optimizing Web Vitals values ideally requires attention at the domain level, page group level, and for individual frequently visited URLs.
First Step: Domain Measurement
When measuring speed, we always start by looking at data for the entire domain. It's the simplest (albeit somewhat simplified) expression of a website's speed status.
You can, of course, check PageSpeed Insights to see Web Vitals status for the domain:
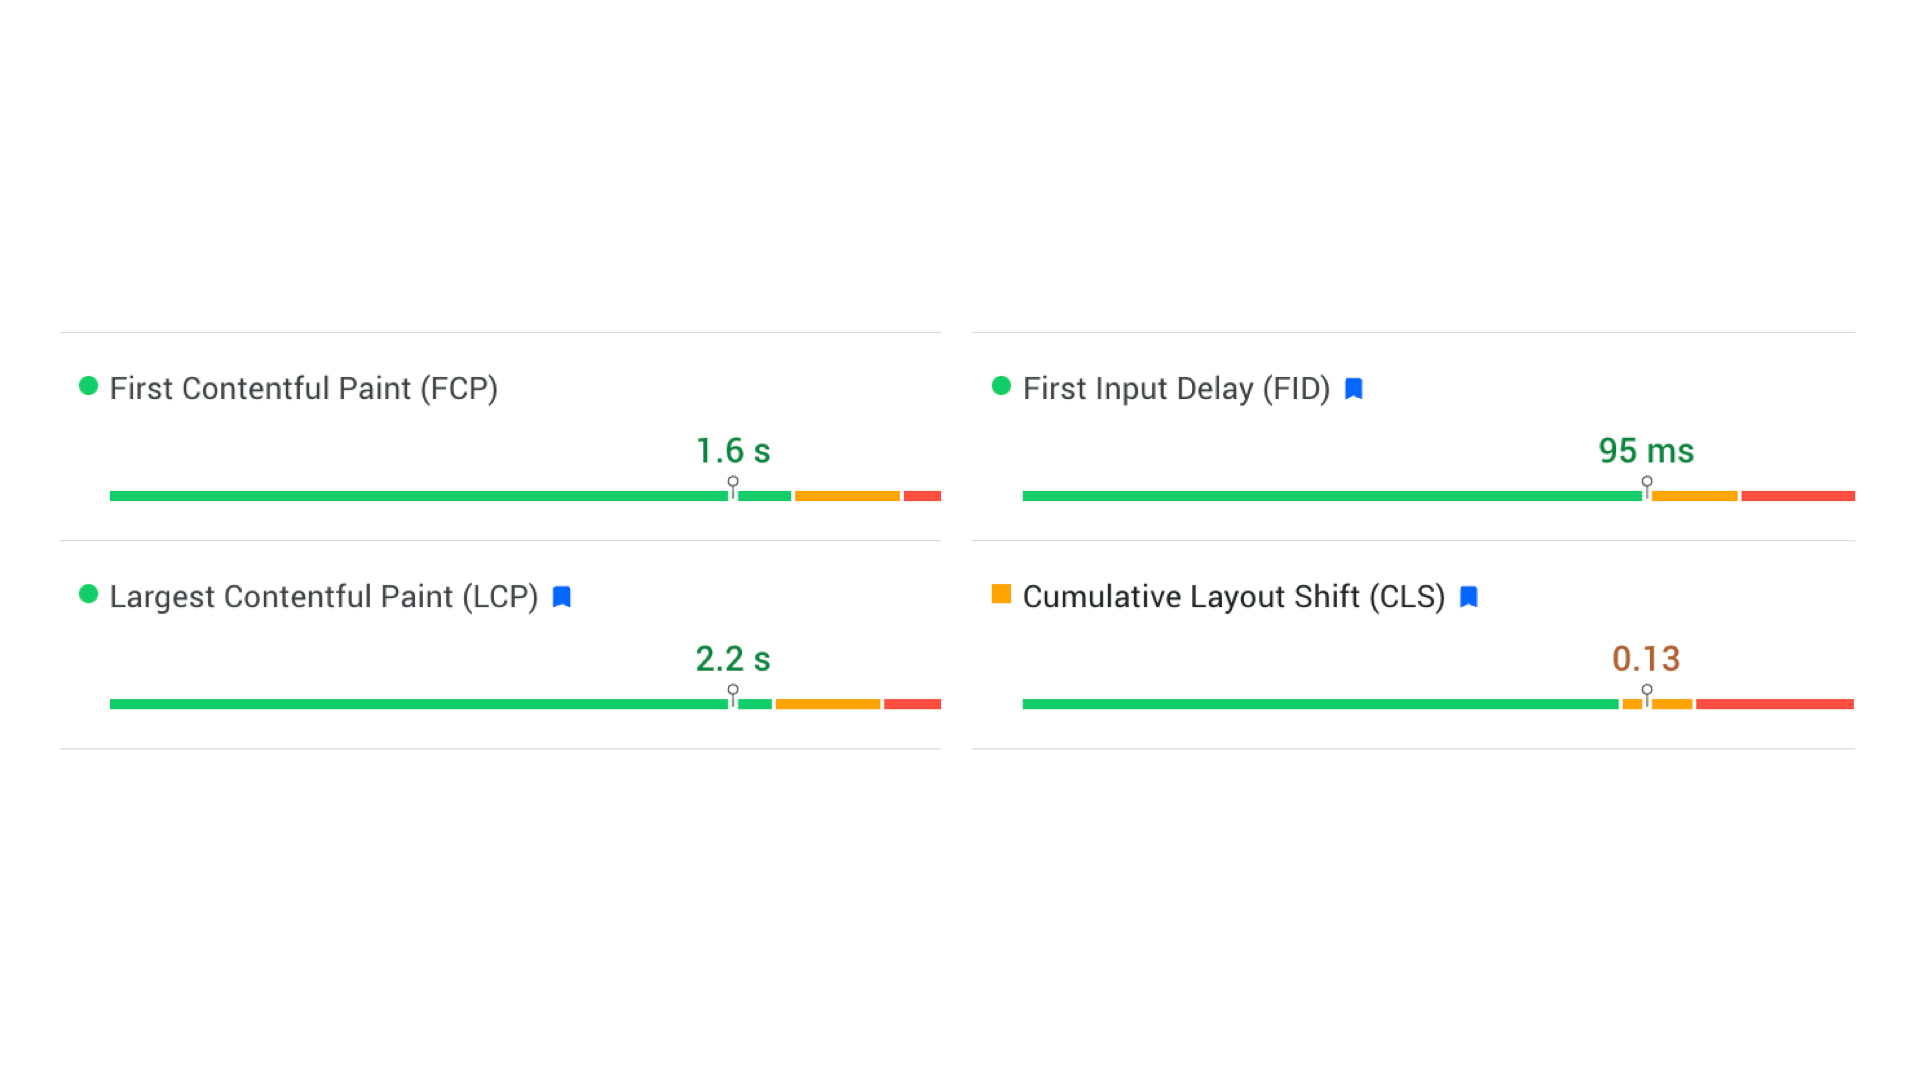
From these figures and graphs, we can identify the metric needing the most optimization. For mall.cz, it's CLS (Cumulative Layout Shift).
PageSpeed Insights provides accurate data, i.e., cumulative metric values for users over a month from the Chrome UX Report. However, the drawback is that you can't see trends compared to the previous period or multiple domains simultaneously.
That's why we've introduced a dashboard in our tester, where you can track the numbers of all your clients' websites after logging in:
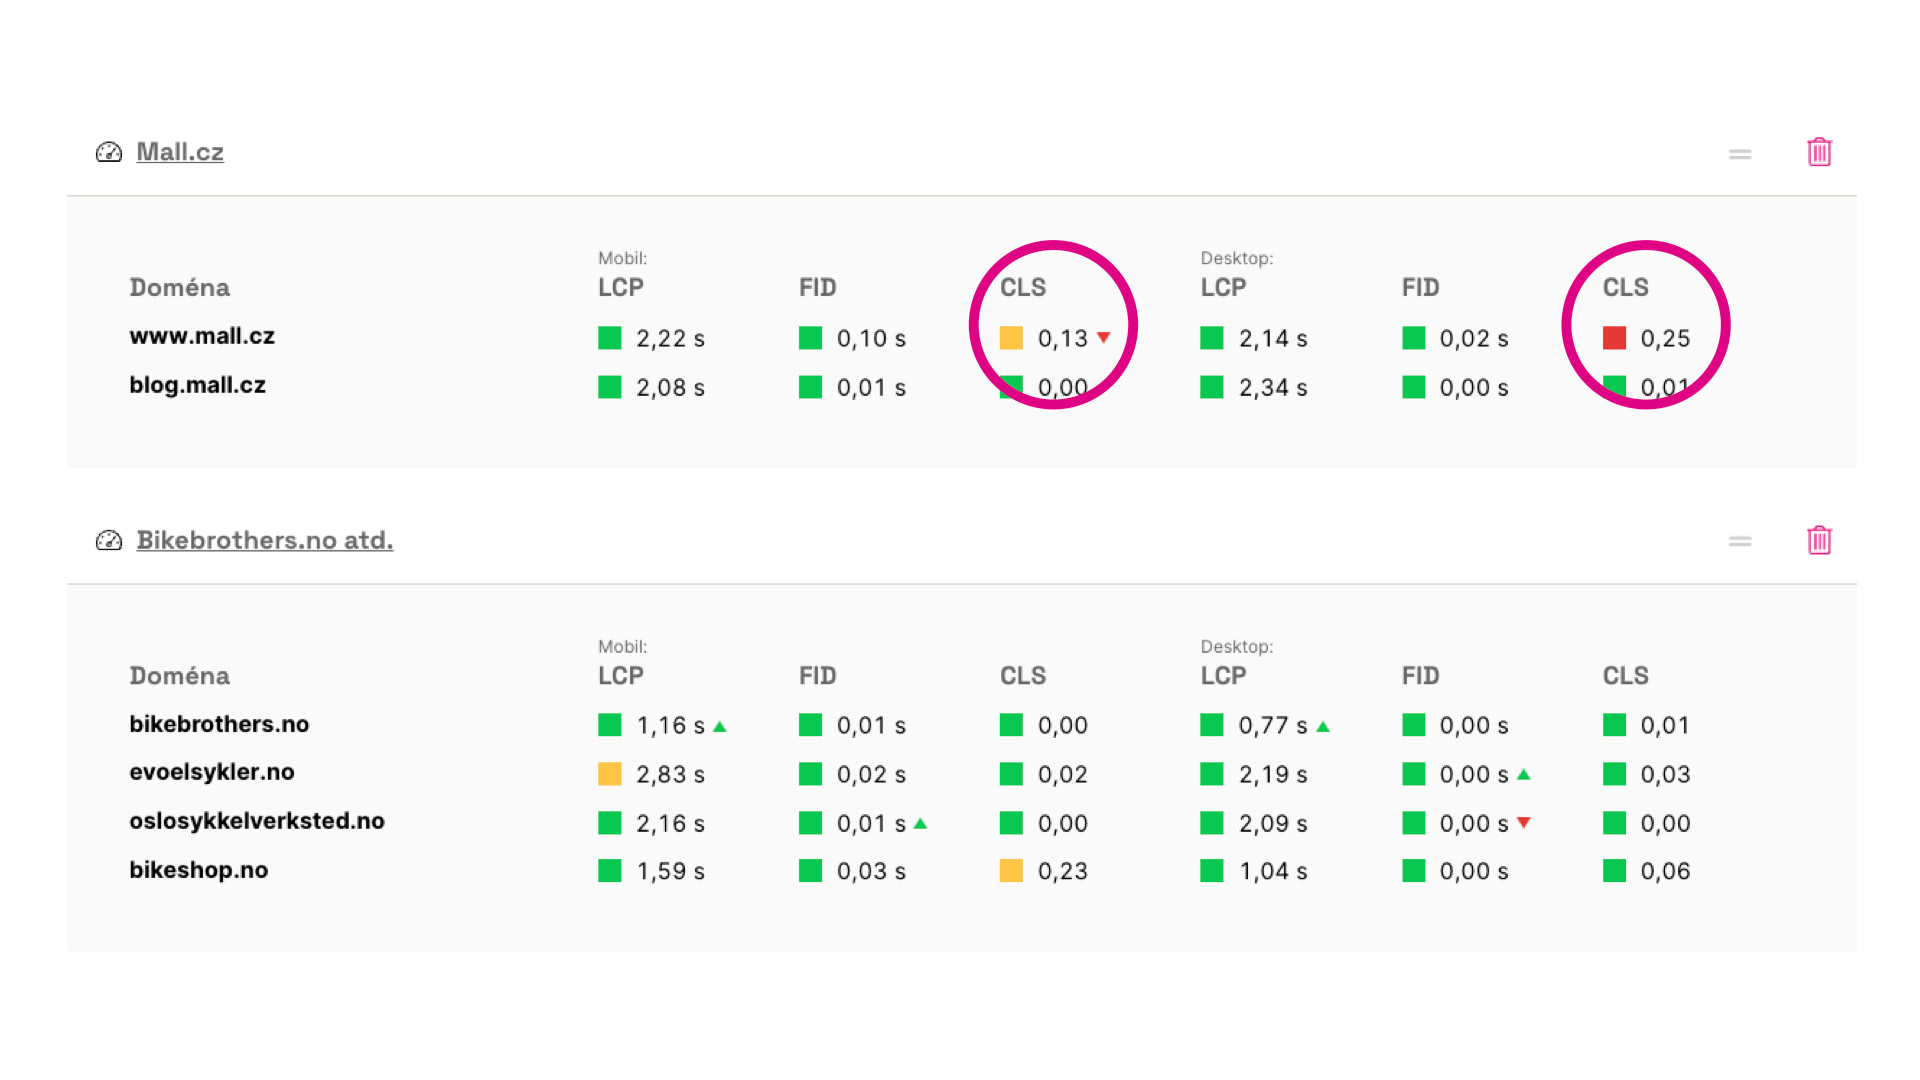
From the image above, it's evident that on mobile, the mall.cz domain not only fails to meet CLS standards (value is 0.13) but has also worsened over the past month.
We now know what's wrong, and if we track the numbers regularly, we can also determine if they've changed recently. But what if we only measure speed once every few months?
This is where another feature of our tester comes in handy — monthly data from the Chrome UX Report:
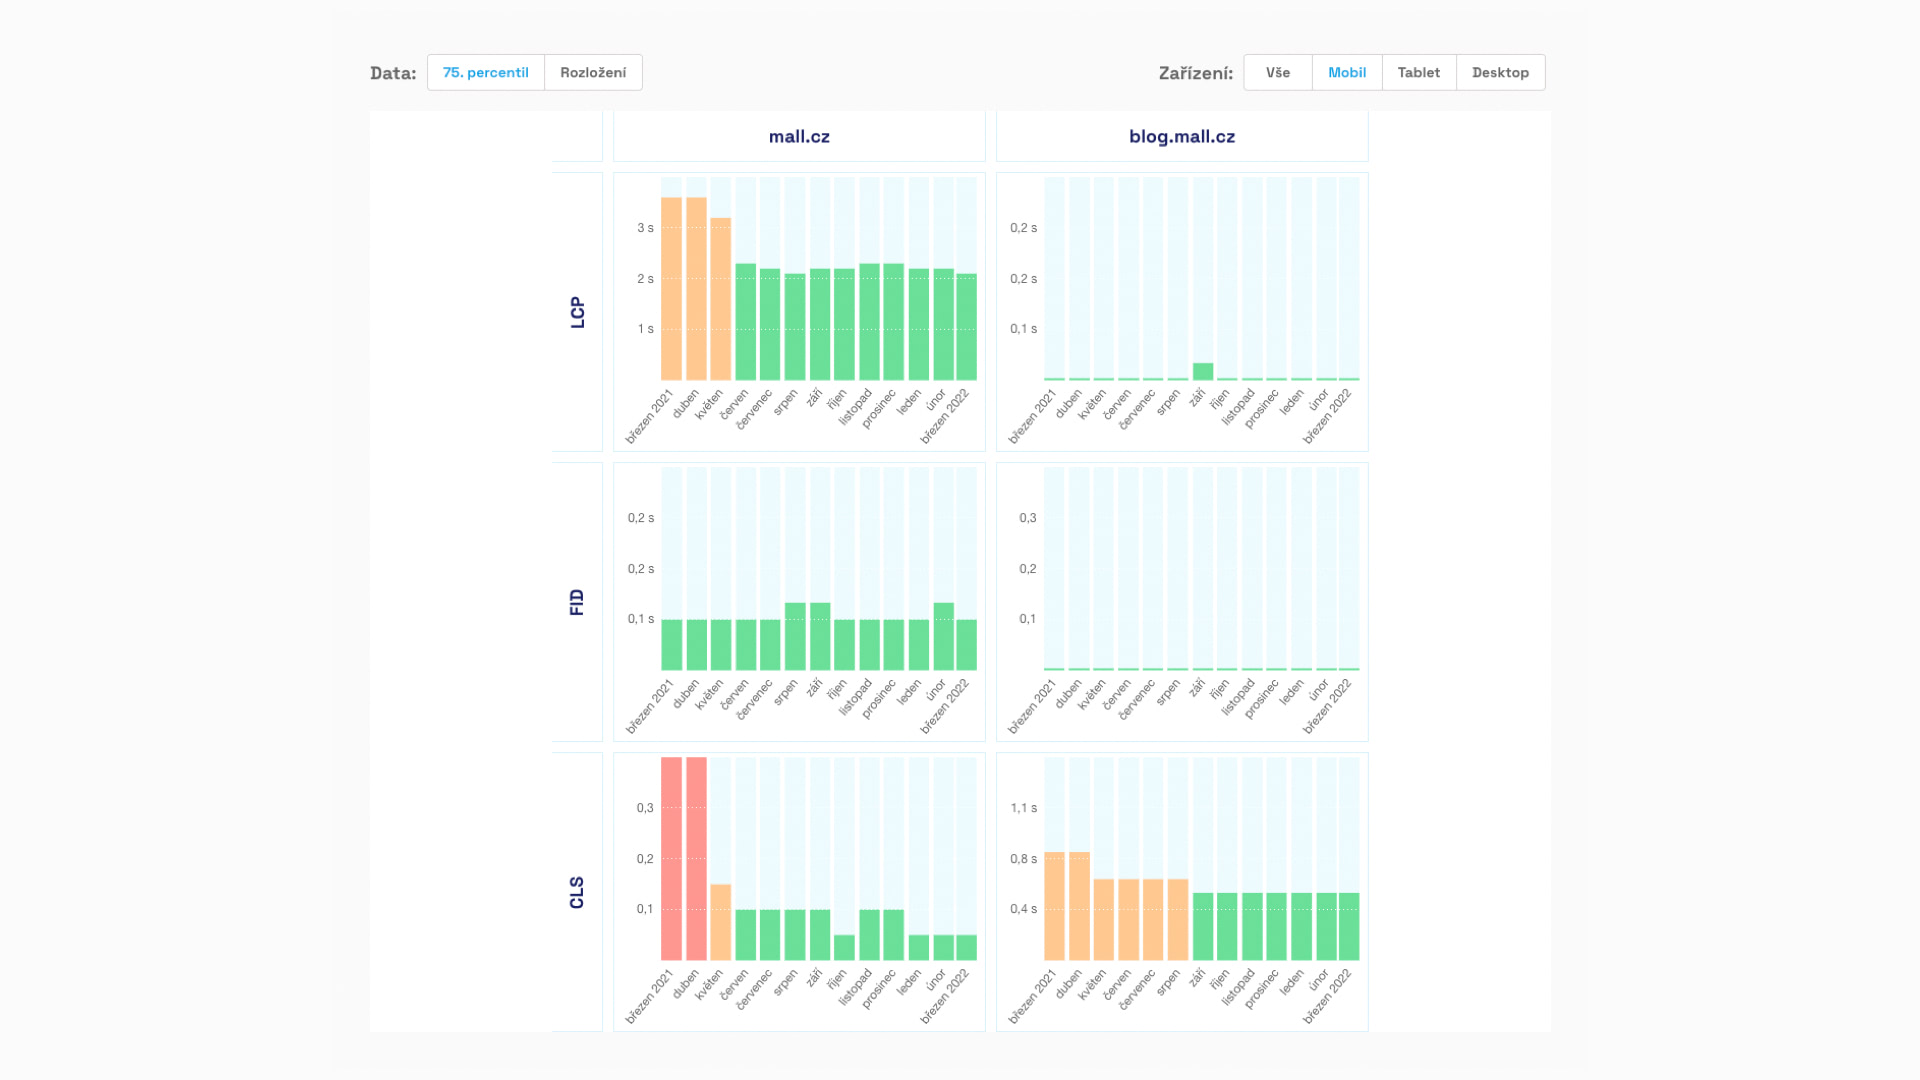
Google provides these figures with a delay, and they slightly differ from the last 28-day data used for page evaluations. Still, they excel at illustrating speed trends and thus the impact of optimizations or, regrettably, the lack thereof.
The graph above shows that mall.cz had very poor LCP and CLS metric values a year ago, but the situation has significantly improved since then. The "green" CLS value in March confirms that this metric was satisfactory for the entire domain mall.cz on mobile not long ago.
It seems that something undesirable happened with Cumulative Layout Shift on mobile only in the past month.
With this knowledge of domain metric status, we could be content, but I'll recommend another viewpoint from the indispensable Google Search Console.
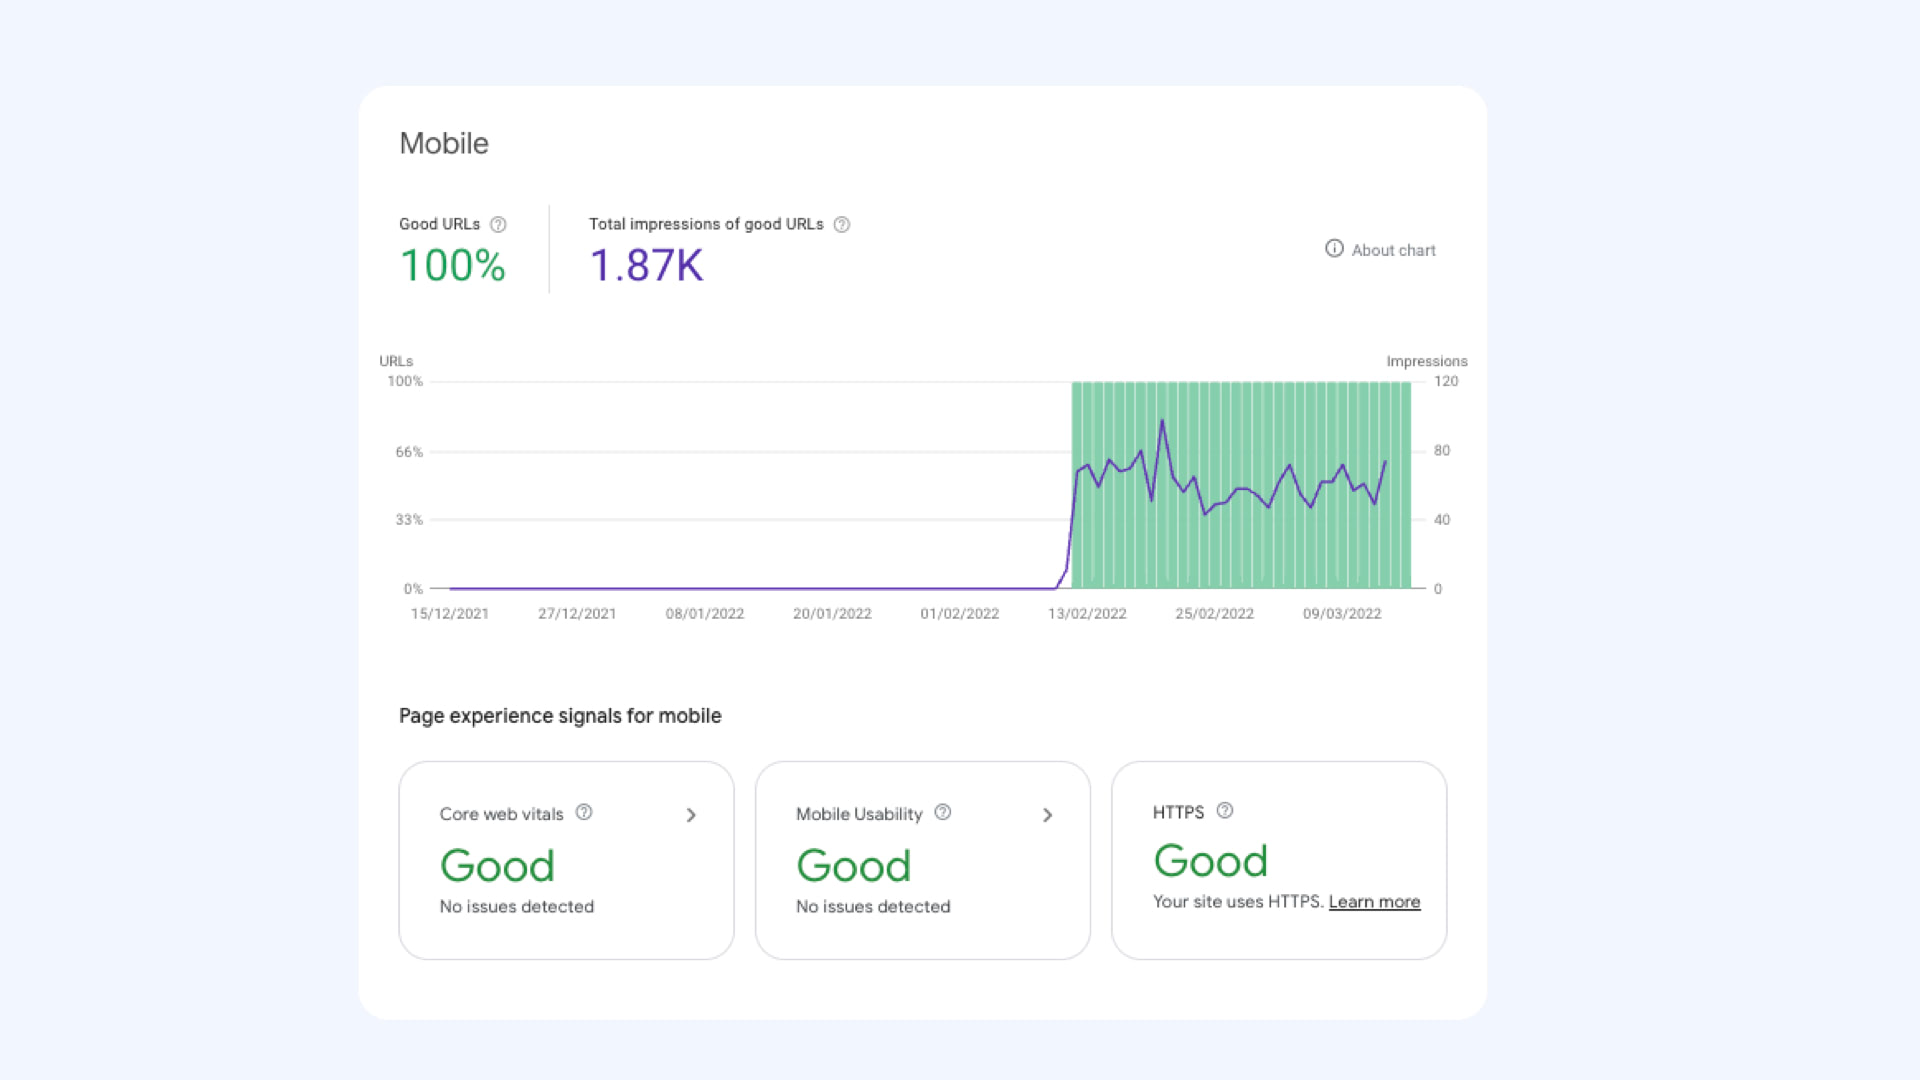
In the Page Experience section, Search Console displays a graph showing the number of URLs meeting the area's evaluation signals. This includes not only speed but also mobile usability or security level, which is the recently "hyped" HTTPS within the SEO community.
In the graph above, the client improved due to our optimizations, and in one day, the values jumped from zero to a hundred percent. You'd need a bit of luck to see such a graph. Usually, it's much more "zigzagged", with values changing over time.
Moreover, this graph is highly susceptible to various distortions — both in terms of data delay and different bugs on Google's side. Therefore, we mainly focus on long-term trends and don't panic over day-to-day fluctuations.
Let's recap what we know: the mall.cz domain has a poor CLS metric value on both mobile and desktop. On mobile, it has significantly worsened in the last month.
Second Step: Page Groups
At this stage of measurement, Search Console is practically indispensable. Google doesn't make this data available externally through its API. I hope this is only temporary and that we'll soon be able to work with it sensibly from outside.
Anyway, what I'm about to show you is visible in the Web Vitals section. There are reports available for both mobile and desktop, all related to page groups as internally divided by Google.
In the first step, we see a somewhat confusing graph with yellow, orange, and green lines:
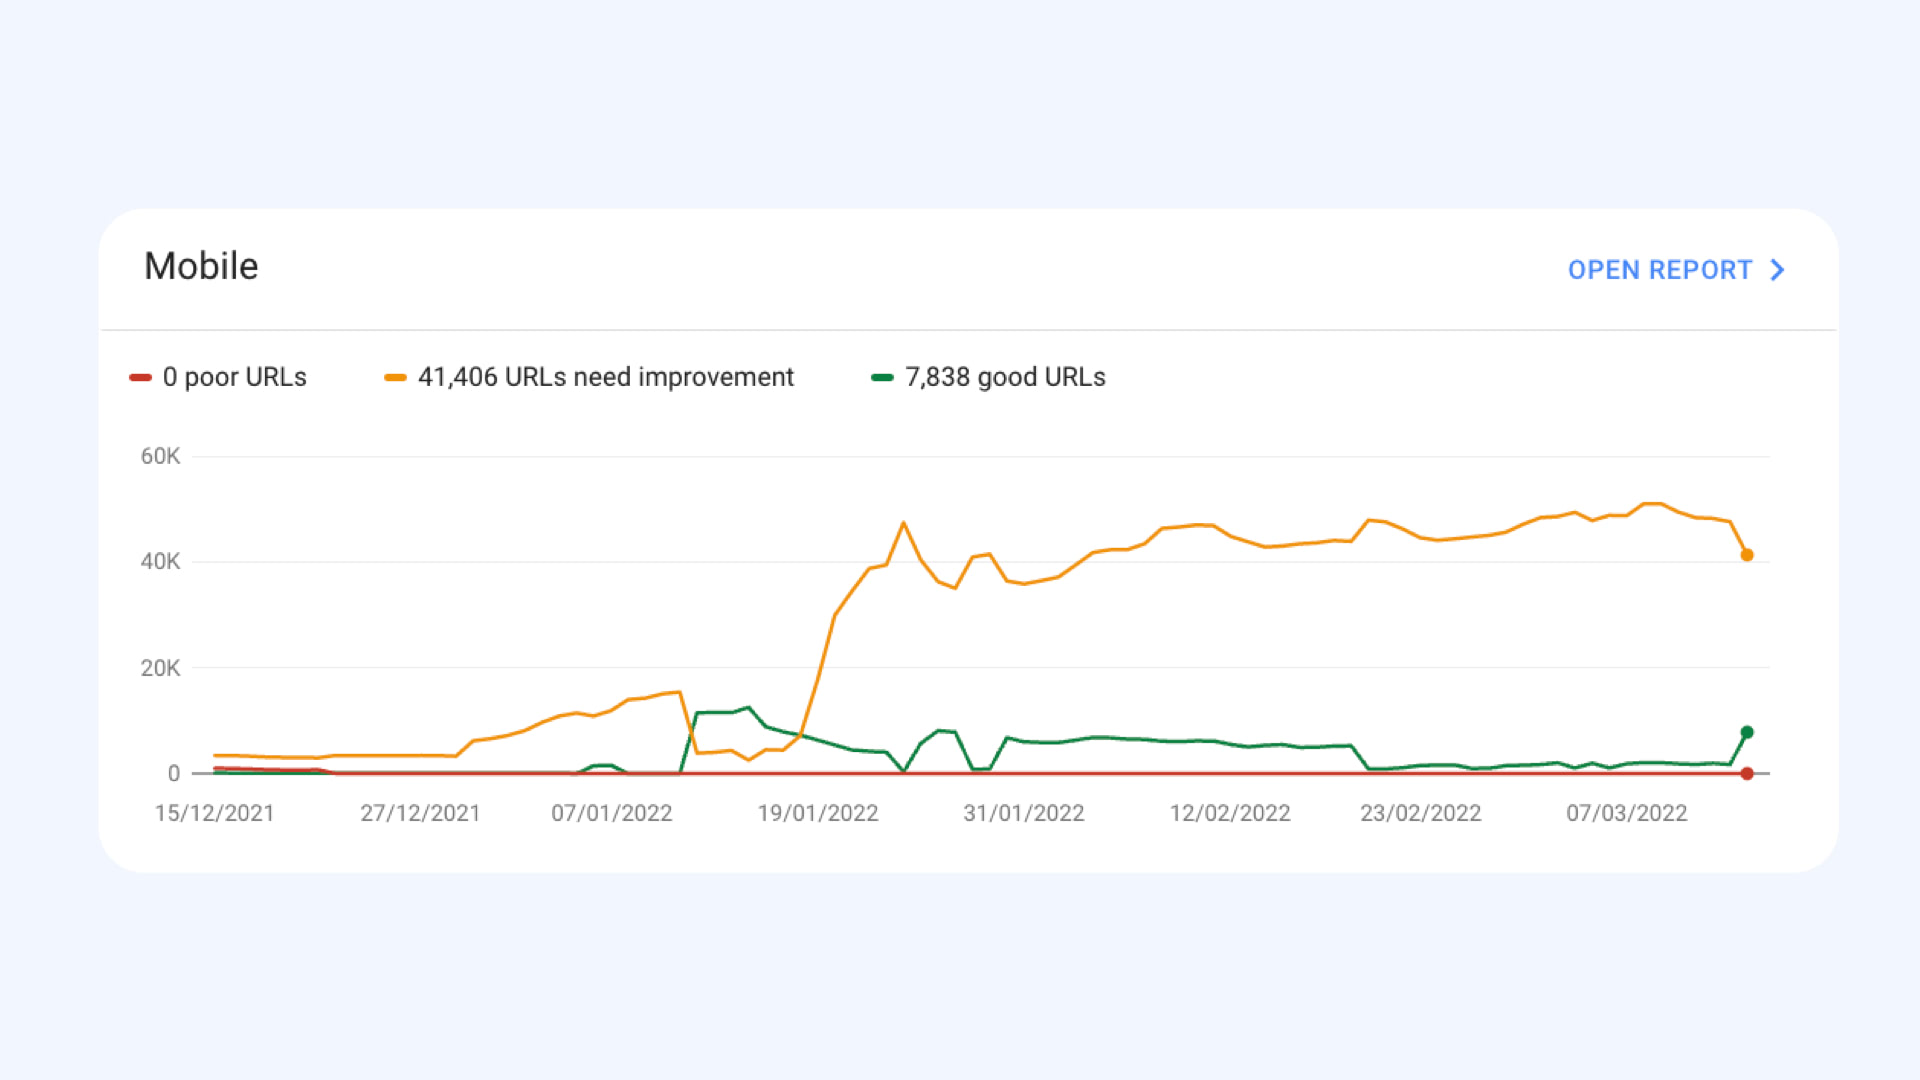
The issue with this graph is that it doesn't show the development of website speed but only the number of URLs in groups that meet all metrics (green) or have at least one orange or at least one red.
Since it concerns the number of URLs, graphs may appear to worsen even if, for instance, more addresses are included in a URL group. In reality, nothing is deteriorating; the number of pages is simply increasing.
However, it's bad if, at some point, the green decreases and the orange or red increases. That could be a reason for concern about speed.
Of course, these graphs also suffer from various distortions, delays, and who knows what else… It’s good to have other regular measurements that verify whether there really was a sudden change.
When you click on the graph, you see a breakdown for specific devices and specific metrics:
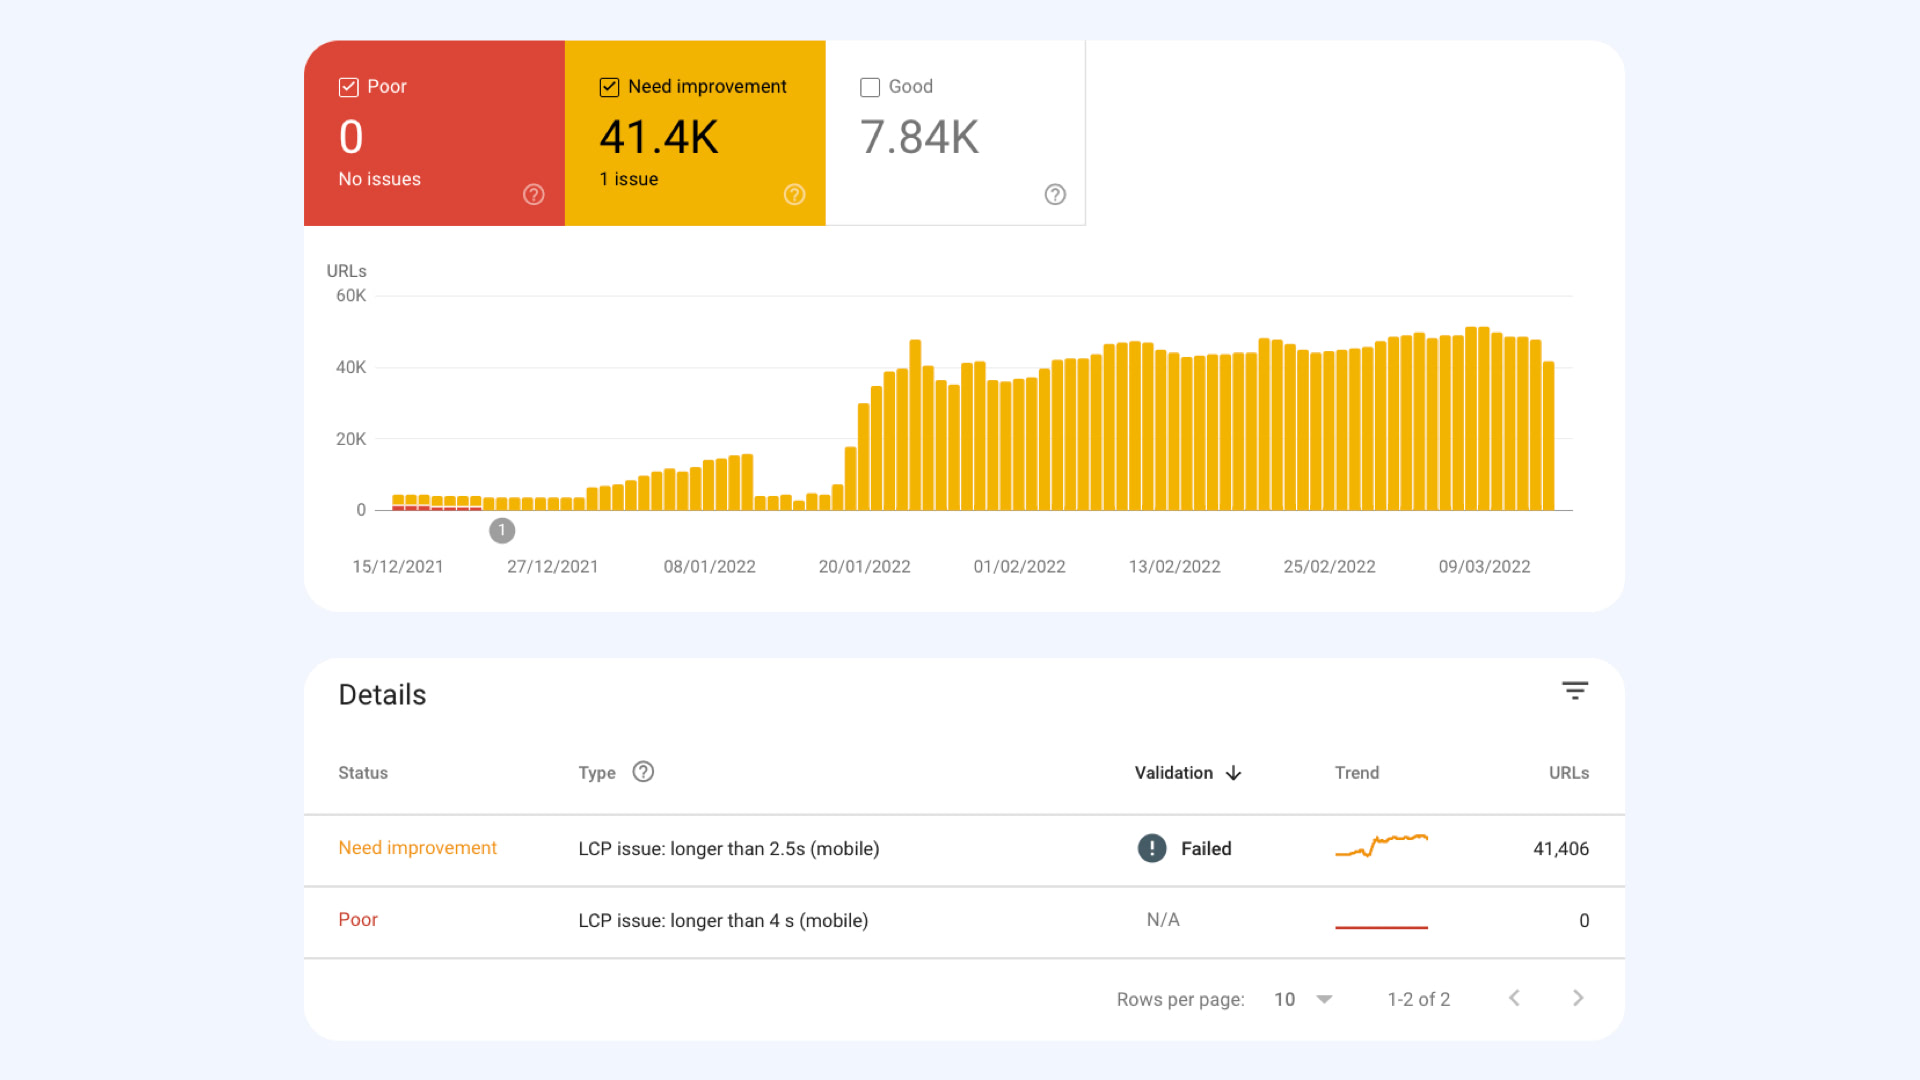
This graph shows us which metrics are problematic in the domain groups and how many URLs are affected.
In this particular graph, it's the LCP metric and orange values (2.5 – 4 s). If we had access to the Search Console for Mall.cz, we'd likely see issues mostly with CLS here.
You can further explore this report until you hit the core issue, namely the list of URL groups with this metric value:
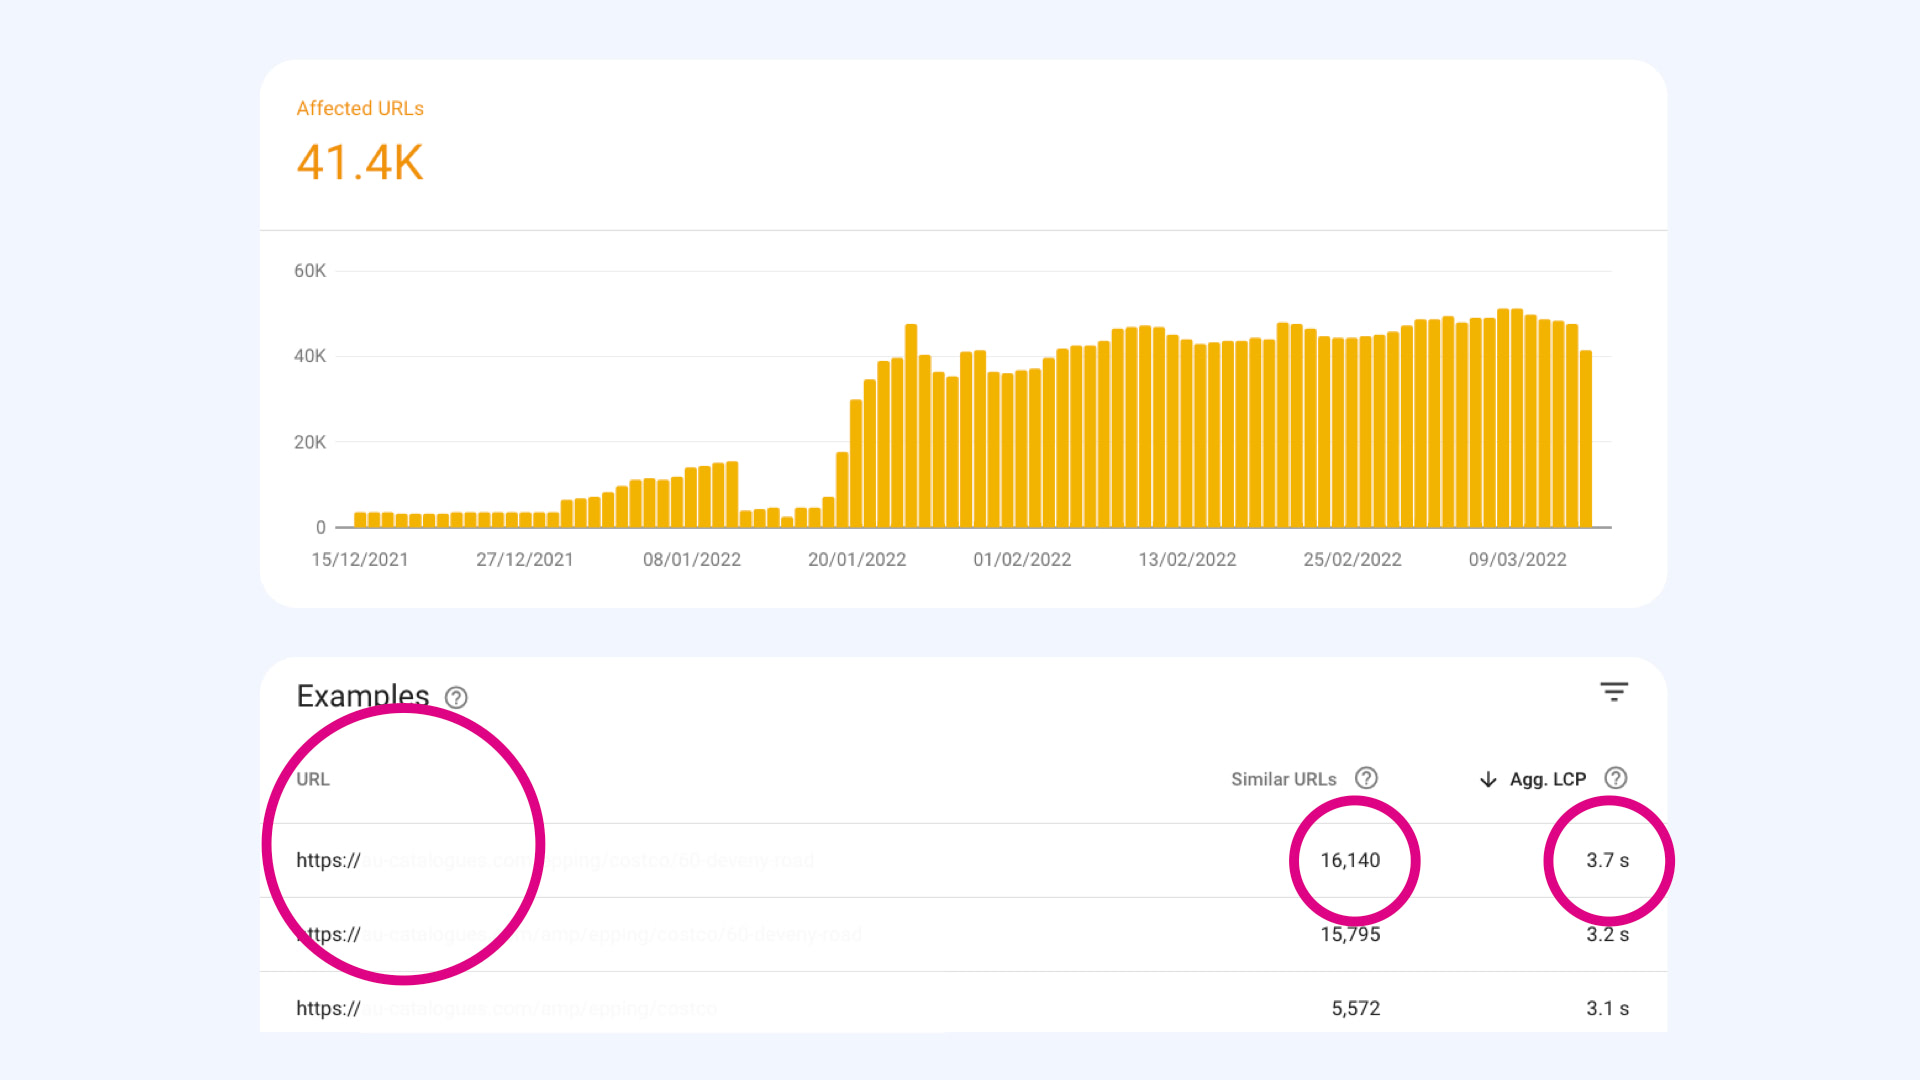
In the image above, I've hidden specific URL addresses, but you can surely imagine them there.
This is an excellent report because it not only reveals page groups but also their frequency and "aggregated metric value". The more represented the group and the worse its metric value, the more critical its optimization becomes.
Google Search Console also provides many example URLs, allowing us to test them directly in the browser or set them up for regular monitoring, which we'll do in the next step.
In the second step, we've identified which page groups have the most significant impact on the poor metric (in Mall.cz's case, it would be CLS), making their optimization a priority.
Third Step: Specific URLs
Selecting the right URLs to monitor is crucial for the success of the entire speed measurement. Here are a few tips:
- Identify key page types that are crucial for you and represent important content. For example, on an e-commerce site, this might be the homepage, product detail, category, blog post, or contact page.
- Choose representatives from common address groups offered by Search Console.
- Select URLs with the highest traffic from this group.
- Preferably choose pages with their own Web Vitals evaluation in CrUX.
Our tester allows you to enter up to five URLs, which should suffice even for larger sites. For Mall.cz, this will be somewhat of a guessing game (since we don't have all the data), but we've selected these pages:
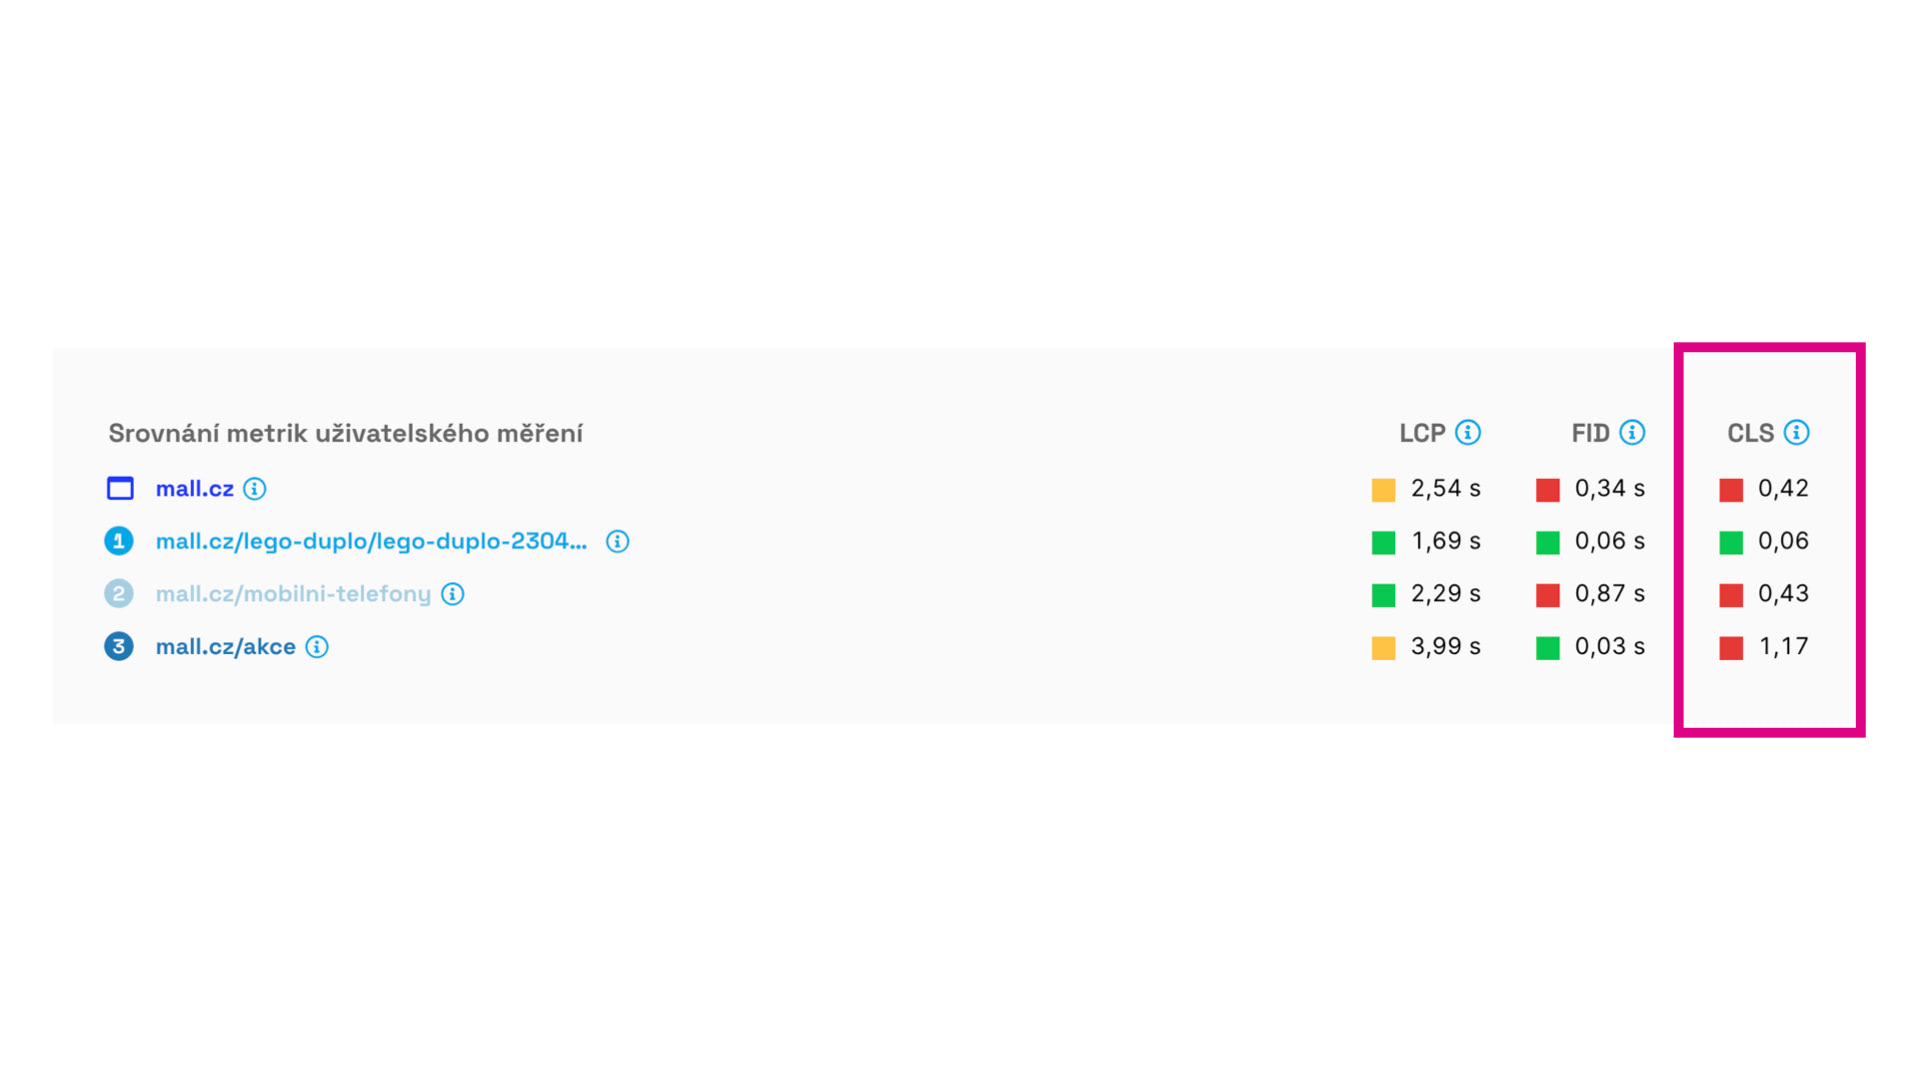
The test image shows that the problematic CLS is mainly in the category (/mobilni-telefony) and then on the /akce page. We also see a poor value on the homepage, but since it's just one, it won't significantly impact the domain's evaluation. We must optimize it, but it's not a priority.
Regular Monitoring
Once we have these addresses entered into the tester, they will be measured regularly, in our case, daily. This is a service we provide for free, so don't hesitate to use it.
The daily monitoring graph looks something like this:
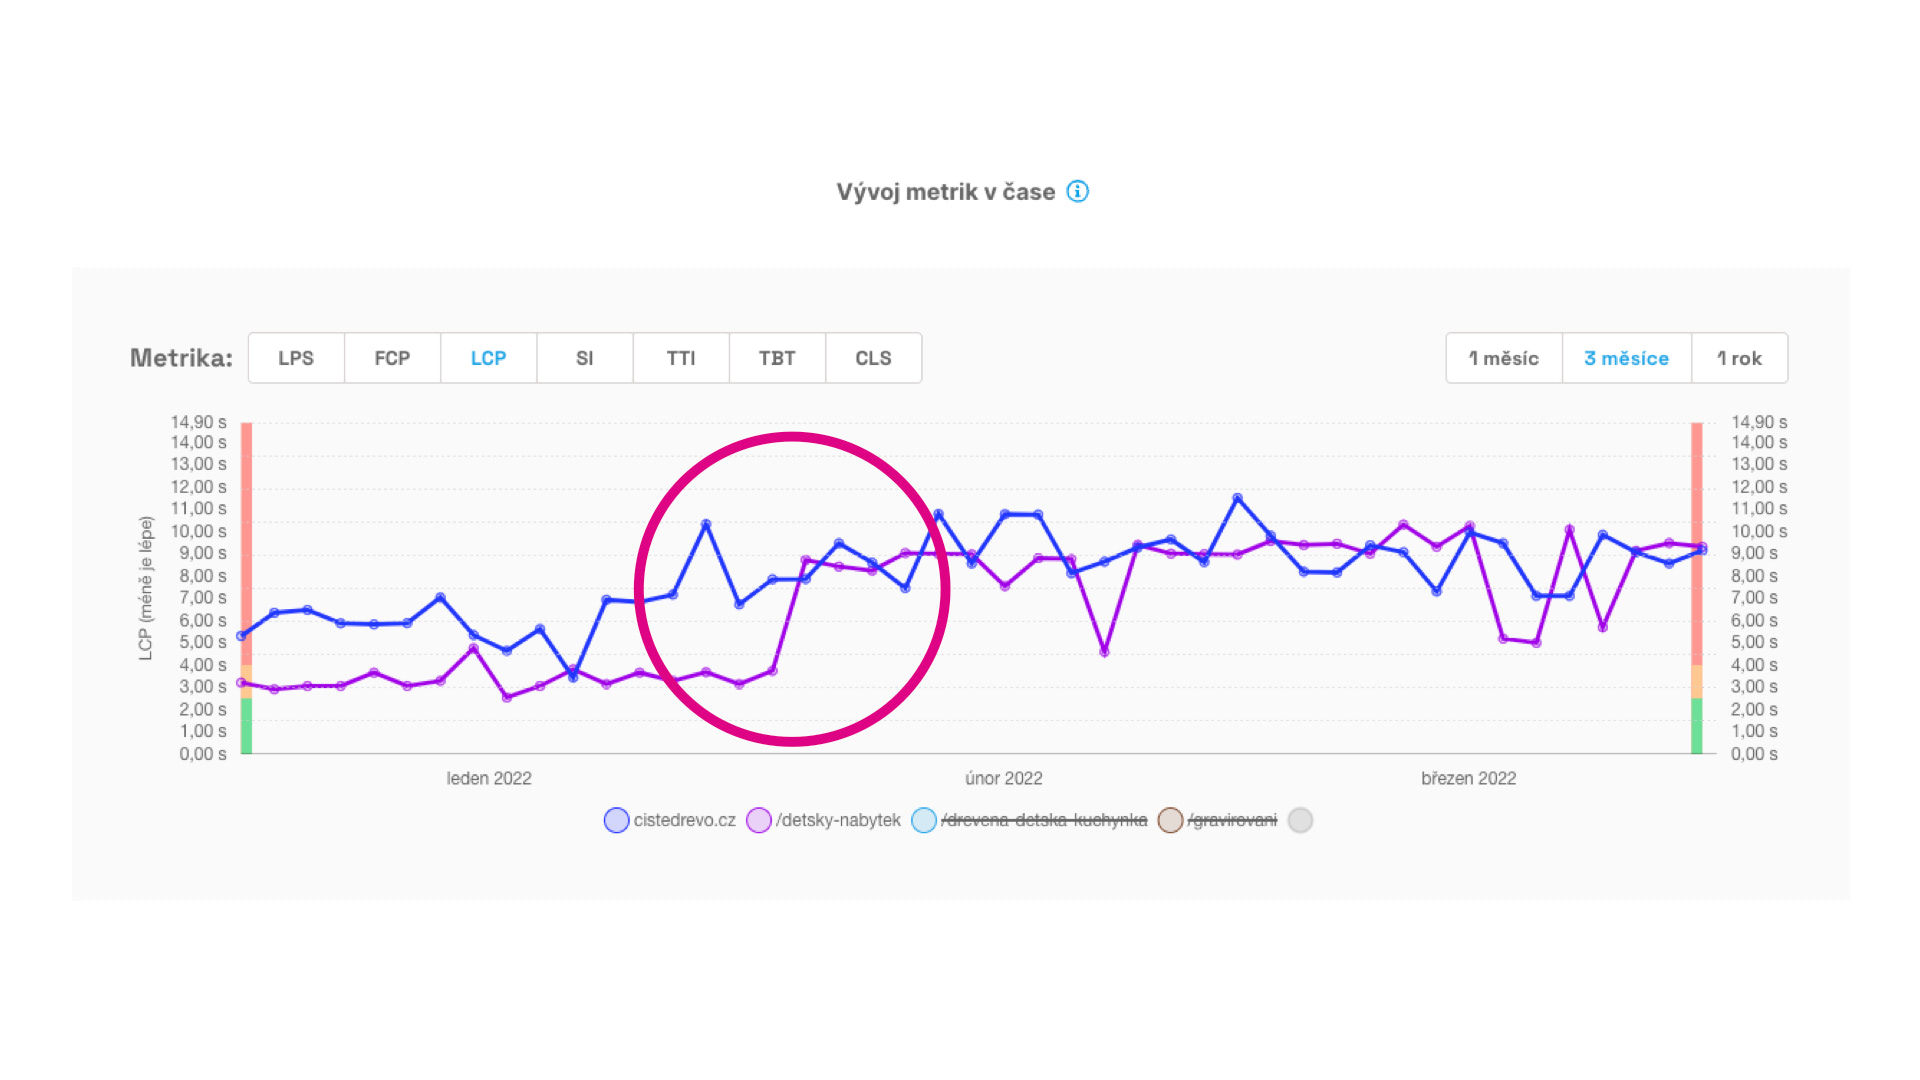
The graph shows that the client's LCP metric worsened on one of the pages. It happened at the beginning of February, making it easier for us to trace the cause. (In this case, the cookie consent banner is problematic.)
So, in addition to a long-term view of domains and page groups, we now monitor specific URLs daily. This allows us to identify problematic metrics as well as the date they worsened, pointing us to the likely cause.
Output from Website Measurement
We have now measured the domain, page groups, and specific URLs. You can provide developers with this concise output for optimization:
On the mall.cz domain, the CLS metric is problematic:
In CrUX, values are 0.13 for mobile and 0.26 for desktop.The most important groups for optimization and URL examples are:
…Measurement links:
Search Console: …
PageSpeed.ONE: …
PageSpeed Insight: …
Yes, it could be as simple as that.
Now, if only we could figure out how to fix it…
Should Marketers Attempt to Provide Recommendations to Developers?
I believe most marketers understand data and its interpretation well but lack deep knowledge of browser functionality or various frontend technologies.
There are general recommendations from tools like Lighthouse or PageSpeed Insights, but they may only work well for some websites, usually those not yet well optimized.
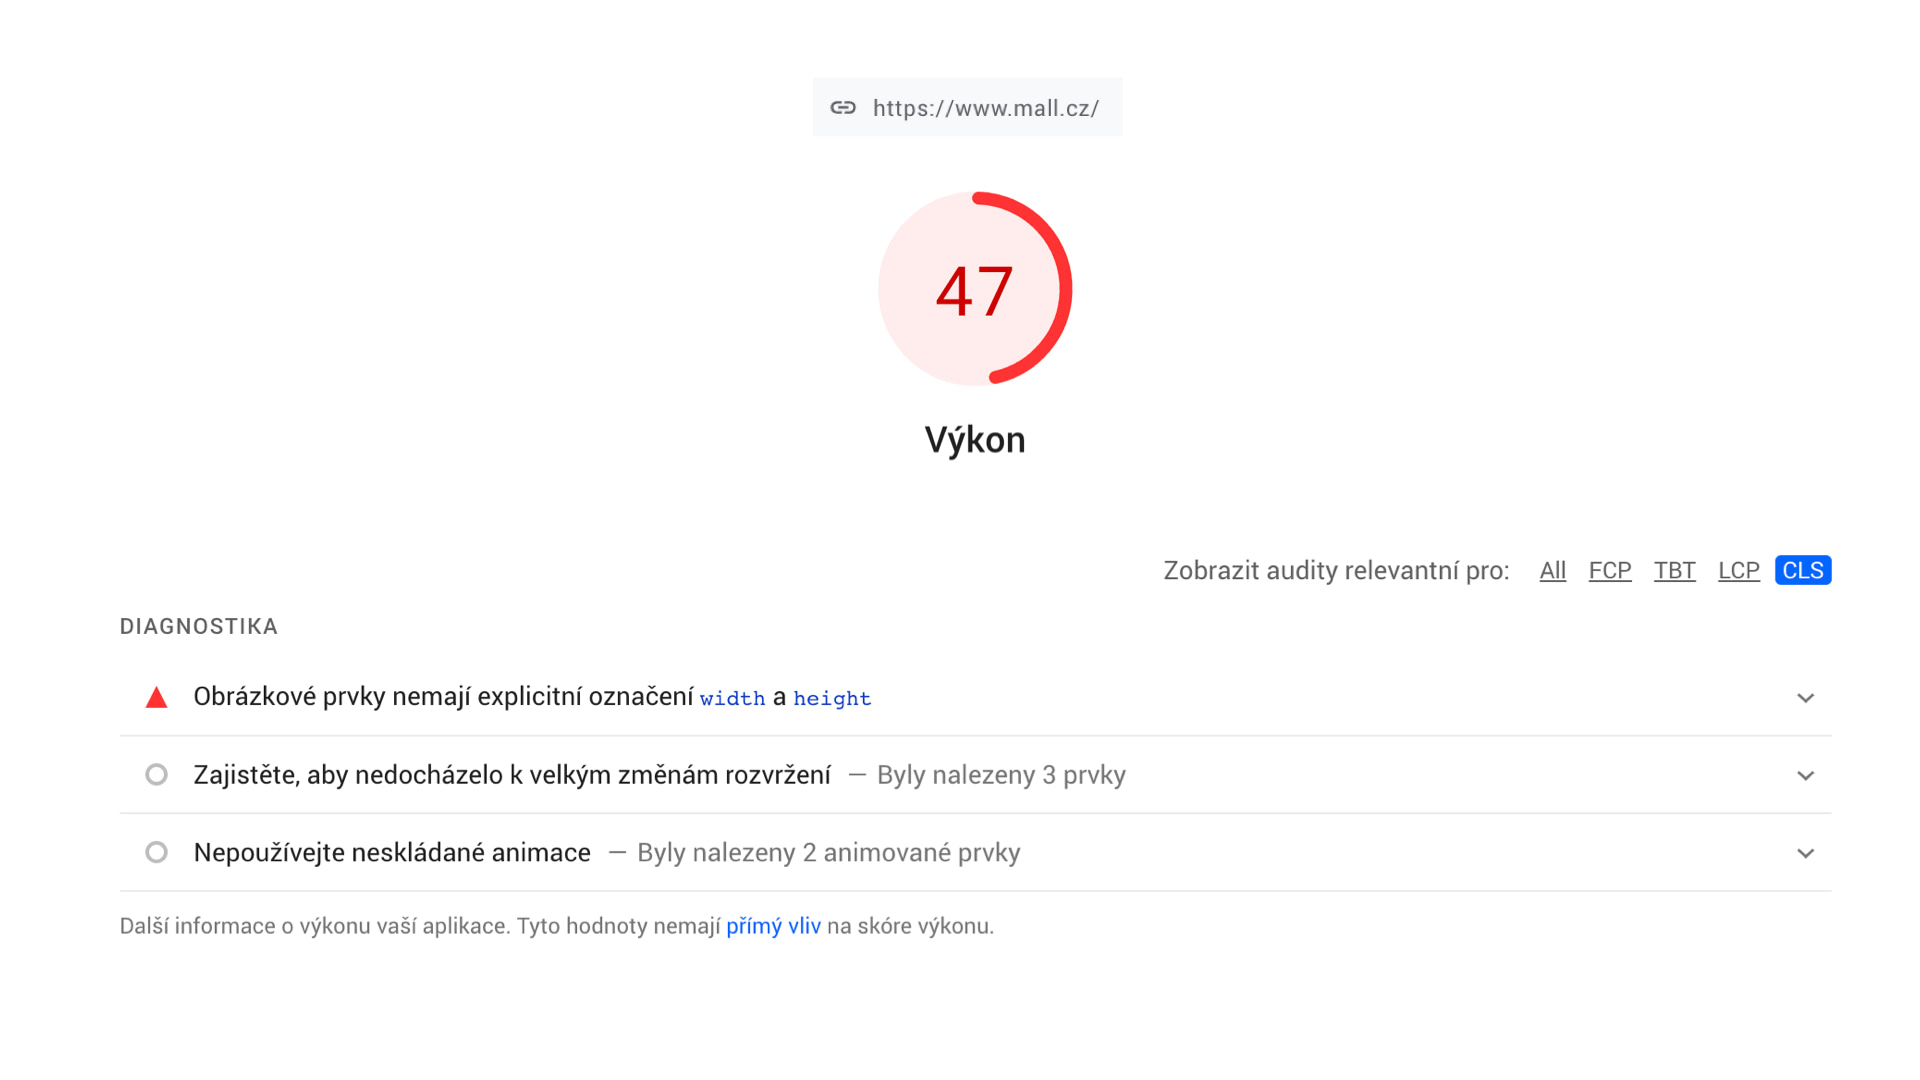
It's essential to realize that Lighthouse doesn't know the human and technological context of your project, so certain advice might miss the mark completely.
From our experience, Lighthouse advice tends to be very demanding to implement. The goal of optimization should be to seek "low-hanging fruit", meaning changes that yield the most significant effect for the least cost.
Such adjustments should ideally be identified by developers working on the project. However, we increasingly see with clients that the ability for quality, efficient development often conflicts with speed optimization skills.
Of course, you might be lucky, and your developers handle performance entirely on their own (we know such cases!) or even luckier if your marketer, designer, or product manager possesses these skills (we know such cases too).
Otherwise, feel free to reach out, and we'll be more than happy to assist you. ;)
Stay informed about your website's speed.
Subscribe to our newsletter. Each month, we share the latest in website speed for site owners, marketers, and developers.
Tags:SEOMeasurement