Monitoring Website Speed with PageSpeed.ONE (Tutorial)
 Martin Michálek9/30/20225 minutes reading
Discover how to effectively monitor your website's speed using our speed tester. It's easy and the tester is available for free.
Tip: If you prefer a video tutorial, watch the video; otherwise, continue reading below.
In recent months, we've launched the third version of our tester with new features, such as login capability, team collaboration, and speed monitoring for your websites in a dashboard.
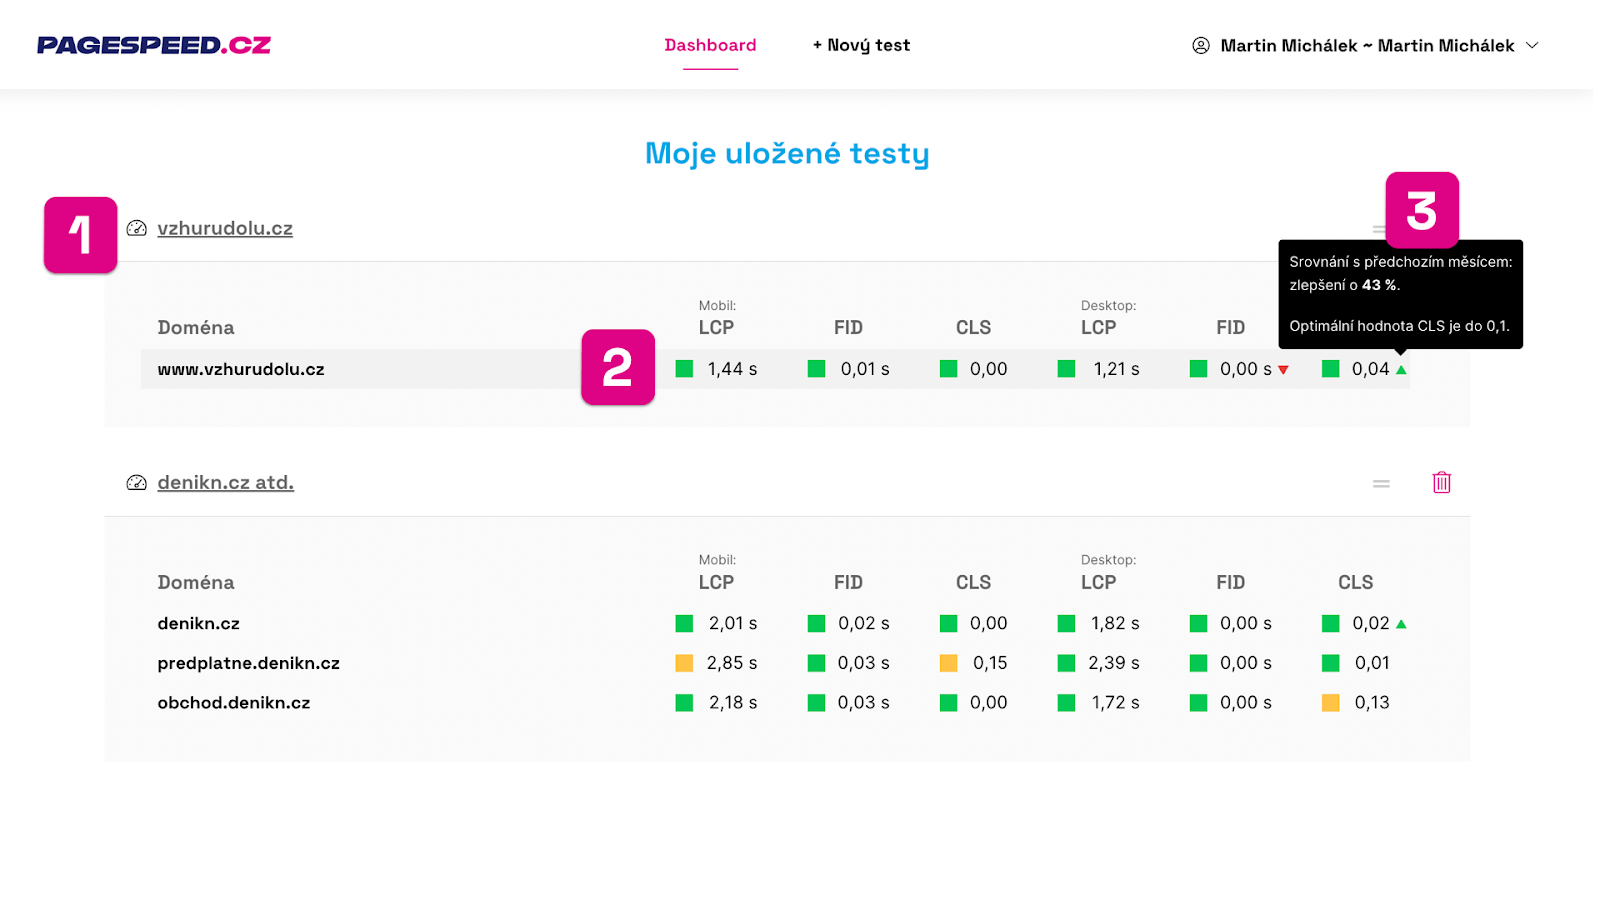
The dashboard presents all your tests (as shown in image number 1), each domain (2), the status of Web Vitals metrics from the Chrome UX Report, and any potential improvements or declines (3):
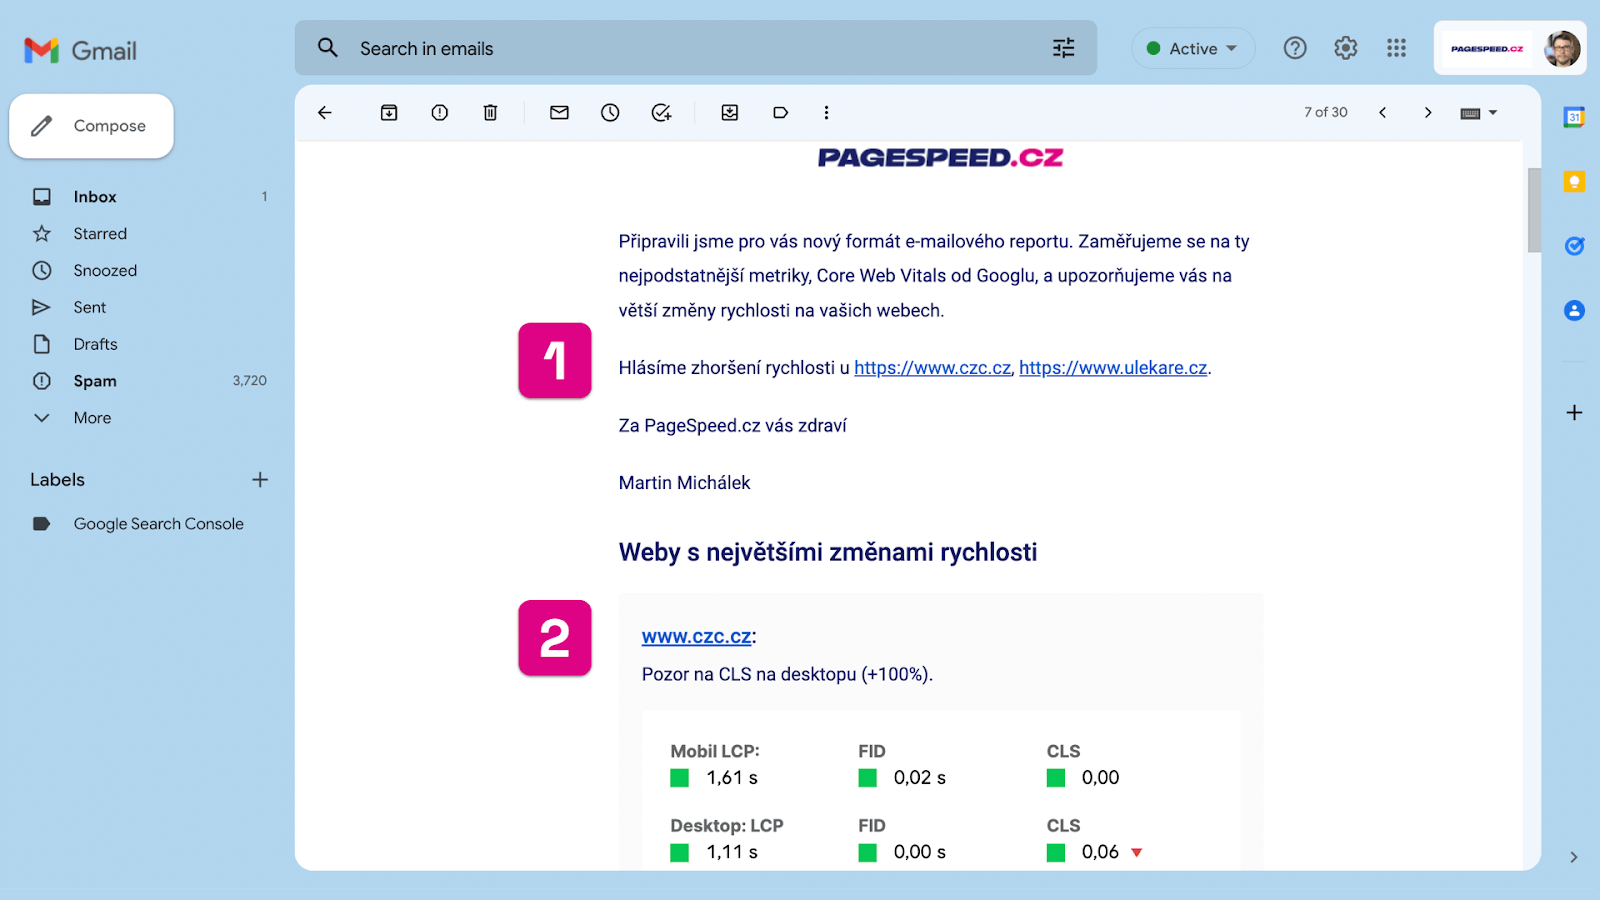
We have also recently adjusted the way email reports are sent. Each month, you'll receive an email detailing the most significant changes (as shown in image number 1) for the websites you monitor and a reminder of the current Web Vitals values (2):
Let's walk through how you too can achieve this convenient website speed monitoring.
Step 1: Register and Create a Team
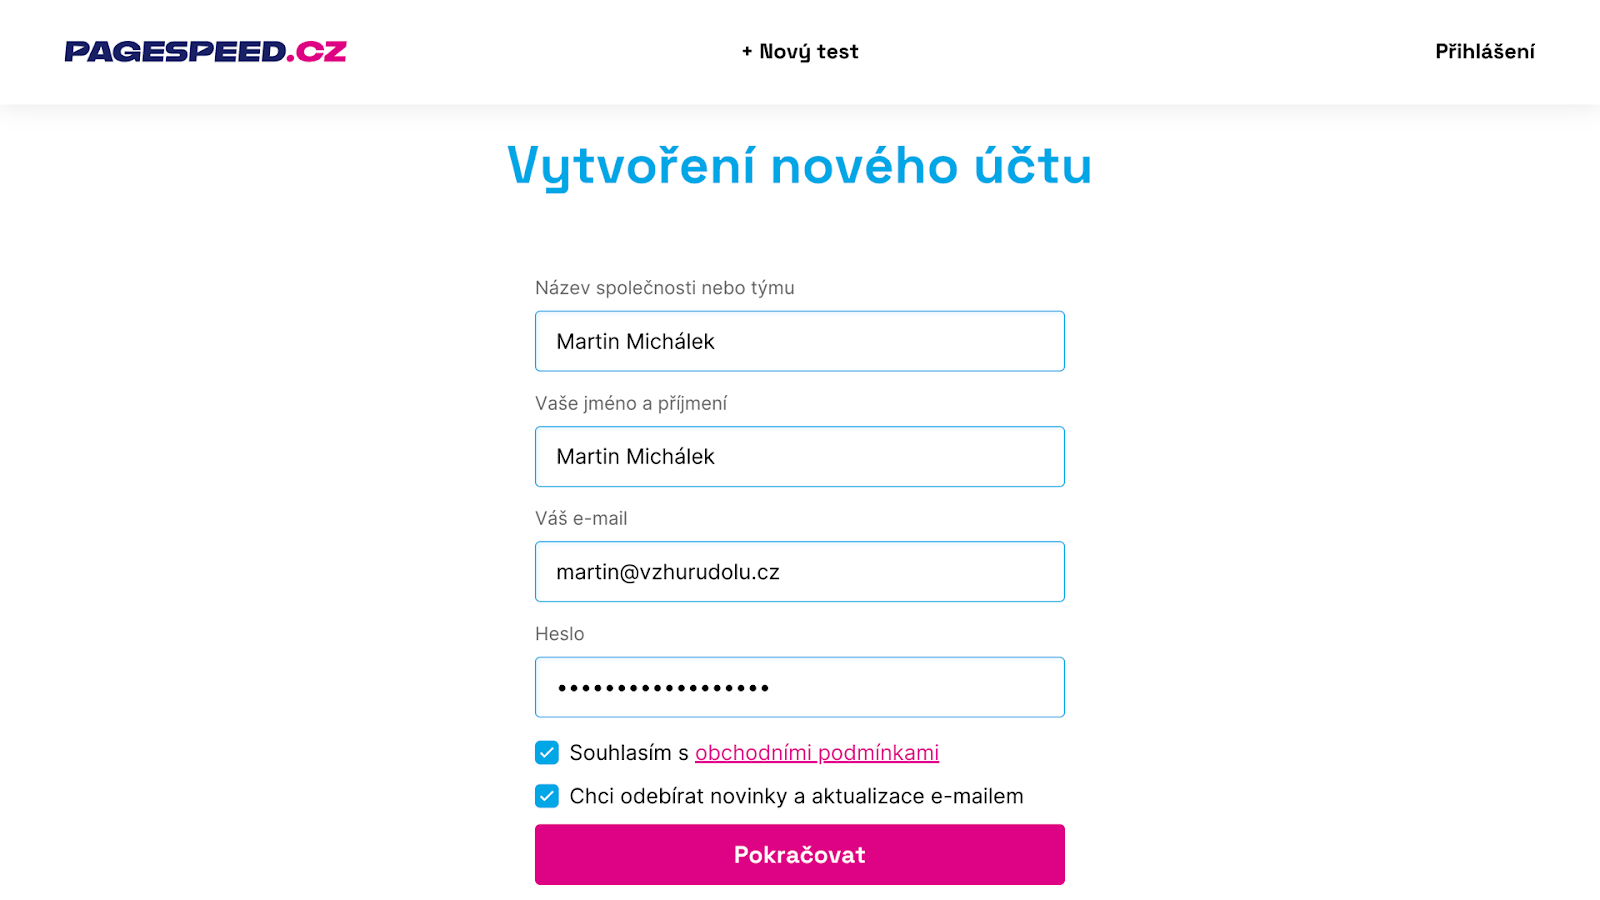
Creating a new account is free, as is the entire tool. Upon account setup, we'll ask for a team name, which can be your company's name or your own if you're working solo:
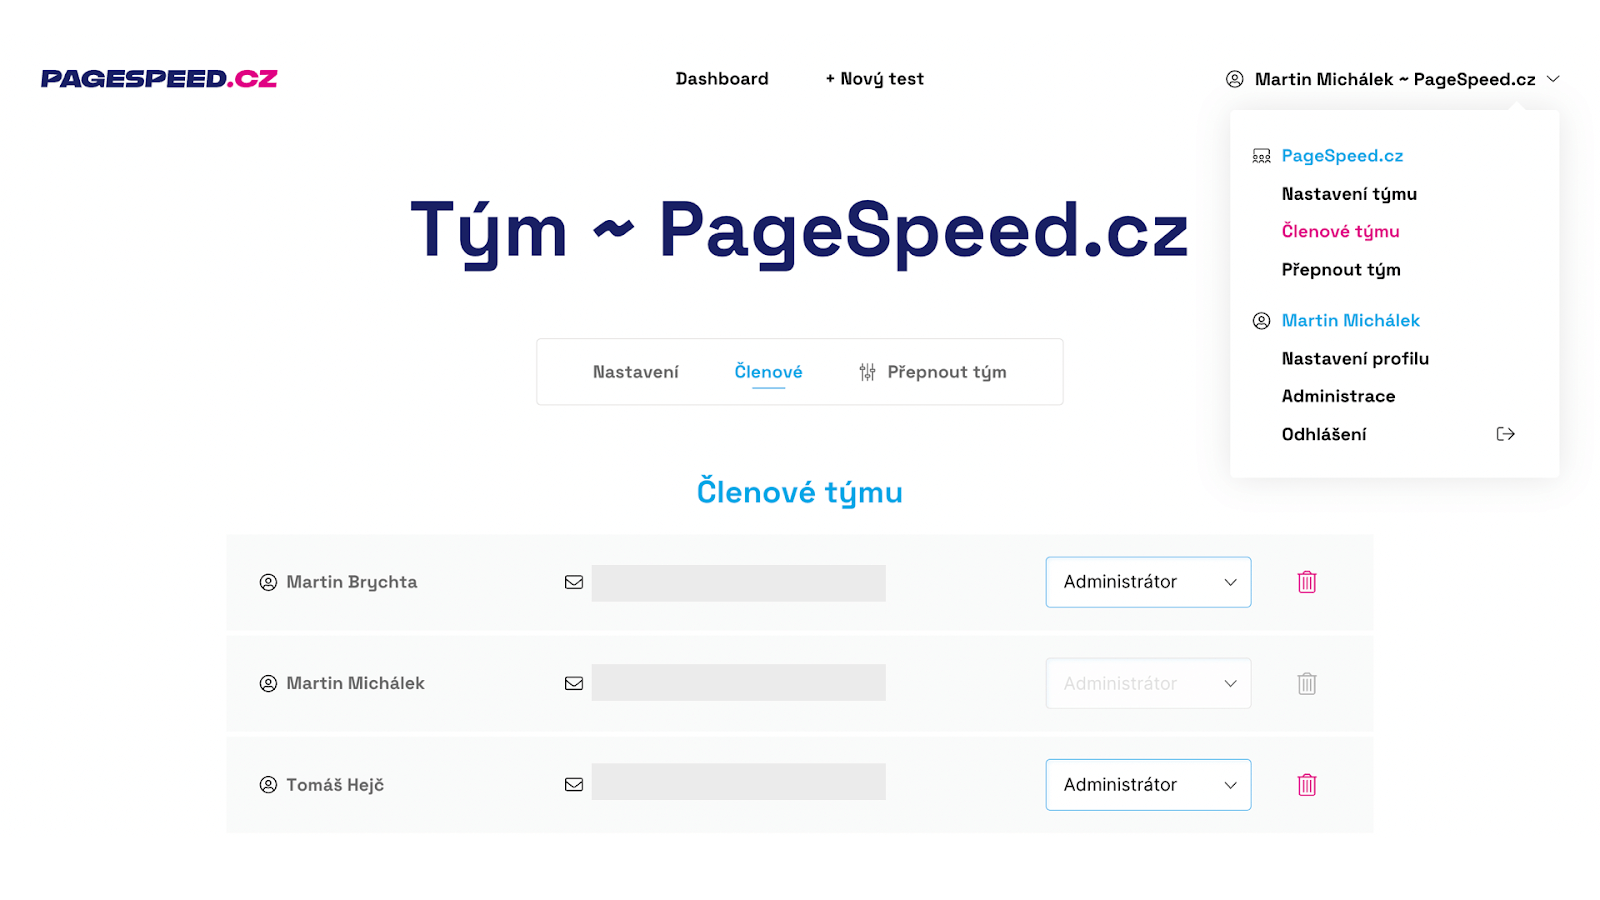
You can, however, set up multiple teams, for instance, one for each client. There is no limit to the number:

Within each team, you can invite users, colleagues, or clients and grant them various levels of permission, such as user management or read-only access:
With that step complete, let's move on.
Step 2: Add Tests to the Dashboard
If you're already using our tool, you likely have some tests set up. Test URLs remain valid indefinitely – provided you visit them at least once every two months, as they won't be deleted.
Creating a new test is straightforward:
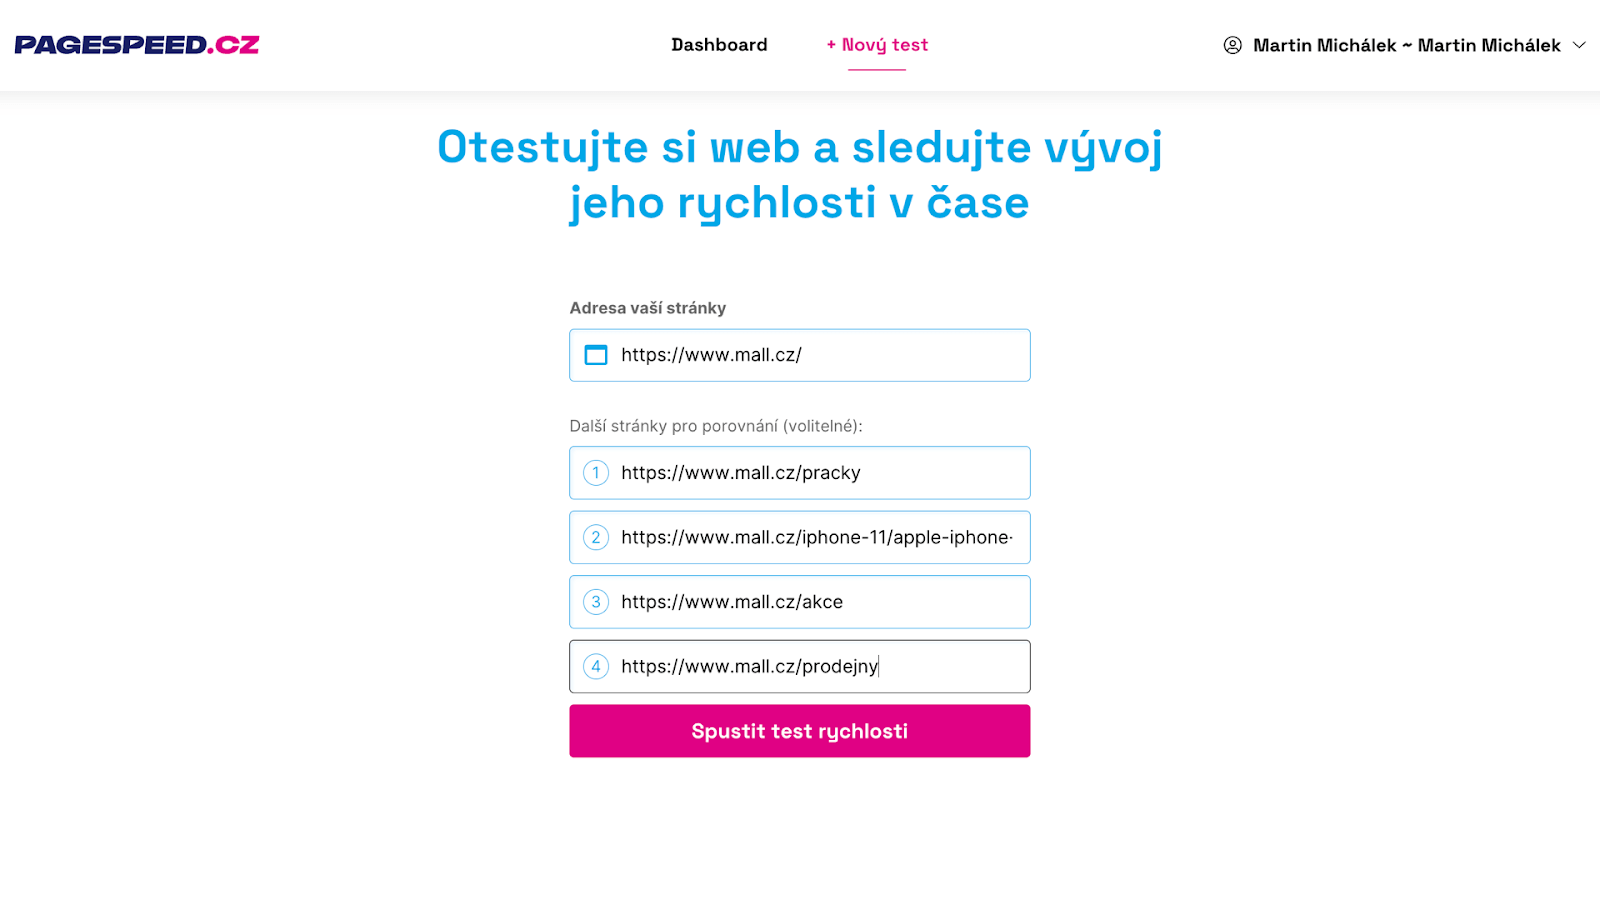
How to choose a URL?
- If you're testing a single website, select the homepage and then the most visited representatives of each page type. For an e-commerce site, this would be categories, product details, and perhaps a contact page. Google Analytics traffic data or Google Search Console data can assist in selecting suitable URLs.
- You can also opt to test multiple domains, such as comparing them with your competitors. Additional domains do not need to be entered immediately when creating the test. In the test settings, you can now add domains to the URLs later. But that will come in one of the following steps.
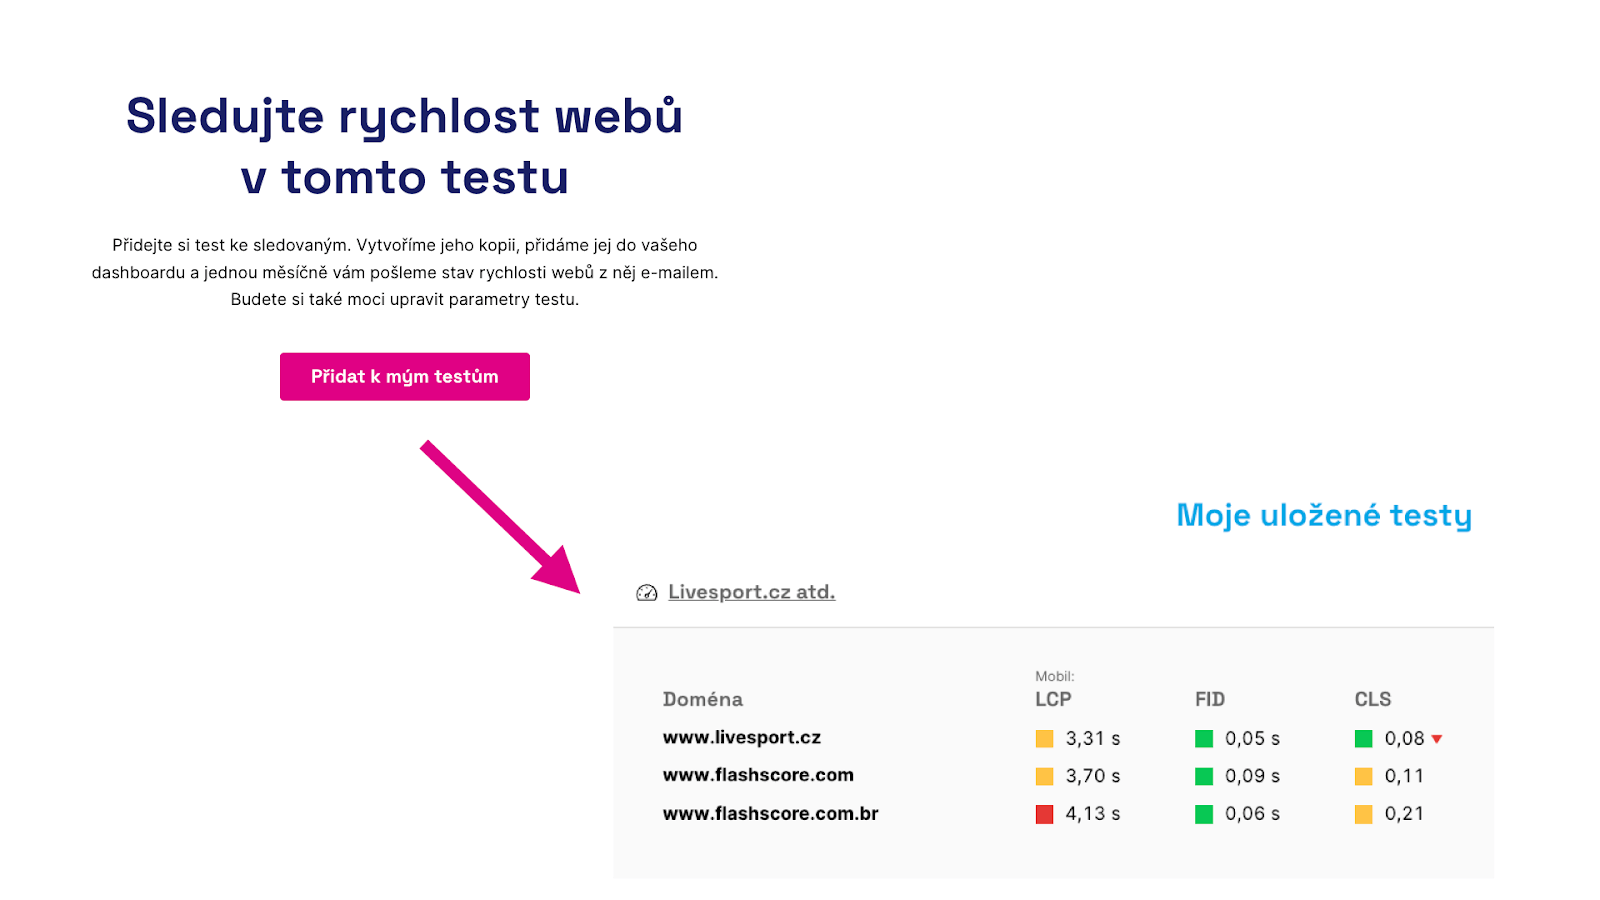
Once the test is created, add it to the dashboard to monitor website speed and adjust test settings.
Tip: Read more about measuring website speed using the PageSpeed.ONE tester and other tools.
To add a test to the active dashboard, simply scroll down any test page until you find the "Add to my tests" button:
Step 3: Monitor Speed Development in the Test
The test itself will provide interesting data about the speed of the URL you tested.
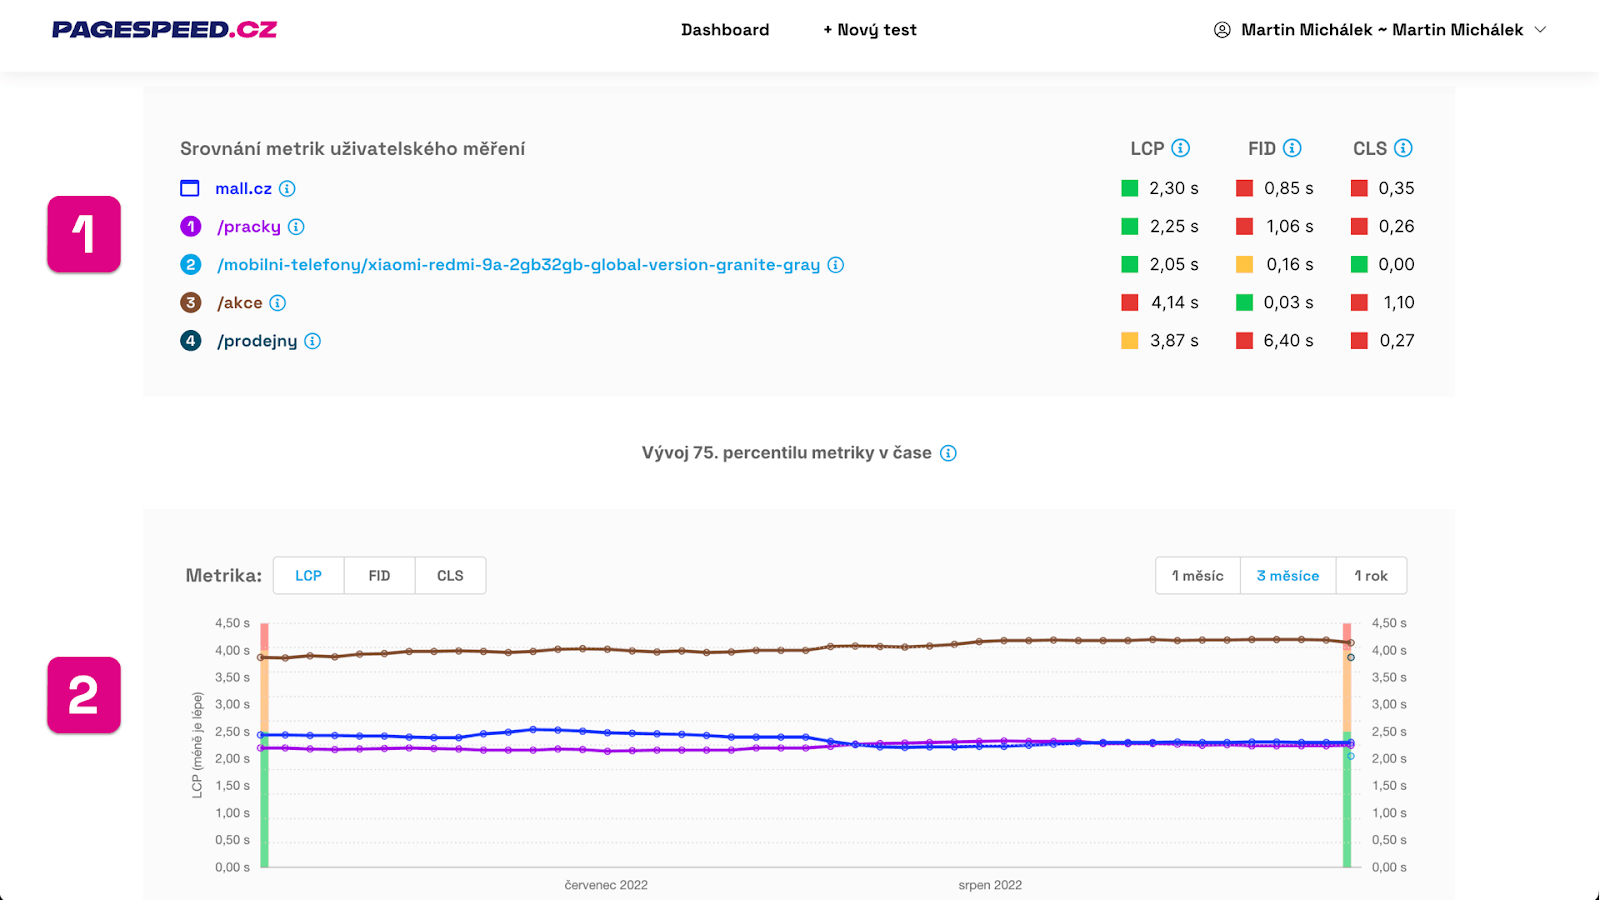
In the Pages tab, you'll see synthetic test data from the PageSpeed Insights API (tests using Lighthouse, see number 1 in the image below) or user data from the Chrome UX Report (2). These are available only if the URL has sufficient traffic:
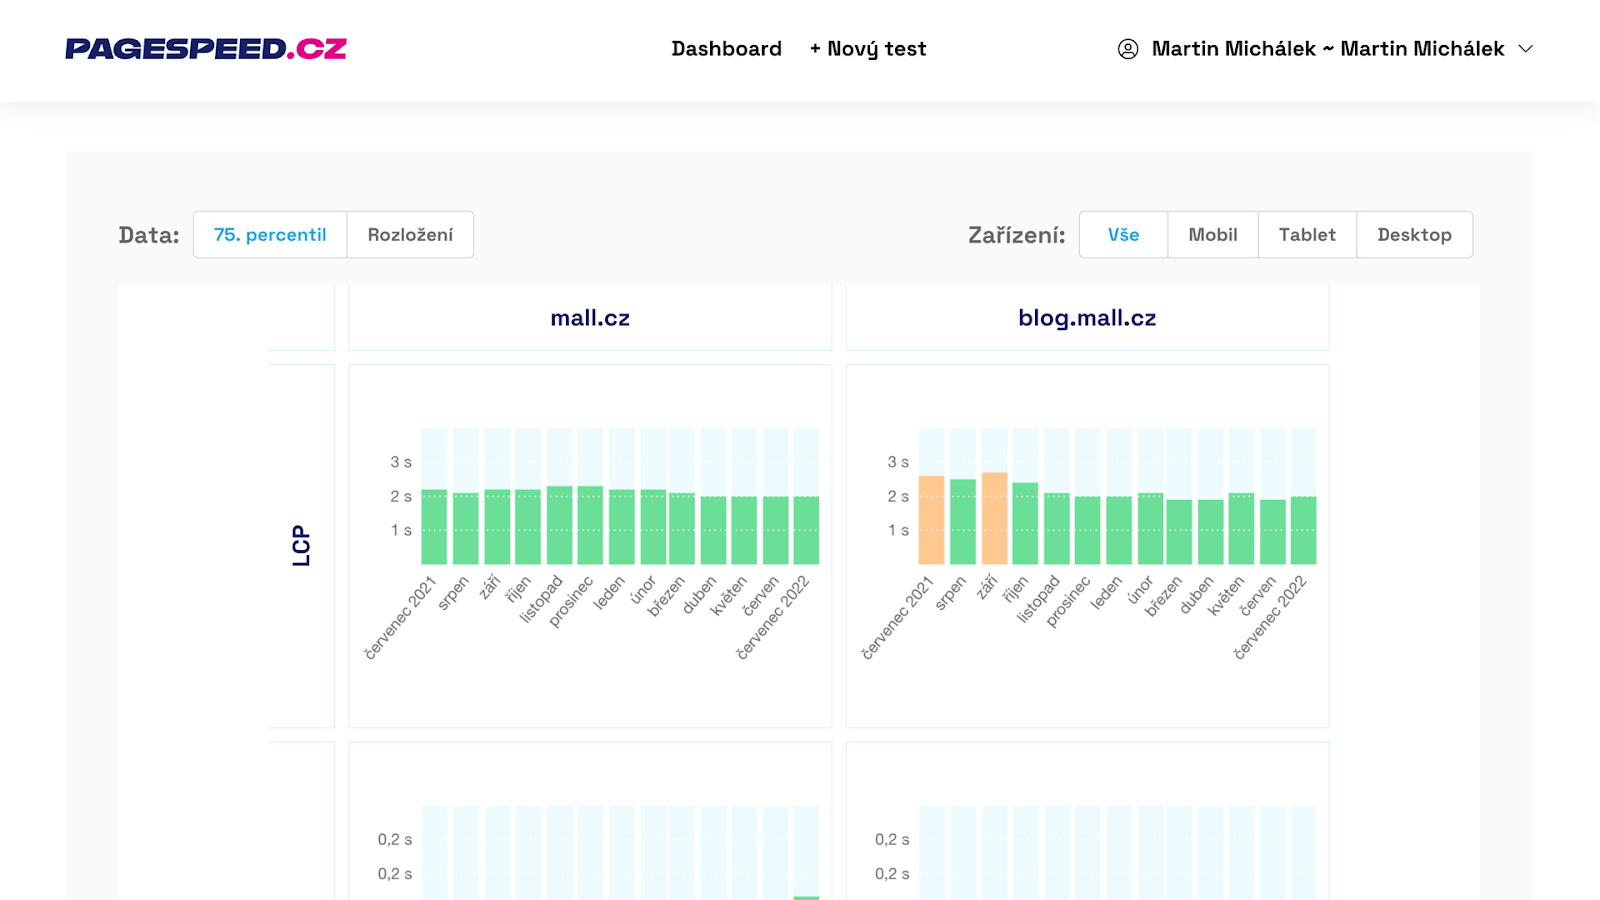
The Domains tab gives you an overview of data development from the Chrome UX Report over a longer, monthly perspective:
Step 4: Change Test Settings
The next step is optional. You may not be aware that by adding a test to your collection for monitoring in the dashboard, you and your team's administrators gain the ability to modify its settings.
Beyond changing the test name or its URL, we'll draw your attention to the section where you can add domains to the test:
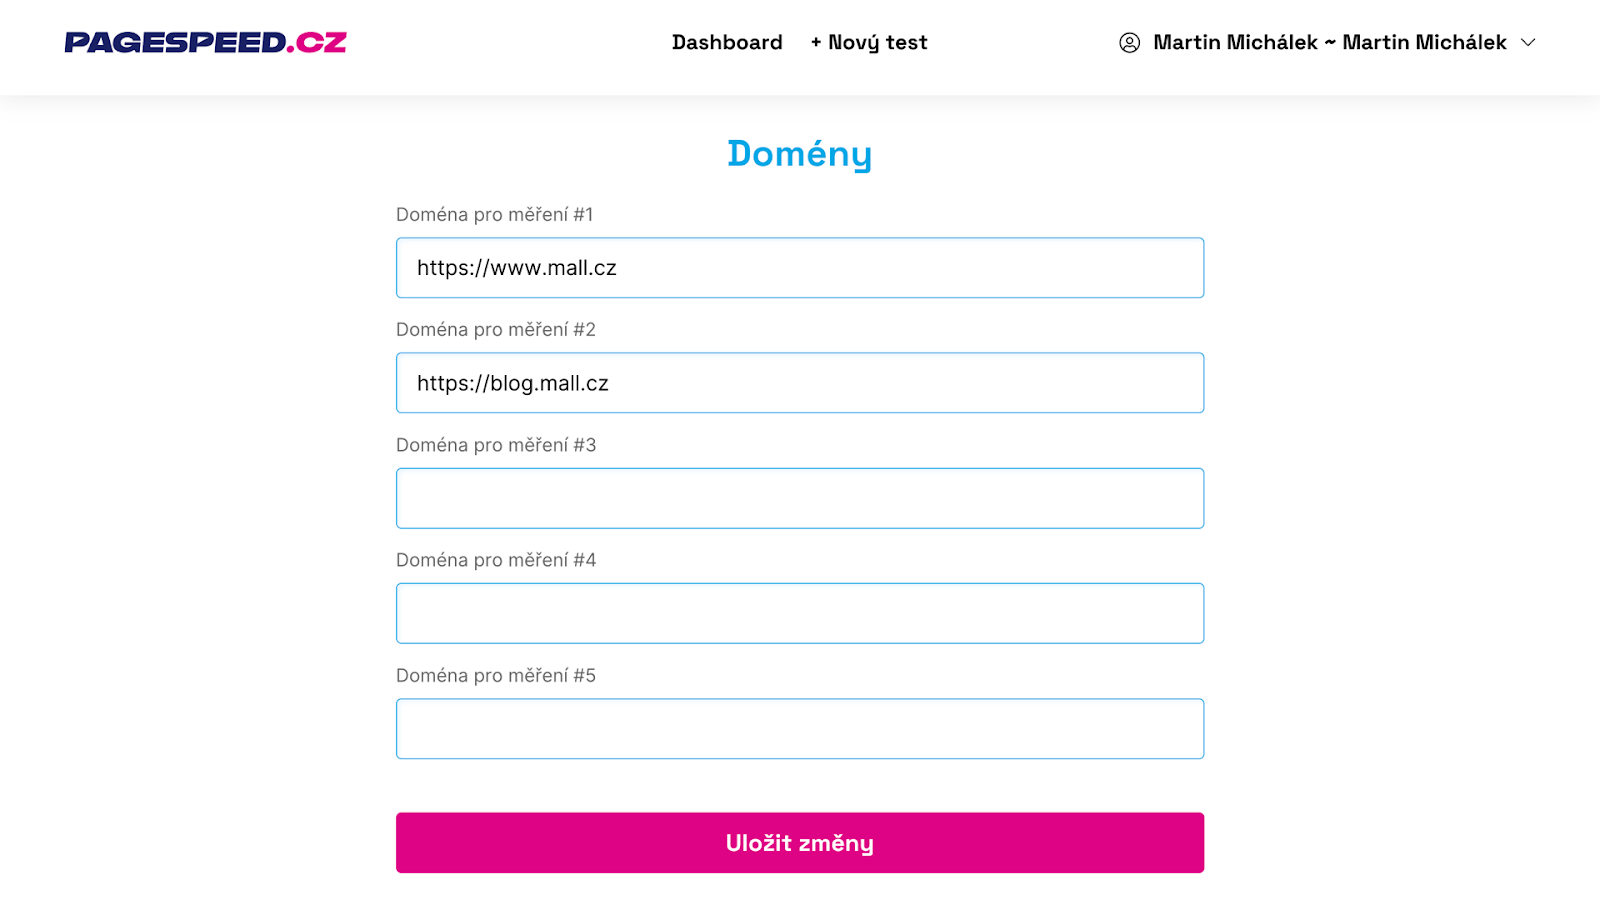
Some domains may have already been automatically added from the inserted URL pages. Within a test, you can monitor the speed of up to five domains.
Adding domains to a test is useful in three scenarios:
- The website has subdomains. Google evaluates the speed of each subdomain separately.
- You own multiple websites of the same type, e.g. language variants.
- Besides this website, you'd like to monitor competitors too.
We're nearly there. You can repeat Steps 2 - 4 with other websites you wish to monitor, filling your dashboard as we do with our clients.
Step 5: Monitor Speed on the Dashboard and in Email Reports
Now, every visit will reveal the current Web Vitals metrics (3) for all domains (2) from your tests (1):
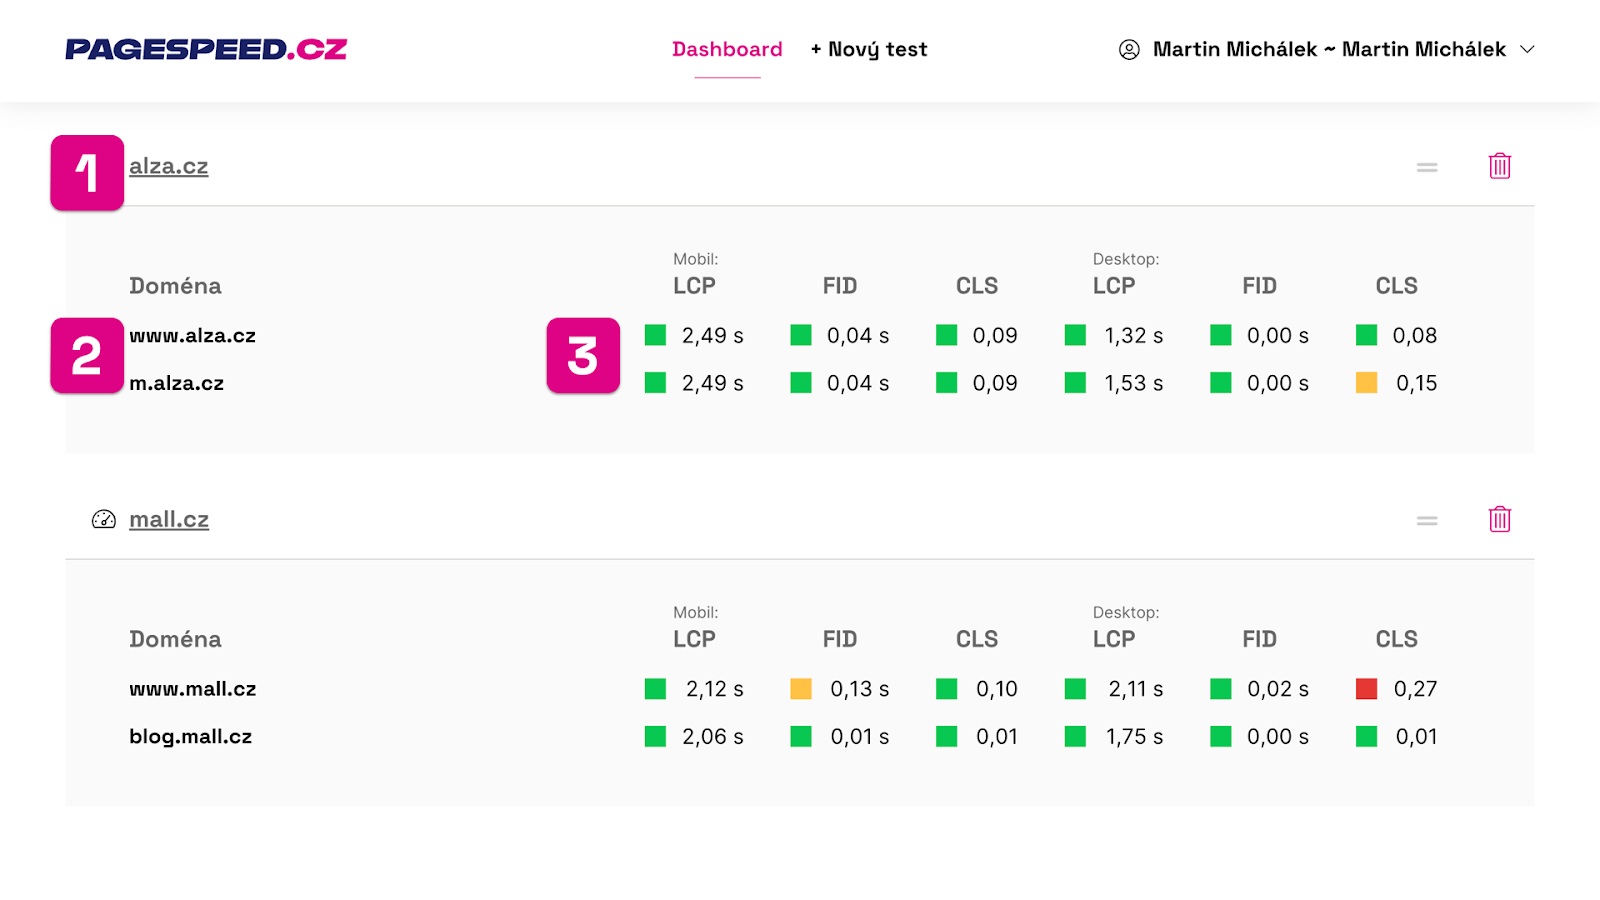
There are two things to keep in mind:
- Google provides these data cumulatively over the last 28 days, so changes may not appear immediately. However, these are the "right" data that Google's algorithms use to evaluate your domain's speed within the Page Experience signals.
- Some websites may not have data available. This usually happens due to lower traffic. Unfortunately, there's nothing that can be done about it, but Google does not factor in speed for such websites in its evaluation.
As mentioned earlier, once a month you'll receive an email report for each team (or dashboard) you're part of. These emails will show what has changed over the past month and what hasn't. You can, of course, unsubscribe from these emails.
I trust that the updates in the tester and the email reports will serve you as well as they serve us. Don't hesitate to get in touch if you have any improvement ideas.
Tip: If you're interested in speed-related updates and don't want to monitor your websites, we now also send a separate newsletter with the latest happenings.
Stay informed about your website's speed.
Subscribe to our newsletter. Each month, we share the latest in website speed for site owners, marketers, and developers.