Update of TTFB Measurement in Synthetic Data (release 4.7.1)
 Martin Michálek5/5/20252 minutes reading
Today, we have implemented a measurement change that will affect server response values (TTFB metric) in synthetic data.
The TTFB metric consists of several parts. Simply put, the main components are:
- Redirect
- DNS Lookup
- Connection and TLS
- Waiting for server response
Previously, we reported all except the last value (Waiting for server response).
From May 5th, we will display the sum of all values in the reports. Therefore, TTFB values may be higher than before.
To avoid overwhelming you with Watchdog alerts about limit breaches caused by our change, we will not report TTFB changes on this day. Additionally, we have added a note to the application interface in PLUS tests with the following content:
[AUTO] Change in TTFB measurement
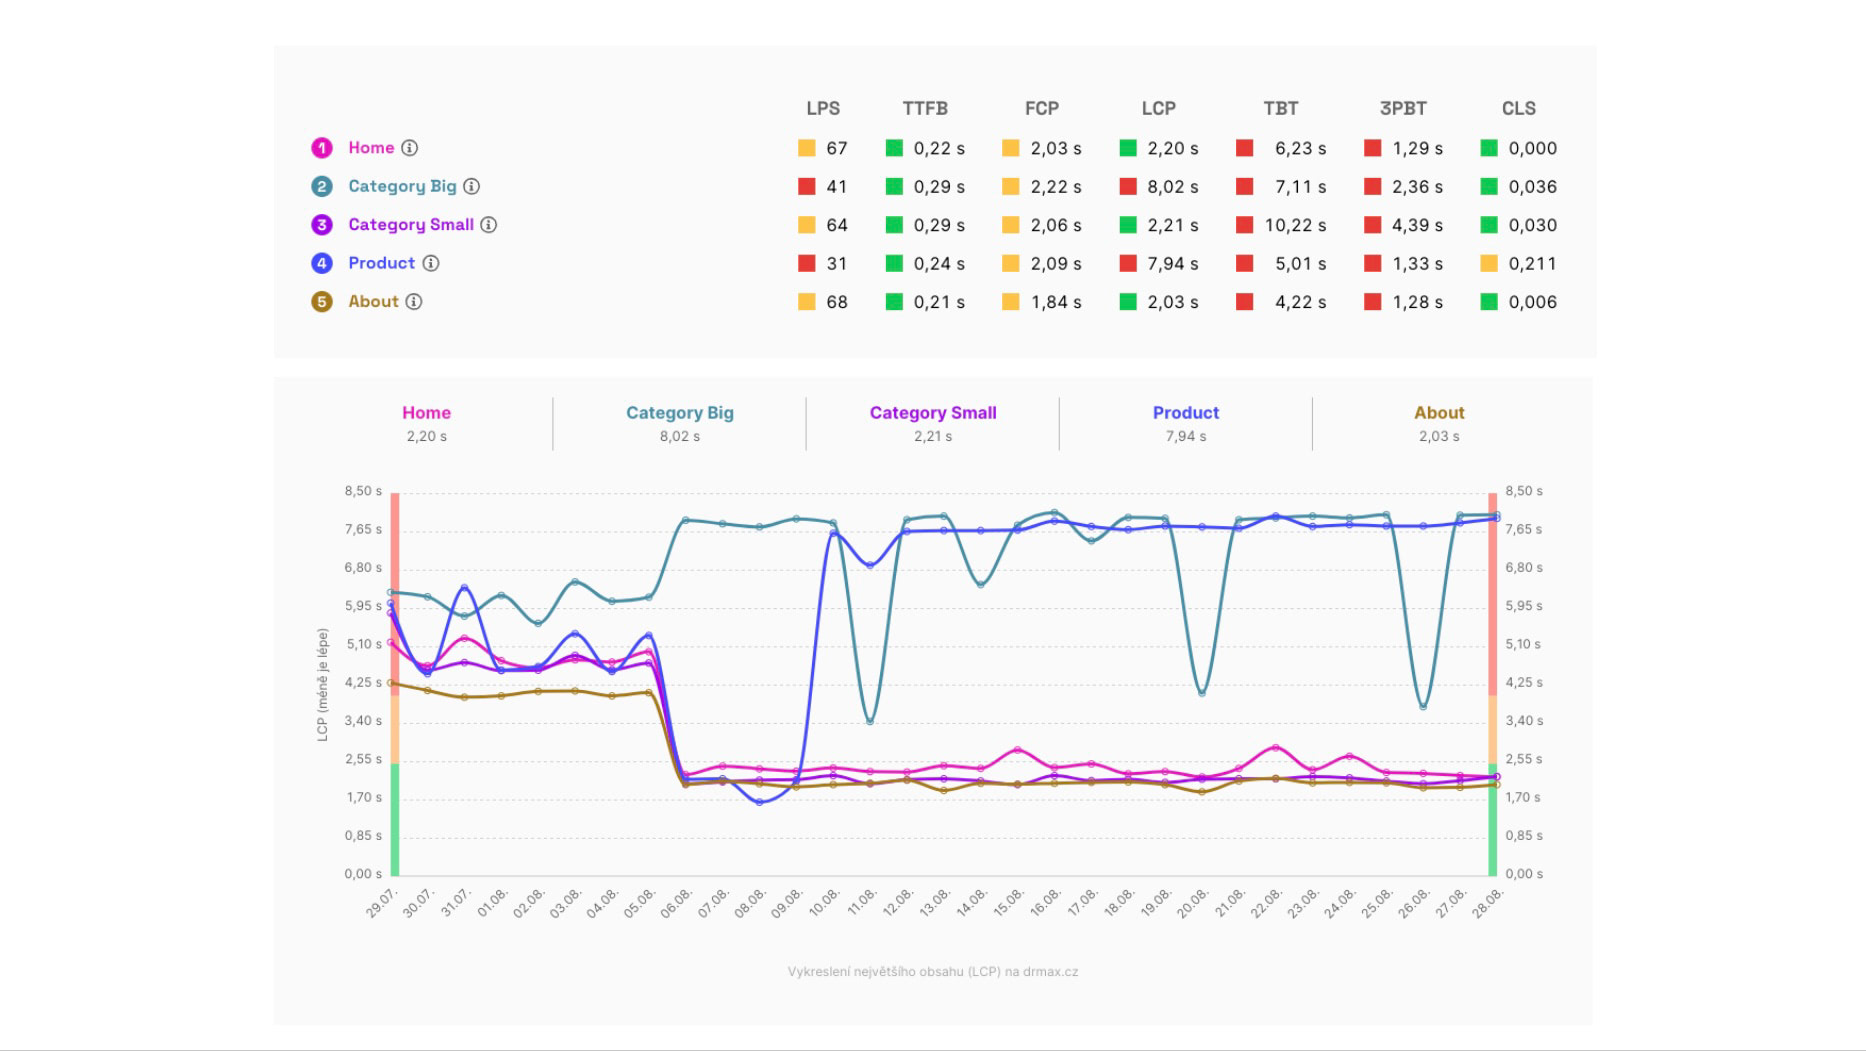 In the Page Report, you will find all metrics for each measured page type of your website.
While we're at it — release 4.7.1 includes a number of other improvements, such as:
- Pages/CrUX Report: we've added distribution graphs for each page.
- If you use HTTP basic auth, we now alert you that TTFB metric values will be affected.
- Synthetic: instead of an exclamation mark in the modal, we'll display real metric values (if we have them).
- Bug fix: Watchdog shows a negative number of days.
- Bug fix: The “Go to Pages” link in the Watchdog modal does not work correctly.
We continue to work on refining measurements and new features that will help you achieve faster websites.