Tester Version 4.1: Charts in Reports, Clearer Modals, and More
 Martin Michálek11/21/20233 minutes reading
Following the recent release of version 4.0, we have prepared another batch of enhancements for our web speed monitoring tool.
In addition to a host of minor tweaks and bug fixes, we bring you several user-facing updates.
Reports Now Include Charts (PLUS Tests)
The Watchdog is our most popular feature, both for our clients and for us, as it saves us a significant amount of time in speed consultancy.
The Watchdog sends smart notifications about significant changes in web speed to your email or Slack and Teams. We've now included a chart snippet in these alerts to provide you with visual context, making it easier to determine whether you're facing a major disaster or just a minor hiccup.
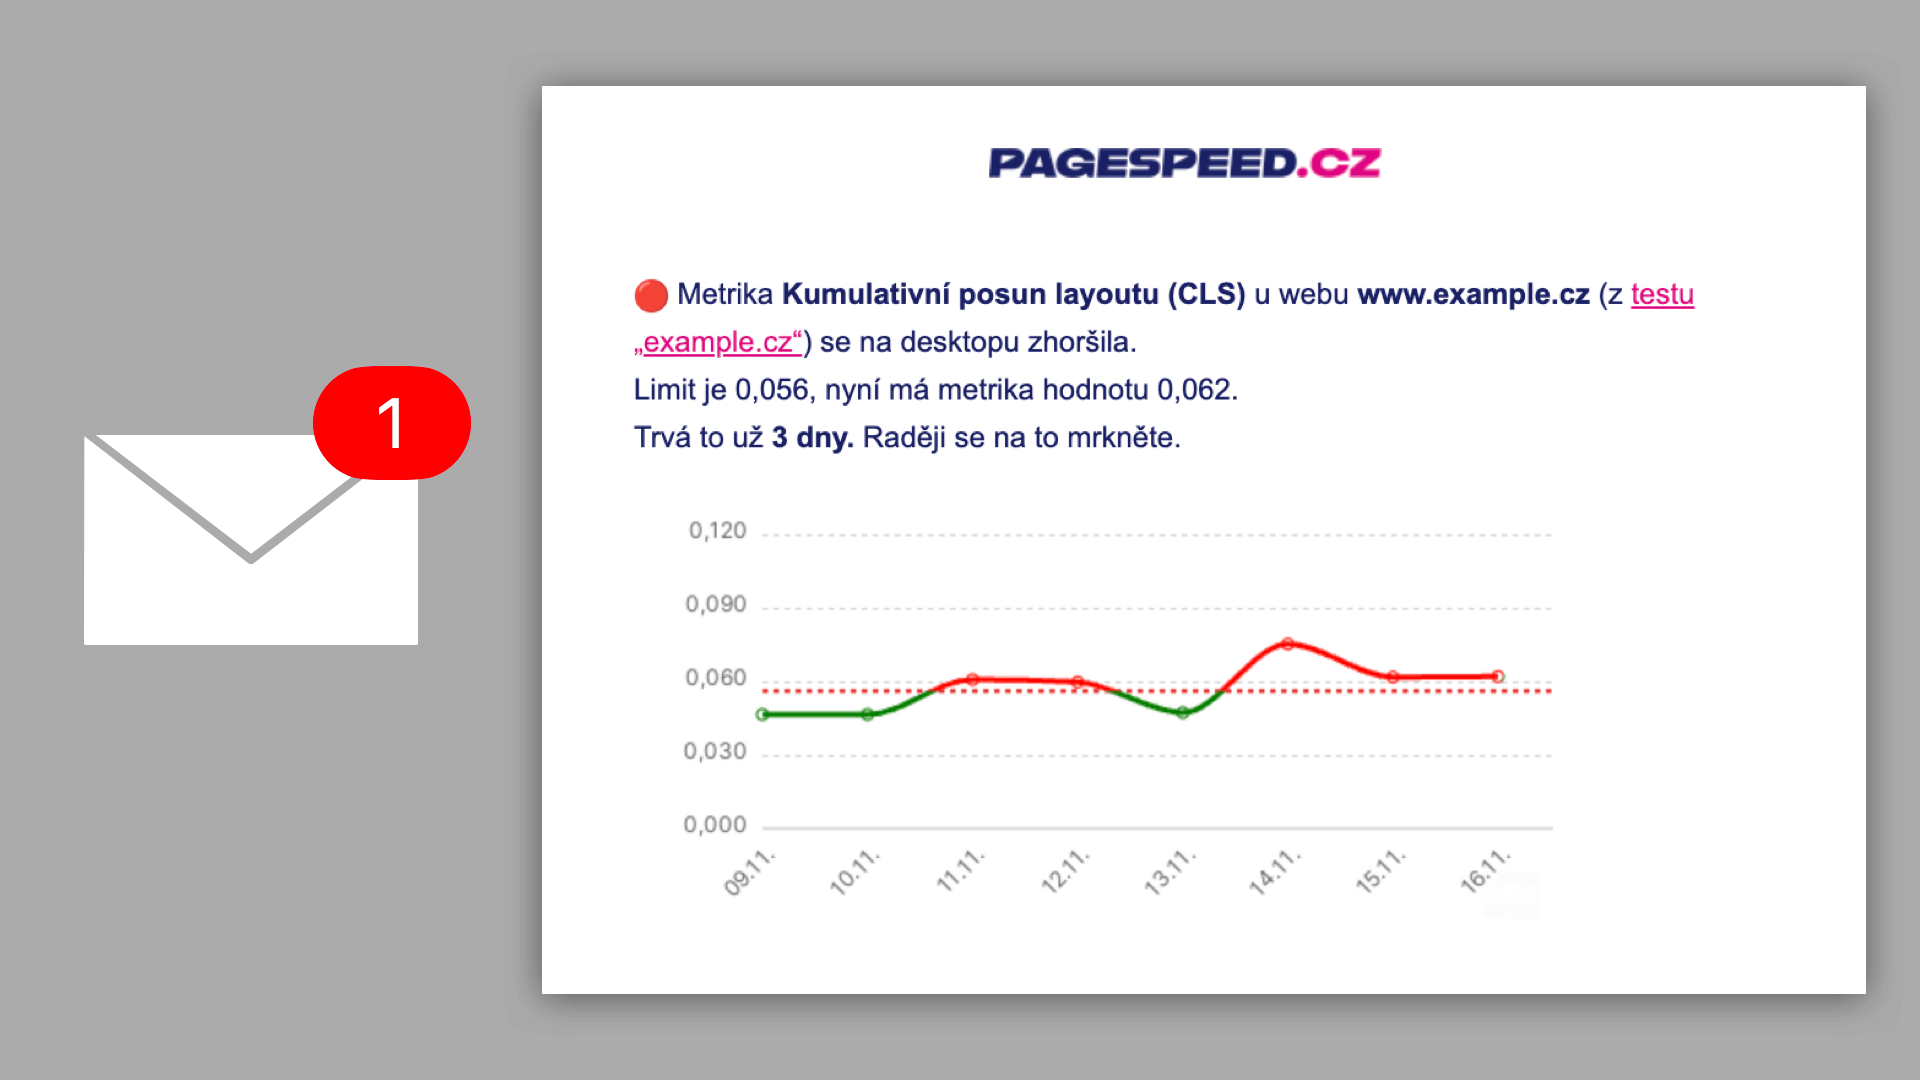 Watchdog
You can test the Watchdog as part of PLUS tests, which are about to be released, but for those of you who can't wait, you can request access now.
Revised Behaviour After URL Change in Settings (All Plans)
During speed monitoring, you might need to add or replace the URL of a tested page.
This situation is not uncommon, but it significantly affects the charts you see in the tester, and more importantly, it affects the chart and behaviour of the Watchdog, which calculates values based on the URLs it sees in Settings.
We've adopted a new approach to URL changes:
- We will alert you that this will impact the charts.
- We will add a note about the URL change to the charts.
- We will discard existing calculated Watchdog limits and establish a new baseline after 14 days.
This approach ensures you won't receive notifications about speed improvements or deteriorations caused by settings changes.
Clearer Modals with Results and Transition to Pages (PLUS Tests)
You may have noticed that clicking on a chart allows you to view a modal window with measurement results for a specific day. It's a useful way to understand where the numbers come from.
Now it's even more useful. We've simplified the modal window and only display the measurement values that actually appear in the chart.
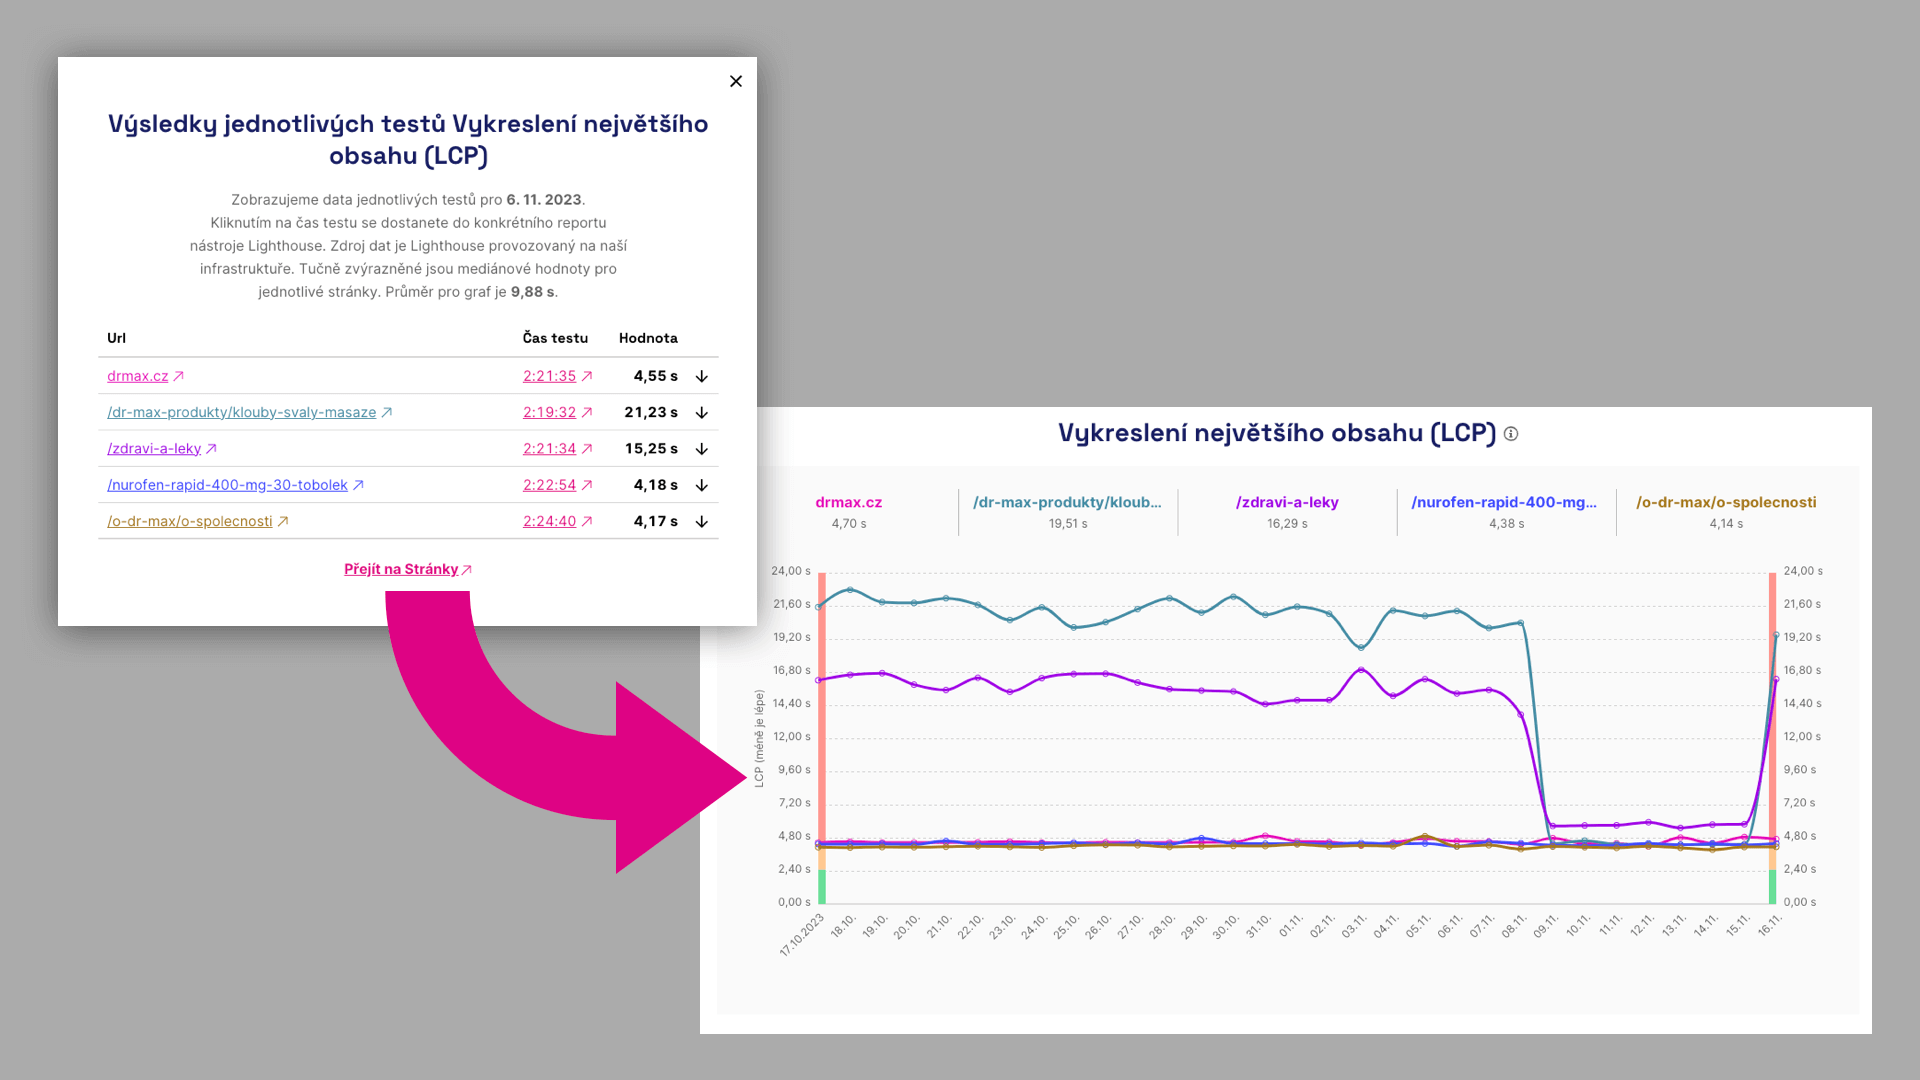 Easily transition from Watchdog to the same chart in the Pages report.
We've also added a link in the Watchdog report modals to the specific chart in the Pages report. This will be helpful when you need to understand which pages have most impacted a given metric.
This concludes our selection of the three most important changes, but we've done quite a bit more. For example:
- We've changed the testing time for free tests to provide you with more stable results.
- Updated the FAQ to explain some basic principles of how the tester functions.
- The domain distribution chart now includes a tooltip explaining the toggle.
- Improved the application entry for non-logged-in users, such as from email notifications.
- Fixed a bug where an older test couldn't be saved in Settings.
- Corrected the display of zones on the vertical axis in Watchdog charts.
- Adjusted the interface to be less colourful and more contrasty (especially headings and icons).
- Refined the appearance of Opportunities.
Following the release of version 4.1, we continue our work. We welcome your feedback on using the tool and, of course, feel free to report any issues either in chat or at info@pagespeed.cz.