Speed Tester Version 4.3: Help, Watchdog Improvements, CrUX Graphs and Much More
 Martin Michálek5/20/20245 minutes reading
Approximately two months after completing version 4.2, we have finished version 4.3 of our web speed monitoring tool. We have added help documentation for educational purposes, integrated Watchdogs into the Summary report, display specific Metric values, and have more interface improvements.
Most of these changes apply to both the free version and the professional PLUS tests.
First, let's delve into the major updates.
Web Speed and Speed Tester Help
One of PageSpeed.ONE’s missions is to improve awareness of web speed through lectures, meetups, and articles.
 The PageSpeed.ONE help is ready.
Our agency blog was no longer sufficient for publishing popular science texts, so we sought a better tool. We chose Docusaurus, a static site generator specialized for documentation purposes.
You can already see the results on pagespeed.one.
We've moved not only general texts, such as on speed metrics like INP, LCP or CLS, but also texts on techniques and technologies related to speed, such as BF cache or arguments for Why Speed Matters.
We are now planning to prepare help documentation for the monitoring tool itself, starting with the Summary report.
Stay tuned, as we will be publishing at a faster pace than before.
Displaying Specific Value in Domain Speed Evolution Graph
We are quite pleased with this change in our consulting agency, as we monitor Google’s speed data evolution graph (Chrome UX Report, abbreviated as CrUX) in the Domains report almost daily during optimizations.
Now, it is possible to switch this graph from distribution (displaying the metric value distribution among users) to a single number (which for Google is the 75th percentile):
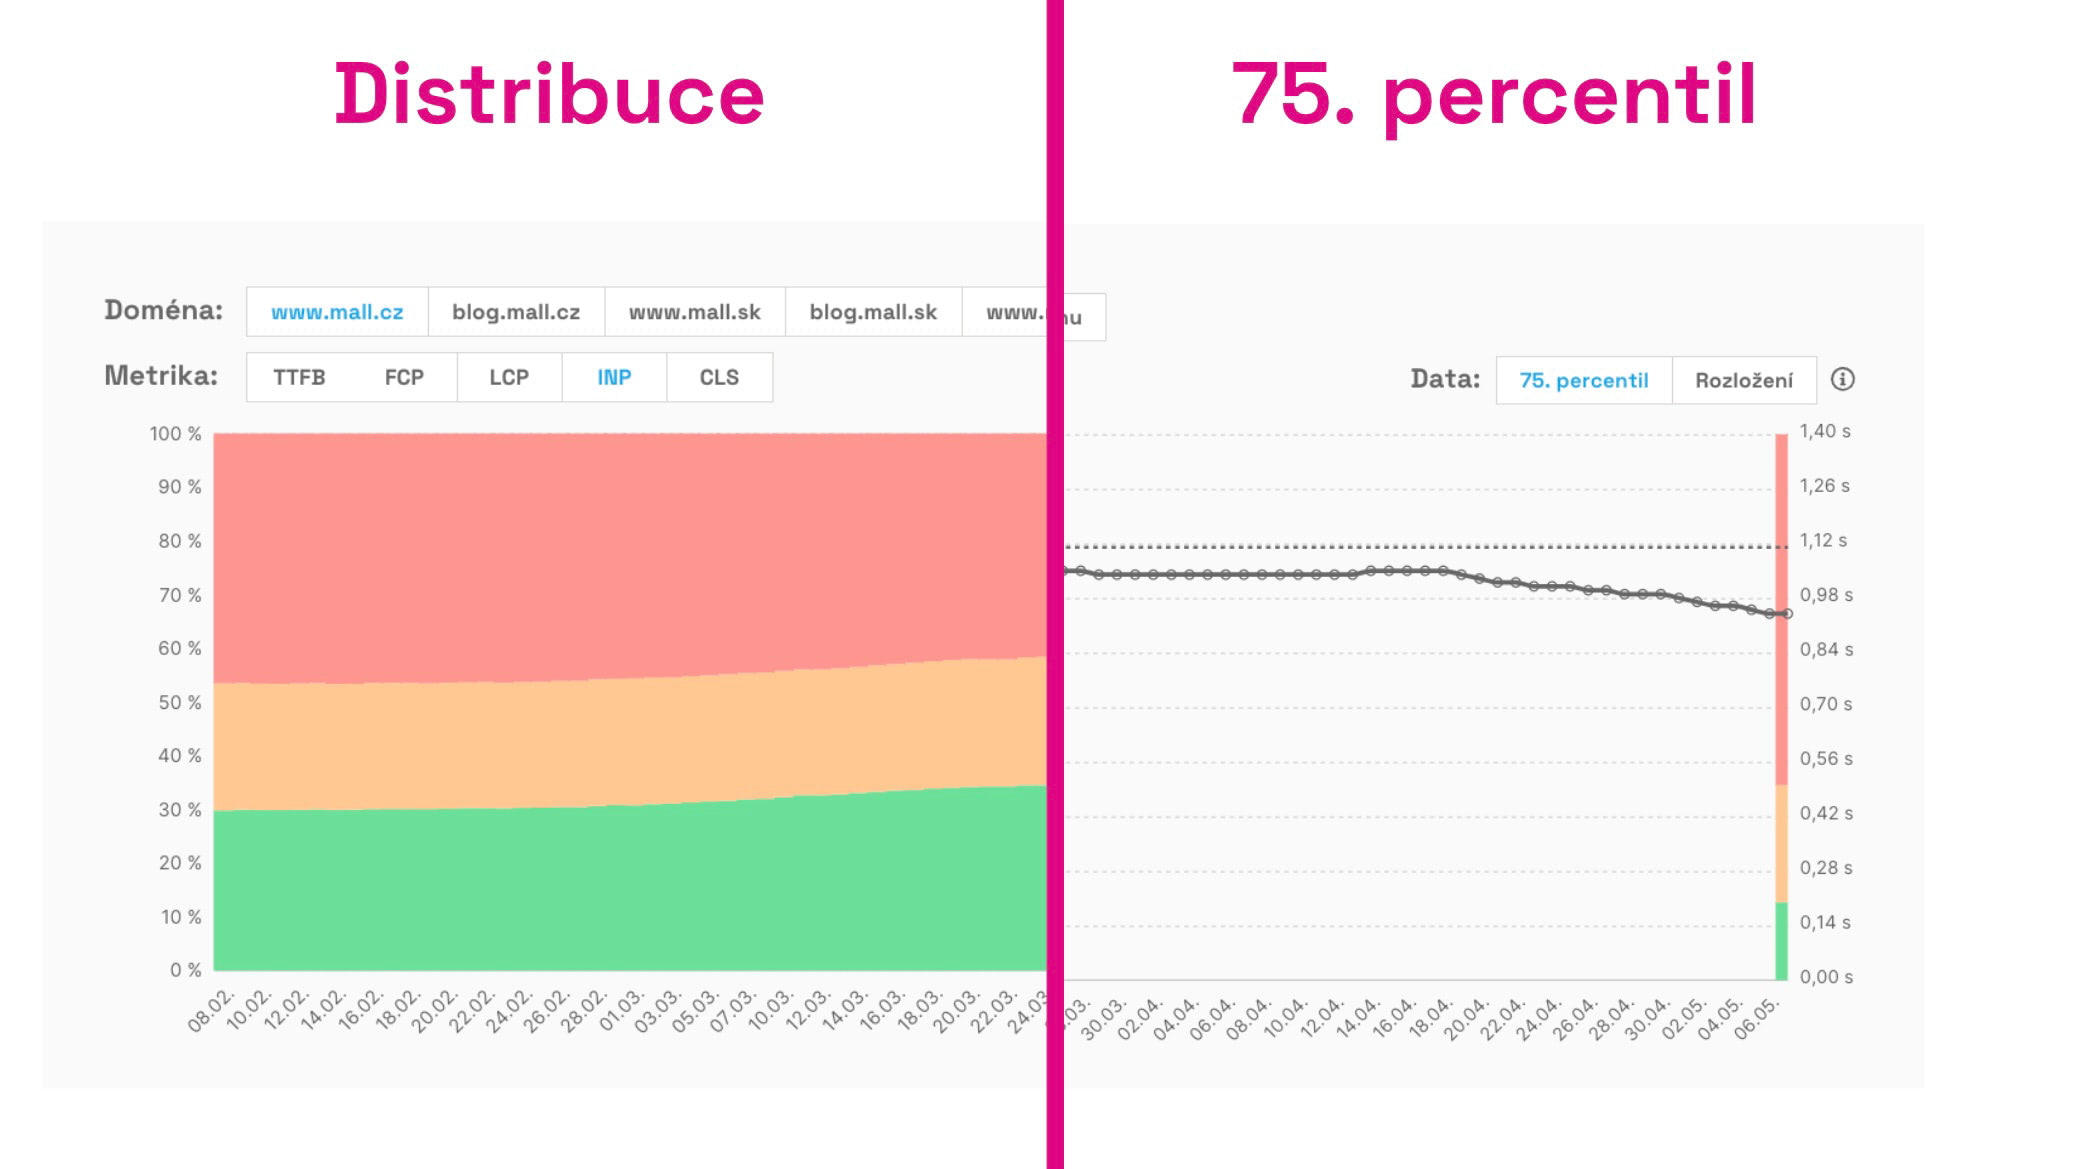
Unlike the distribution graph, here you see the value by which Google actually evaluates your site in terms of Core Web Vitals. It is therefore much simpler.
Will you be checking it as often as we do?
Watchdogs Added to Summary
The Watchdog report is reportedly a very popular feature of our PLUS tests. Recently, for example, we received feedback from the gentlemen at Slevomat:
The tool works great for us. We check it every day due to INP. Watchdog notifications are set up in Slack, and just recently, it even alerted us to a bug we managed to fix.
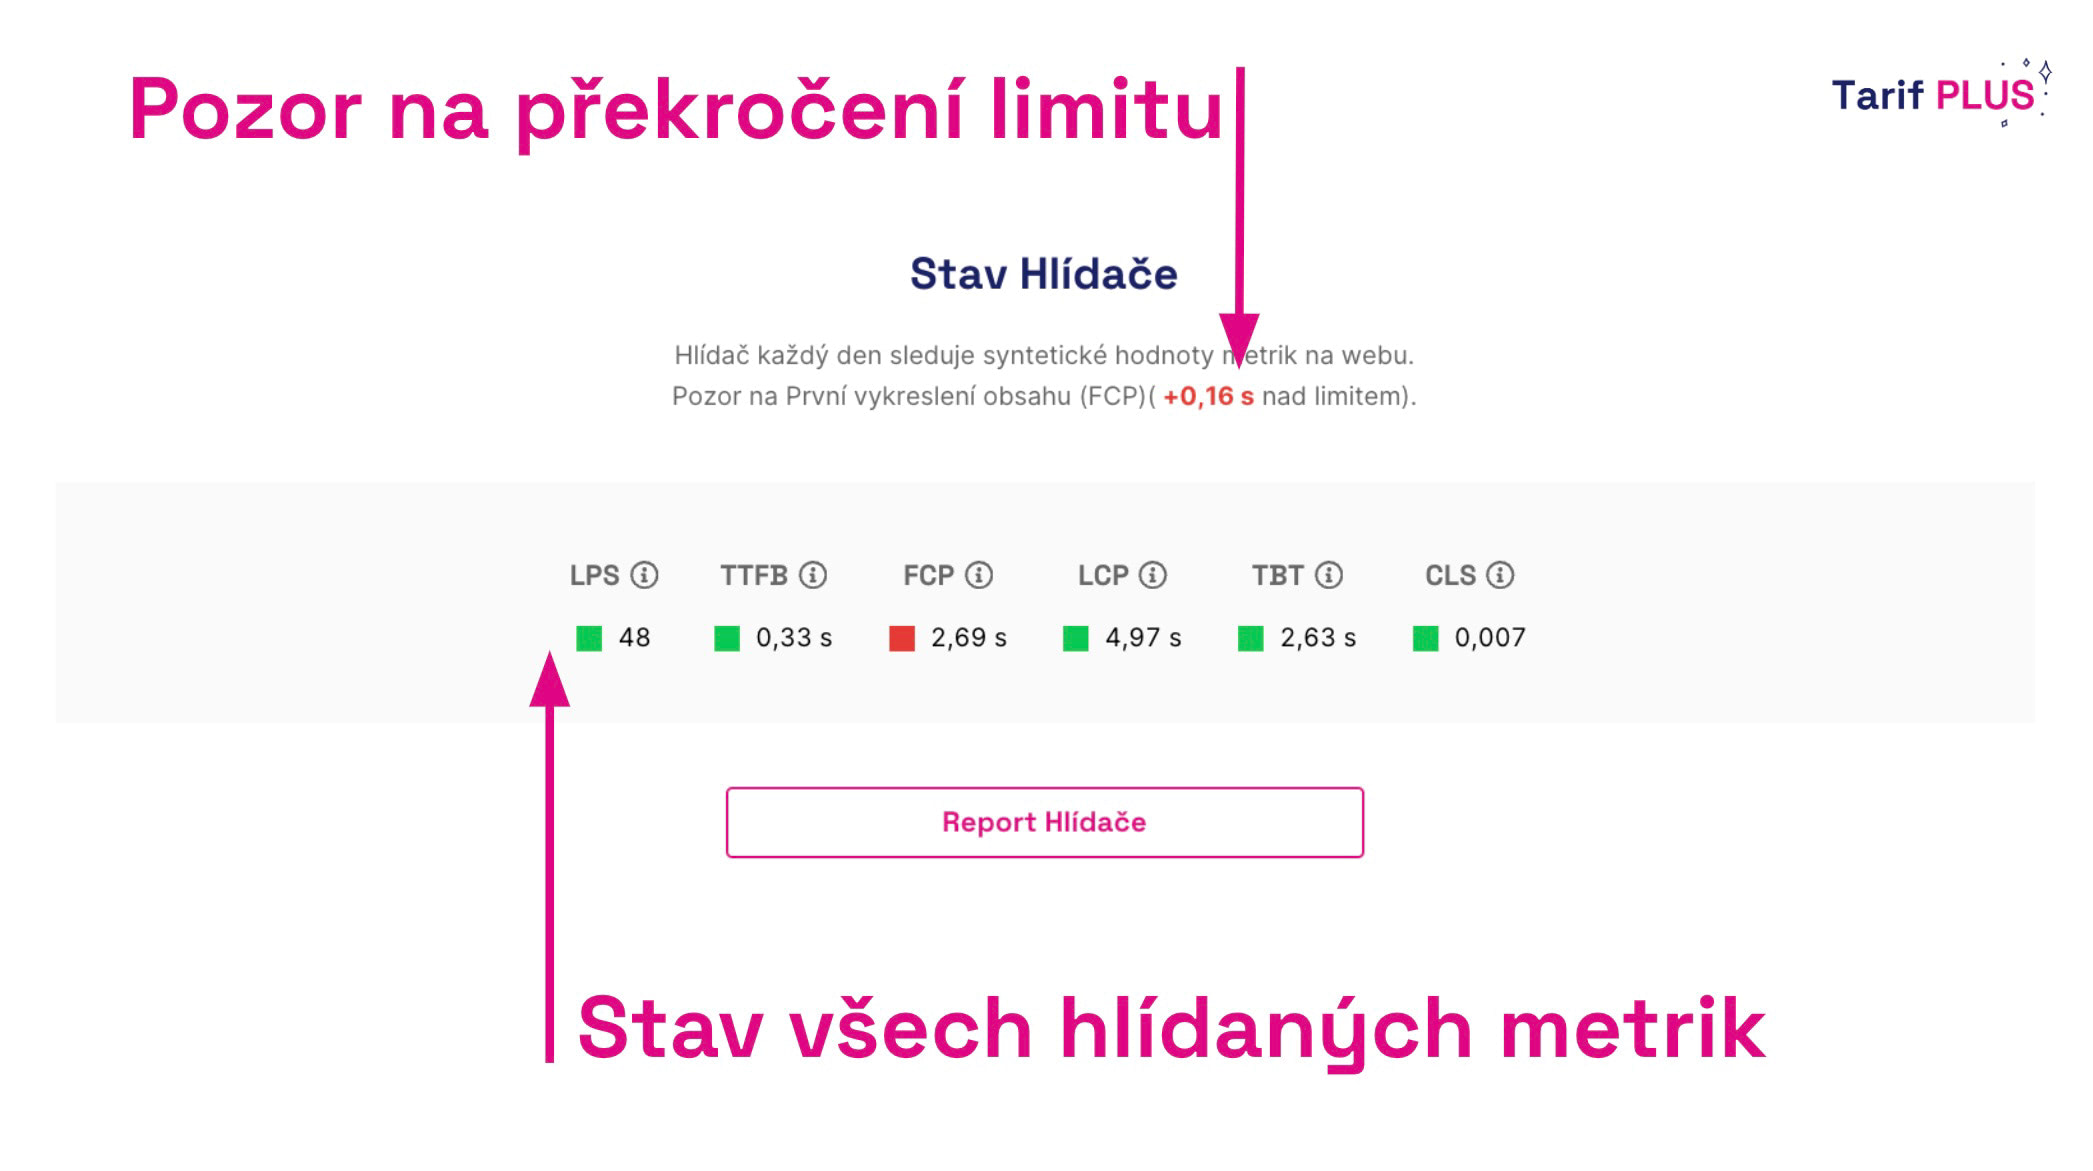
We have now slightly improved the basic output of the Watchdog report, namely the table with monitored metric values, and added it to the Summary report, where you can see the status of all the site's metrics.
Rotating and Expanding the Monthly Metrics Evolution Chart Table
When measuring speed, we are interested not only in the short-term horizon, i.e., whether we see positive or negative impacts of changes on the web's speed, but also in long-term data over months.
This is where tables come in, where we download long-term metric evolution graphs from Google's data.
We have now significantly modified these tables. Firstly, they are arranged vertically by domain like other reports, and secondly, the table is always expanded in desktop view, so you don't need to scroll horizontally.
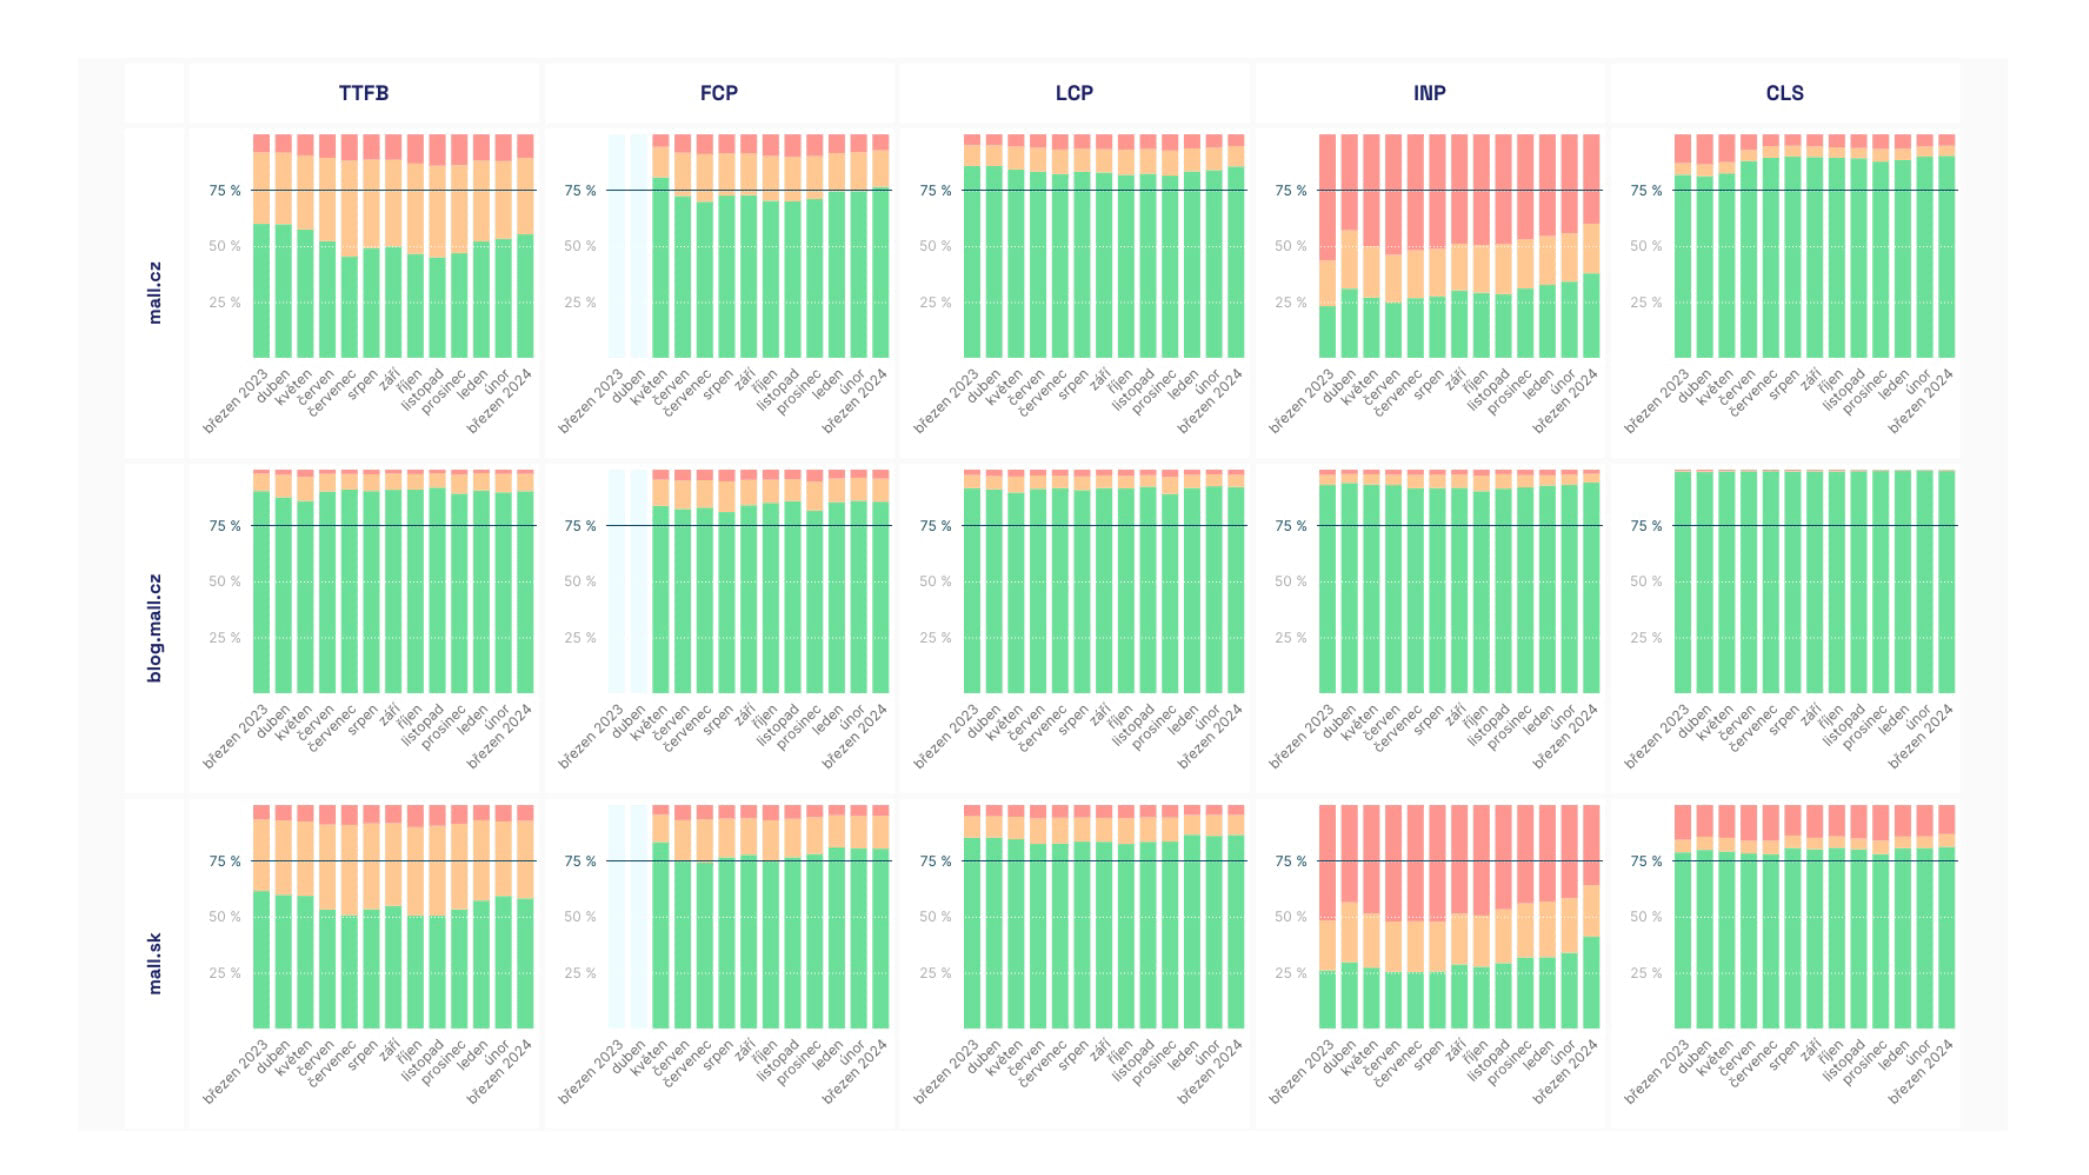 Easier to read, and ideally, it's all green.
(Thanks to Ondřej Ilinčev for the enhancement suggestion.)
Full Metric Value in Results Table
It might not happen to you as often as it does to us, but... sometimes you just need to see the unrounded metric value.
Now everyone has this option; we've simply added it to the bubble displayed when you hover over it.
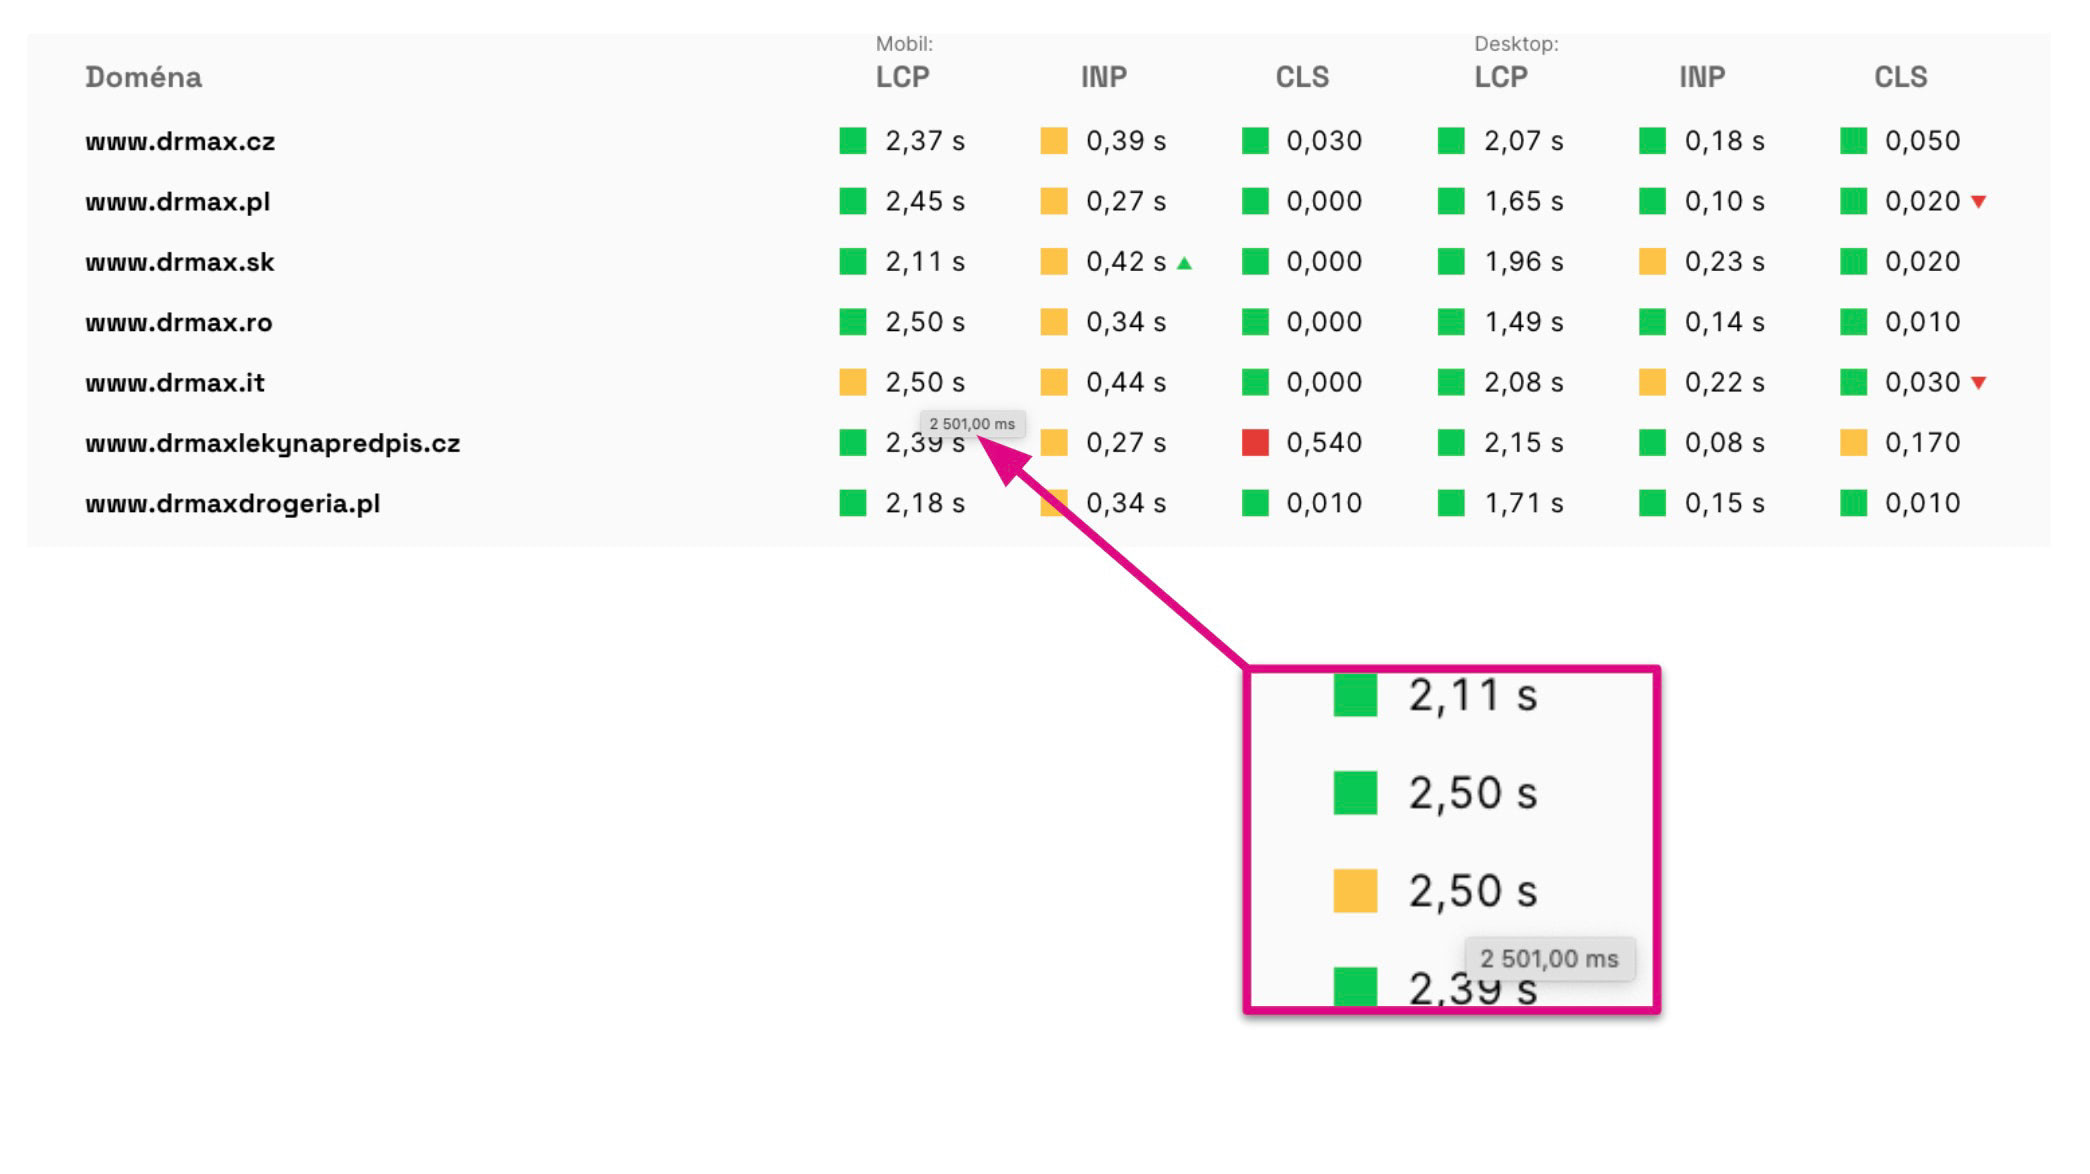 Twice 2.5 seconds and a different color? The mystery is now solved.
This is very useful if you are monitoring metric changes at the level of several decimal places (wink wink to INP).
Additionally, this addresses situations where metric values in the table look the same, but the colors differ, as you can see in the image.
User Interface Now Slightly Less "Iconic"
At the beginning, I mentioned that our mission is to educate. This also applies to the need to educate within the tester interface. Not everyone knows Metrics, not everyone knows the difference between CrUX and synthetic. Speed measurement is rather complex.
The tester interface is still full of help icons, but thanks to the launch of the Help section, we are starting to use icons sparingly.
This small improvement simplifies the user interface:
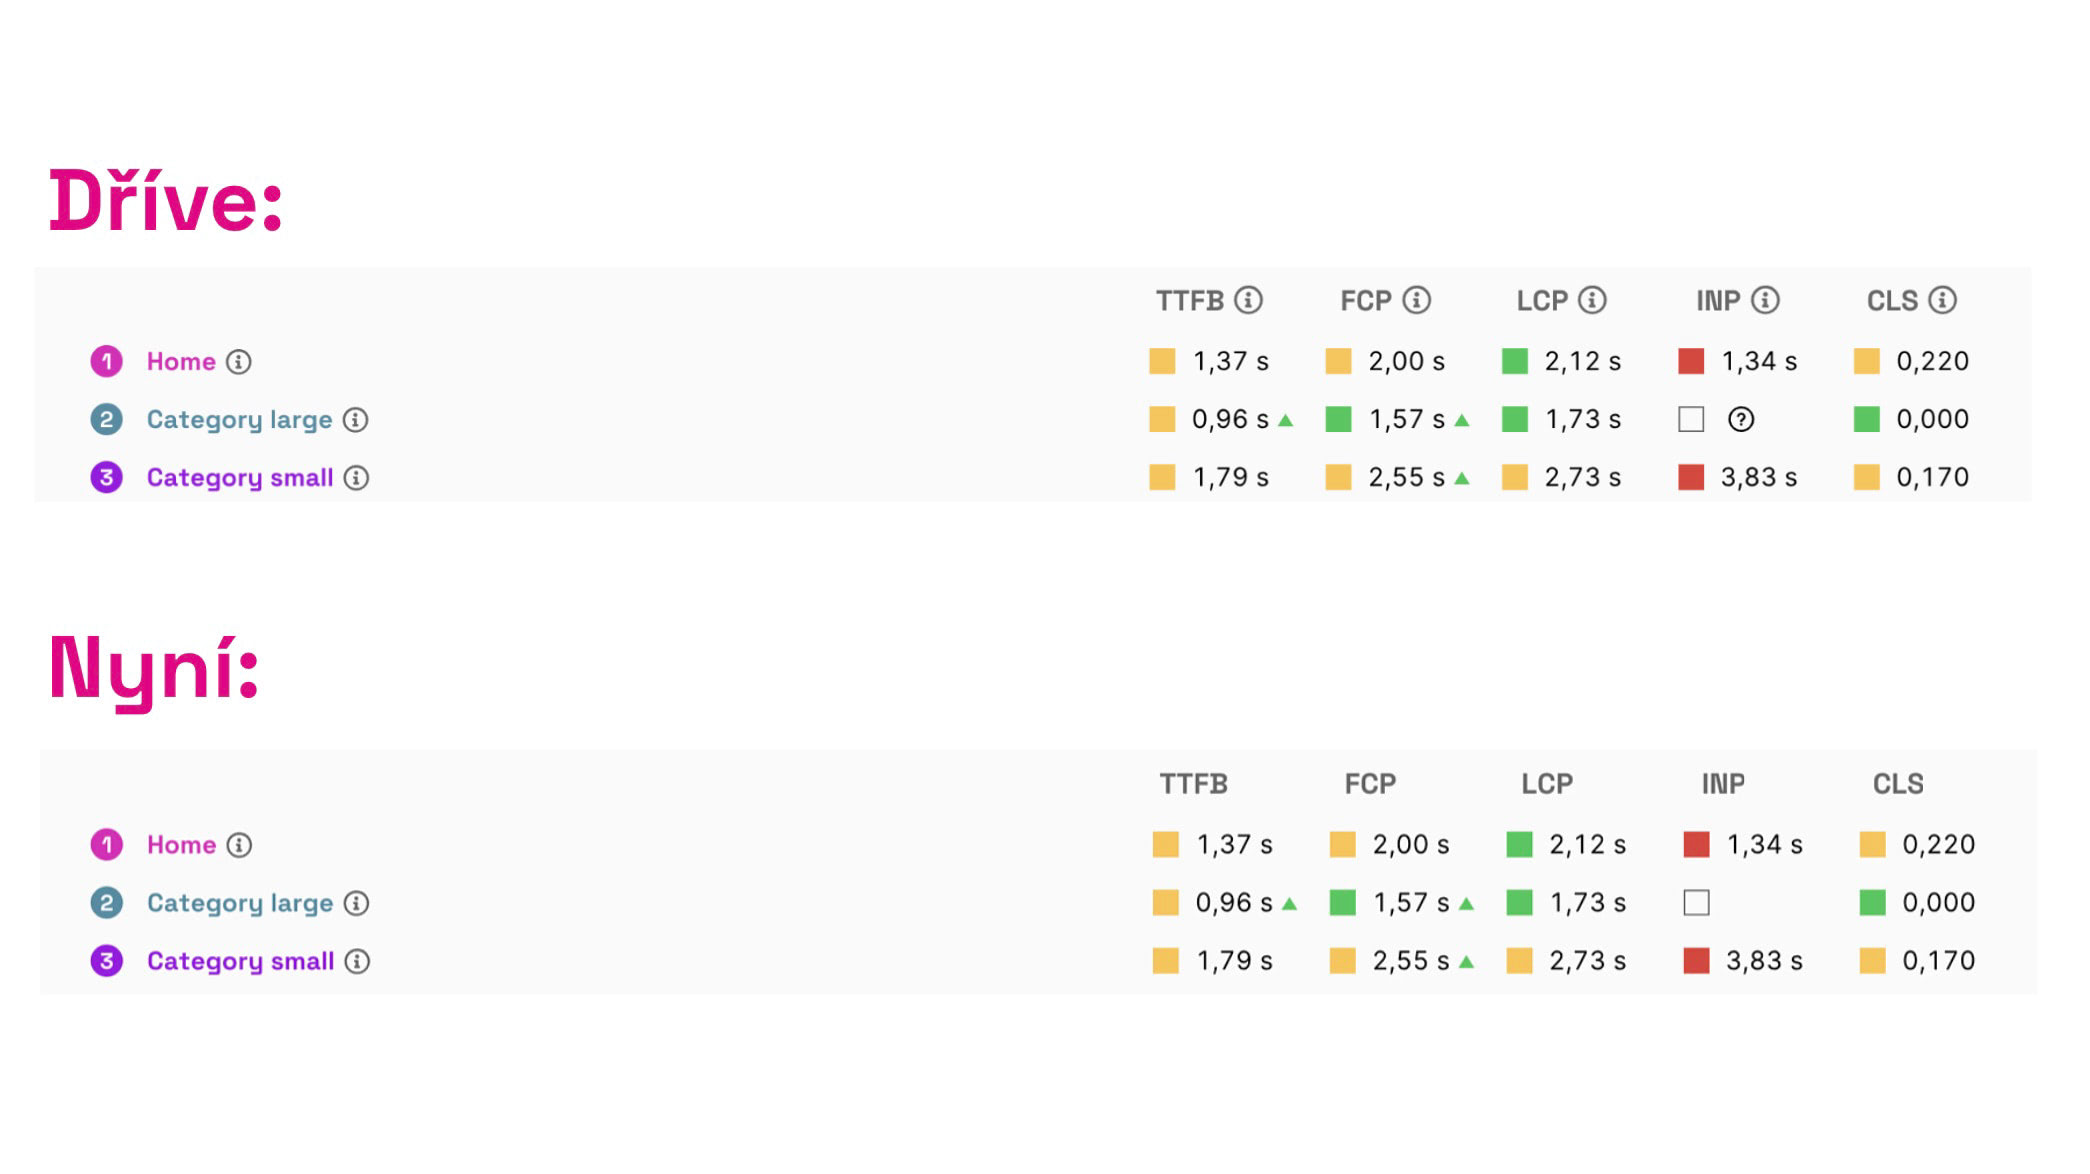 A bit fewer icons, focus remains on data.
It’s somewhat simpler and clearer. This is the direction we will continue to simplify and bring the UI closer to the average person.
Other Smaller and Internal Tasks
Like all software developers, we were, of course, also hunting bugs and tweaking the environment to ensure a smooth workflow:
Bug Hunt
- Bug: Unable to open test detail in the free version
- Bug: Notes not visible in all graphs
- Bug: URL for Slack disappears in Settings after saving
- Bug: Copying URL to clipboard not working
- Bug: Anchors not scrolling to graphs
- Bug: Annual season after switching from another test
- Bug: CrUX for domain with minimal scale
- Bug: Overlapping values in CrUX graph for domain
Internal Tasks
- Fine-tuned error capturing via Sentry
- Bug: Broken atoms/Link component
- Bug: Unable to add test to superadmin dashboard
- Collecting 403 errors during website testing
- Bug: Sentry SequelizeDatabaseError
- Code cleanup
- Simplifying PLUS test creation
- Agency blog: enabled SEO 😅
We appreciate any feedback on the speed tester and, of course, bug reports. Reach out to us at info@pagespeed.cz or just chat directly within the app.

And what will we be doing now?
We are already working on version 4.4.