Paid Tests PLUS: Speed Monitor and Notifications
 Martin Michálek1/3/20247 minutes reading
In the third part of the series, we introduce its flagship or rather the standard-bearer as a key member of the news army. Let’s focus on the Speed Monitor.
The Website Speed Monitor is a combination of features in Paid Tests PLUS, to which you can delegate the task of managing your site's speed. No unnecessary complications, no spam, and no need to interpret data – just right information, at the right place, at the right time.
Why do we introduce the Speed Monitor and what does the competition lack?
We develop the PageSpeed.ONE Speed Tester based on research of competitive speed measurement tools, but primarily on years of experience in monitoring website speed for dozens of our speed consultancy clients.
We want our Speed Monitor to be...
- simple to use even for performance novices,
- free from excessive information noise,
- automatically operating without the need for continuous adjustments,
- and available through various communication channels.
The monitor was created because no available tool met our needs or those of our clients. What exactly sets the Monitor apart from PageSpeed.ONE?
1) Only sends essential messages
Notification emails from existing monitoring tools will eventually overwhelm you. Only some contain relevant and important changes in website speed. We ourselves spend hours weekly evaluating these notifications for clients. Often, it's just a false alarm; the notification was unnecessary.
2) Focuses on important metrics
Traditionally used tools cling to older metrics like page load time (Load event) or invent their own metrics. However, we have long had Metrics that accurately reflect user experience. Yes, our tester focuses on Web Vitals metrics and supplementary indicators.
Let’s now break down the individual features of the Monitor.
Speed Monitor
The “Speed Monitor” report serves as the main dashboard for the entire functionality of tracking and reporting website speed.
We can summarize it in the following image:
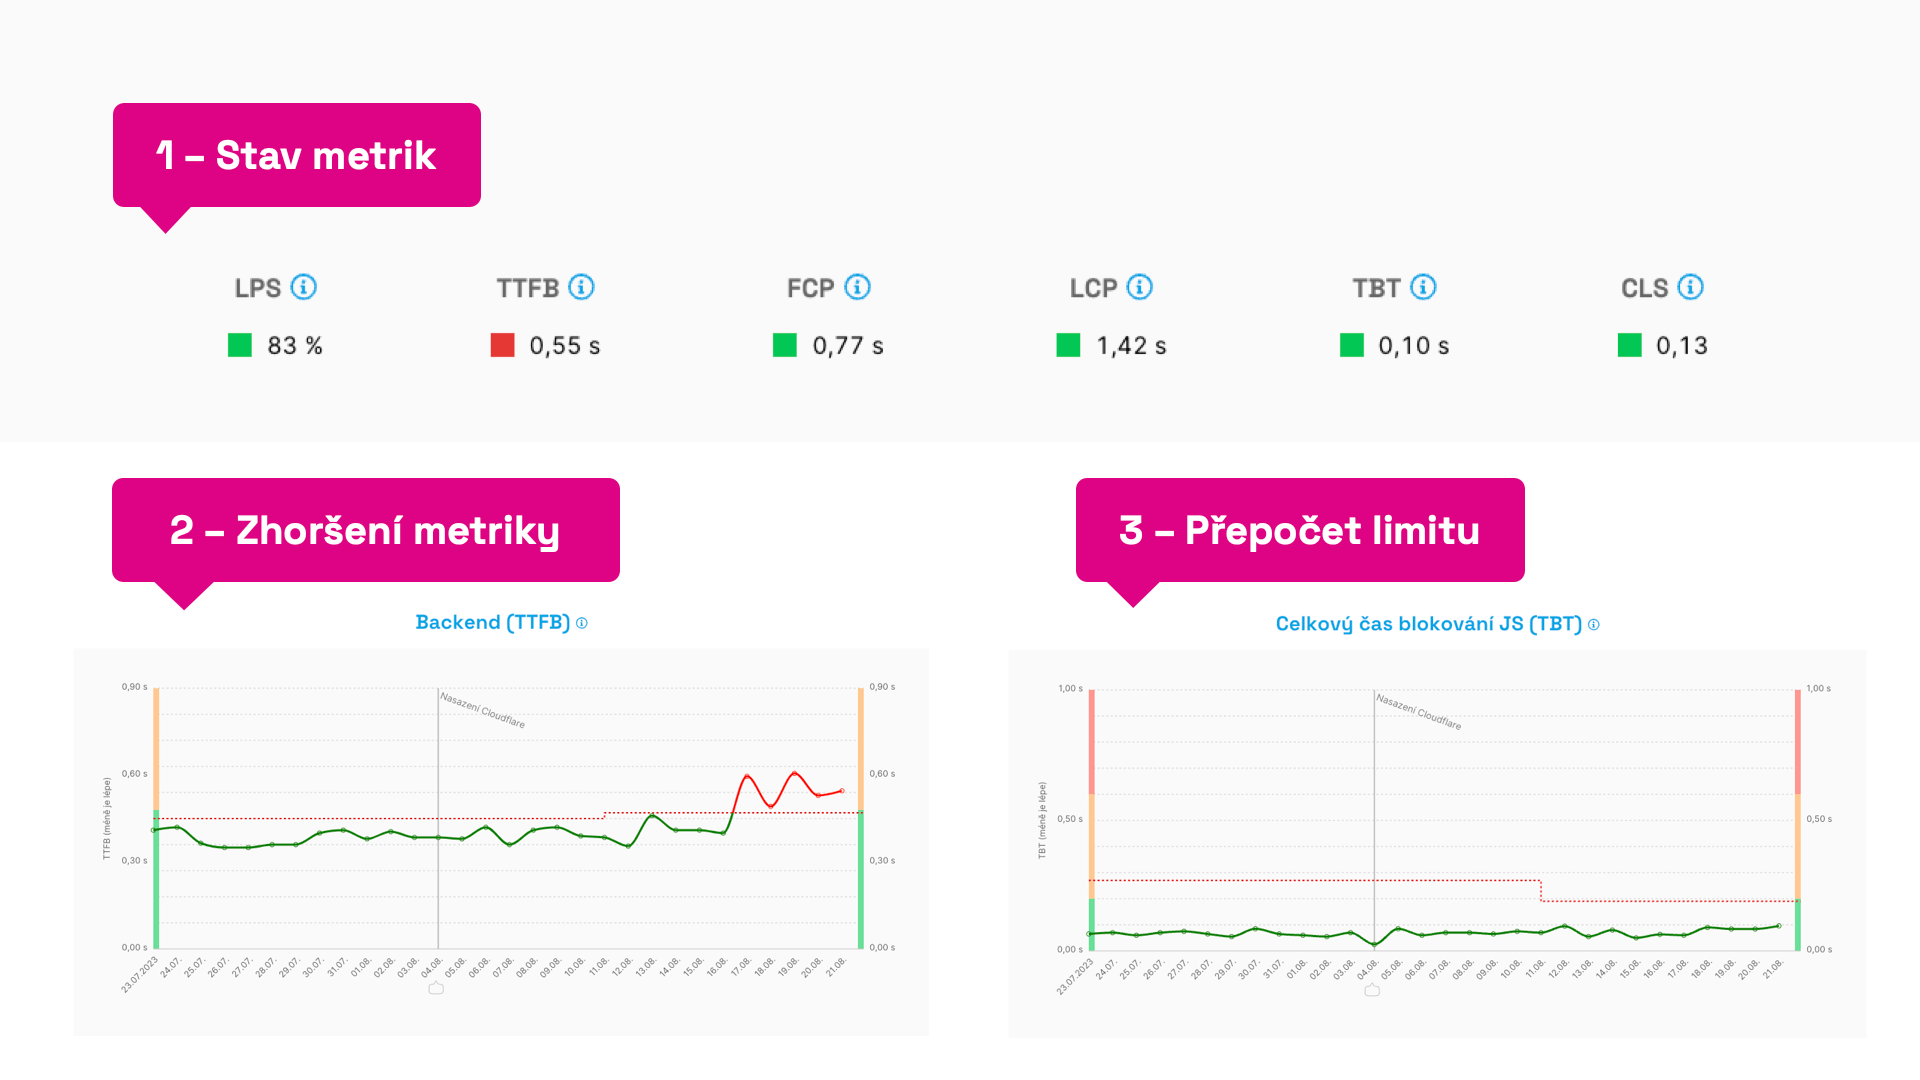 Different statuses in Speed Monitor reports.
Let's comment on the individual points:
- Metric Status – At the top of the “Speed Monitor” report, we see the monitored metrics and their current status. If they meet the set limits, they are green. “Broken” metrics appear red.
- Metric Deterioration – If you see a red line in the graphs for several days, the limit for this metric has been exceeded. We recommend paying attention to it. More on finding causes is below in the article.
- Limit Recalculation – The Metric limit, the dashed line in the graph, can recalibrate itself if the metric shows a good status for two weeks. Similarly, if the metric shows a poor status that doesn’t change. We aim to prevent further deterioration of already poor values, so we always monitor current values.
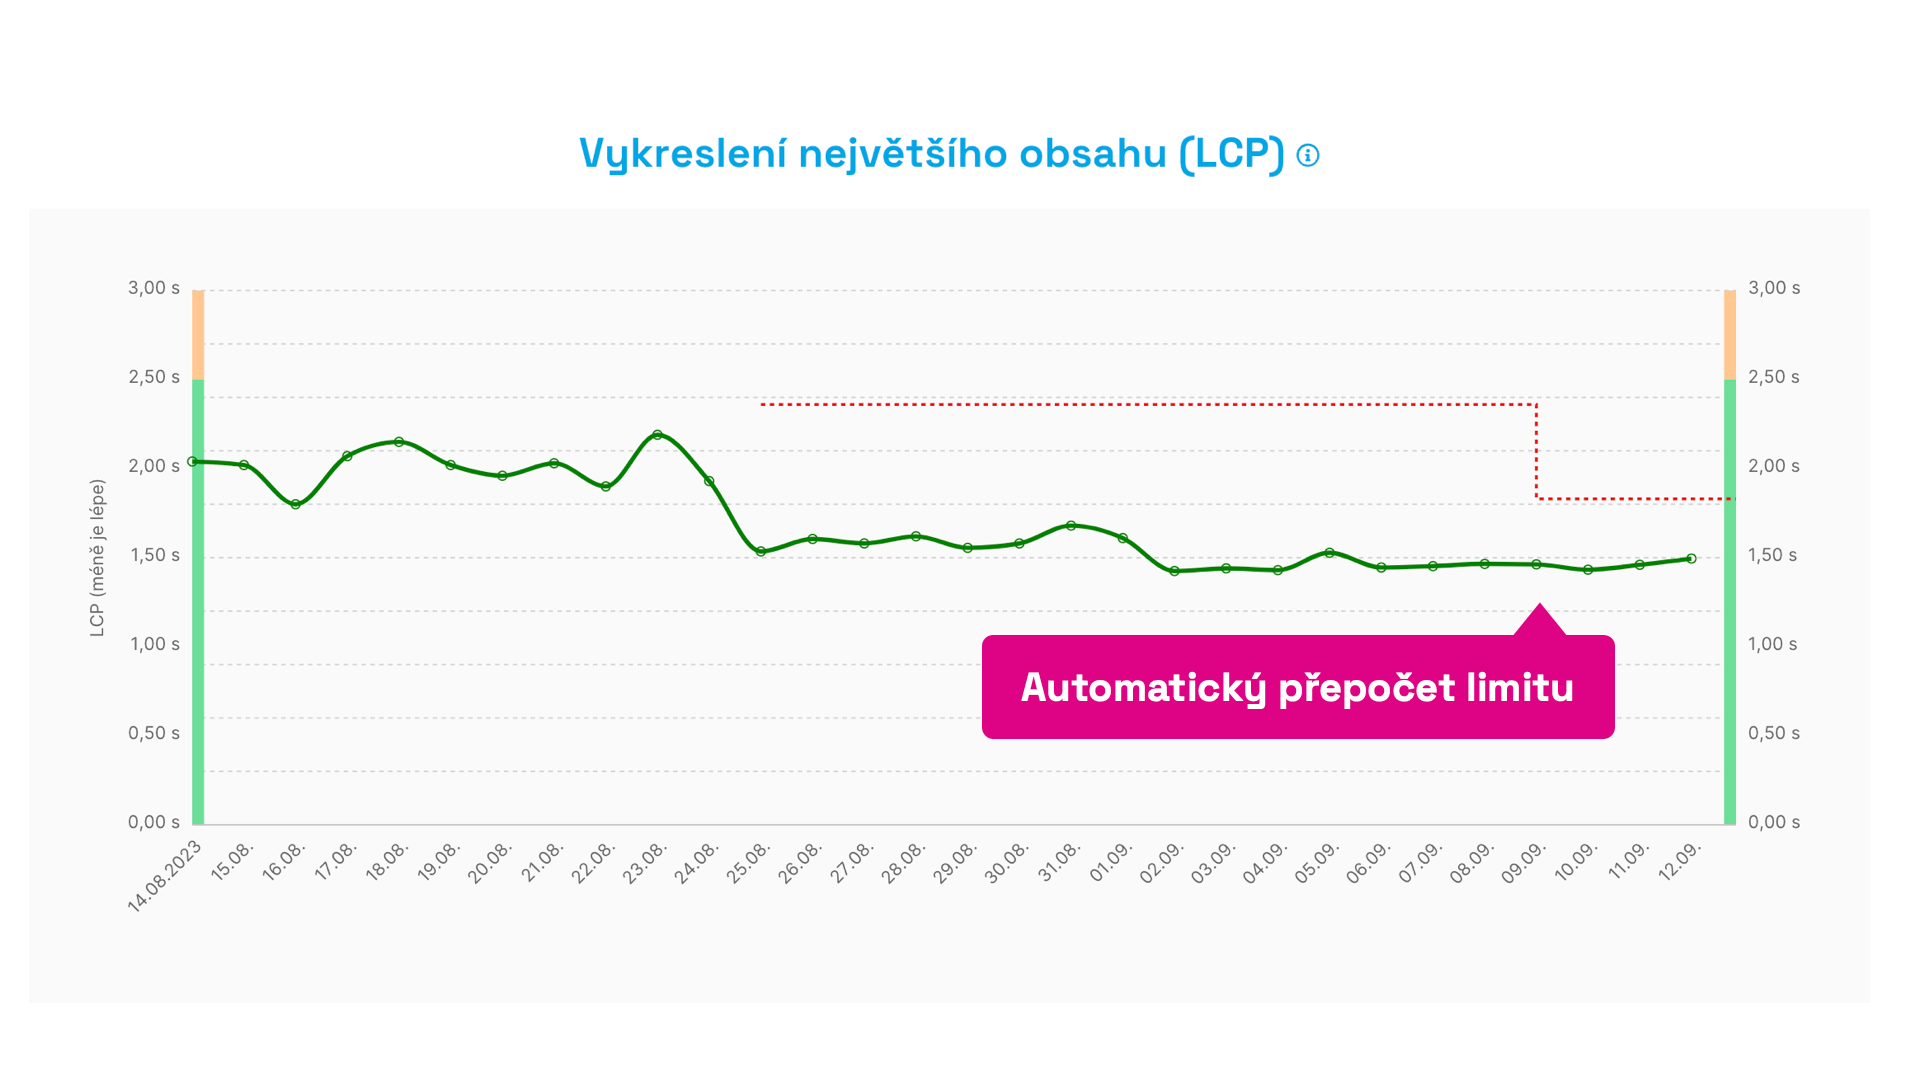 Automatic recalibration of the limit. After two weeks of improvement, we automatically start monitoring the new metric value.
Thus, the key is the speed limit, the metric value itself, and timing. Let’s delve a bit deeper.
How exactly does speed monitoring work? New data every day and minimal spamming
- Measurement Method – These numbers are measured by the Lighthouse tool, meaning synthetically. We take the median measurement of each URL and calculate the average. This has proven to be a sufficiently sensitive calculation for potential changes.
- Metrics – We have selected Web Vitals metrics (LCP, CLS…), supplemented by additional auxiliary metrics like TTFB (backend speed) or TBT (total blocking time of JS).
- Time – Monitoring occurs in two-week cycles. If during this period a metric doesn’t change above or below a certain value, the limit remains as set. If the value changes and lasts longer than three days, we notify you and highlight it in the graph.
- Limit – In the graph, you see it as a dashed line. The limit is always set above the metric threshold and doesn’t have optimal values; it’s always based on the previous state. This allows us to detect changes in metrics effectively.
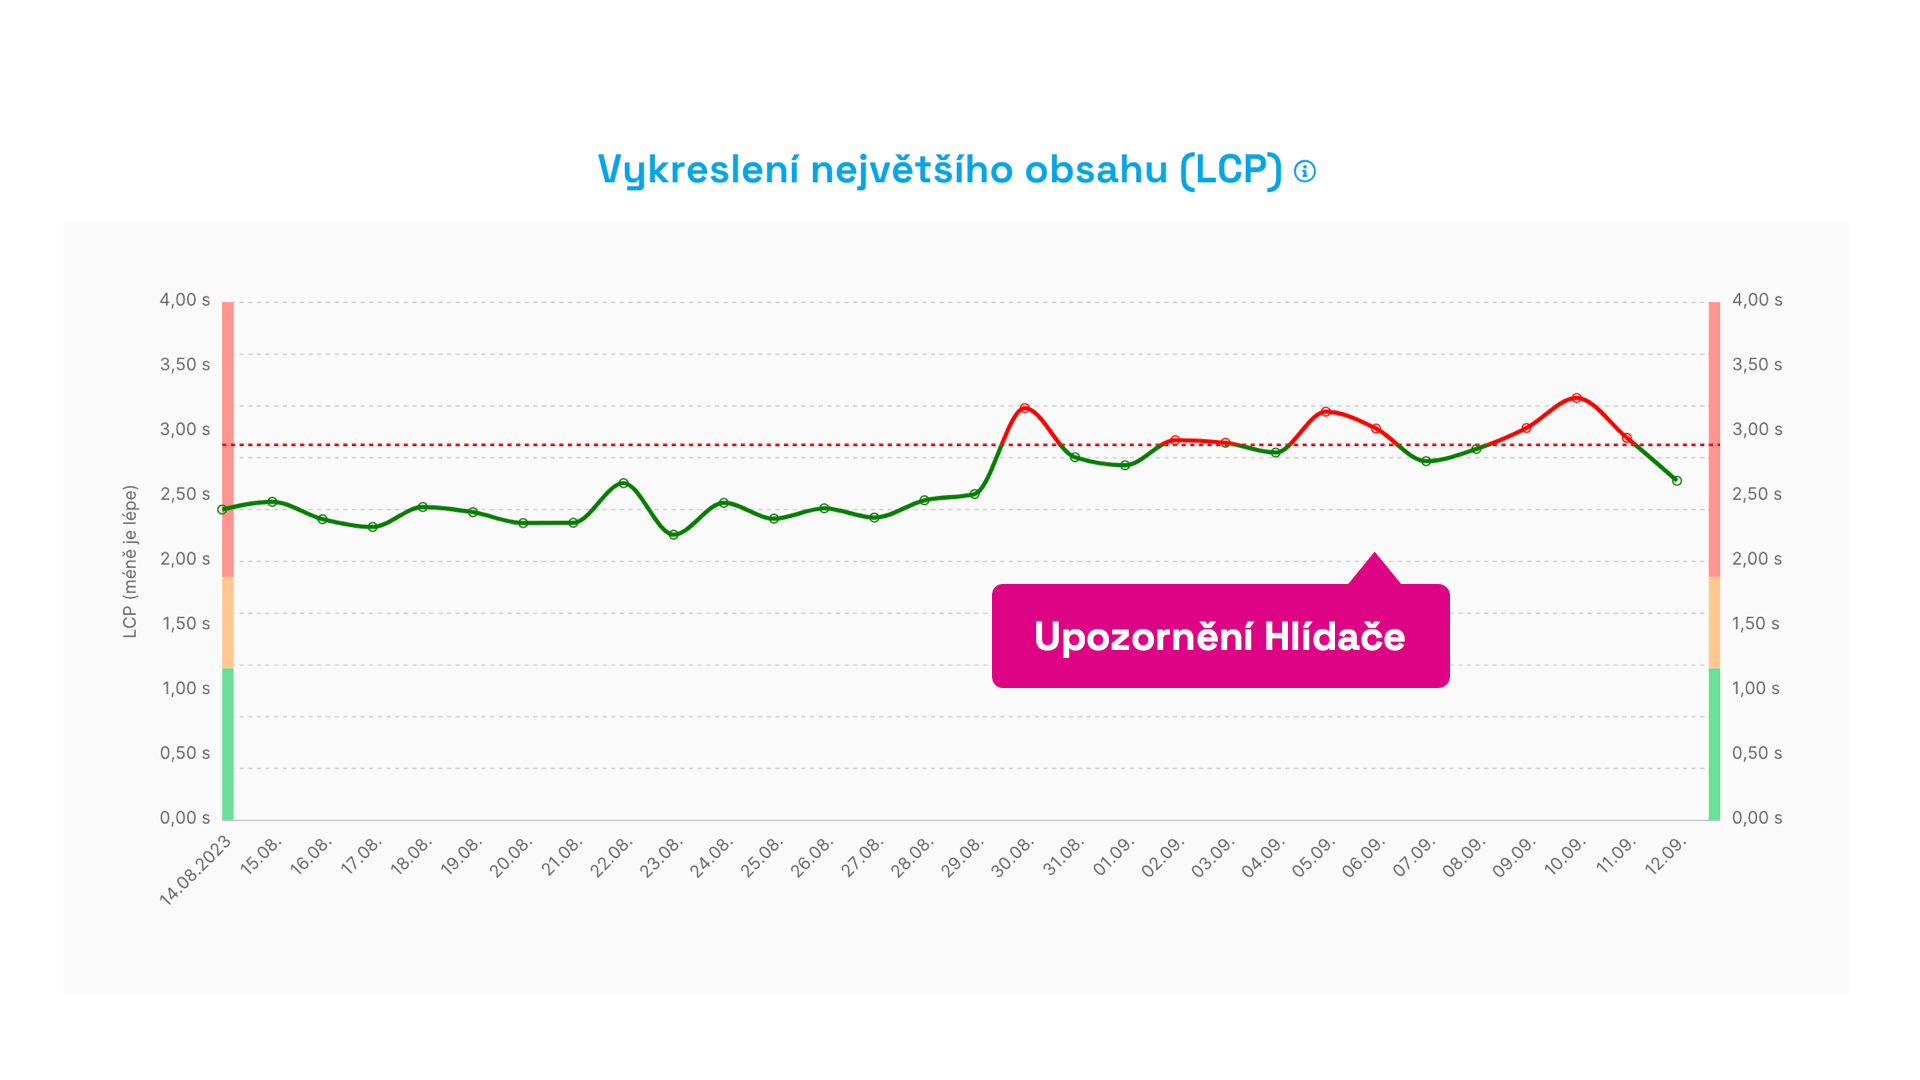 Something's gone wrong here. You’ll receive an alert when a metric limit is exceeded for the third consecutive day. This avoids situations where there is a one-time anomaly.
It’s also good to know that after many iterations, we abandoned detecting metric changes based on percentages.
For instance, a 10% change in a low metric value doesn’t have the same significance as a 10% change in a higher metric value. Some metrics’ changes are more significant (let’s say LCP as part of Web Vitals), while others change very frequently (like TBT and other JavaScript metrics), and we must set the limits less sensitively.
Therefore, our algorithm uses smart detections, where different metrics behave differently at various values.
The main goal? To spam you as little as possible with insignificant changes.
What if I change the URL in the settings?
Changing or adding a URL in the test settings will naturally alter metric values due to the way calculations are performed and likely trigger notifications of metric improvement or deterioration. Now when changing the URL, a note is automatically added to the graph.
Notifications - Slack, Teams, email
We understand, and know from client practice, that not every team monitors speed measurement tools as often as necessary.
We kept this in mind while designing the Speed Monitor, and our goal was for you to ideally visit the speed tester application only when addressing a specific issue.
The Speed Monitor thus offers several ways to receive information about a problem or improvement passively:
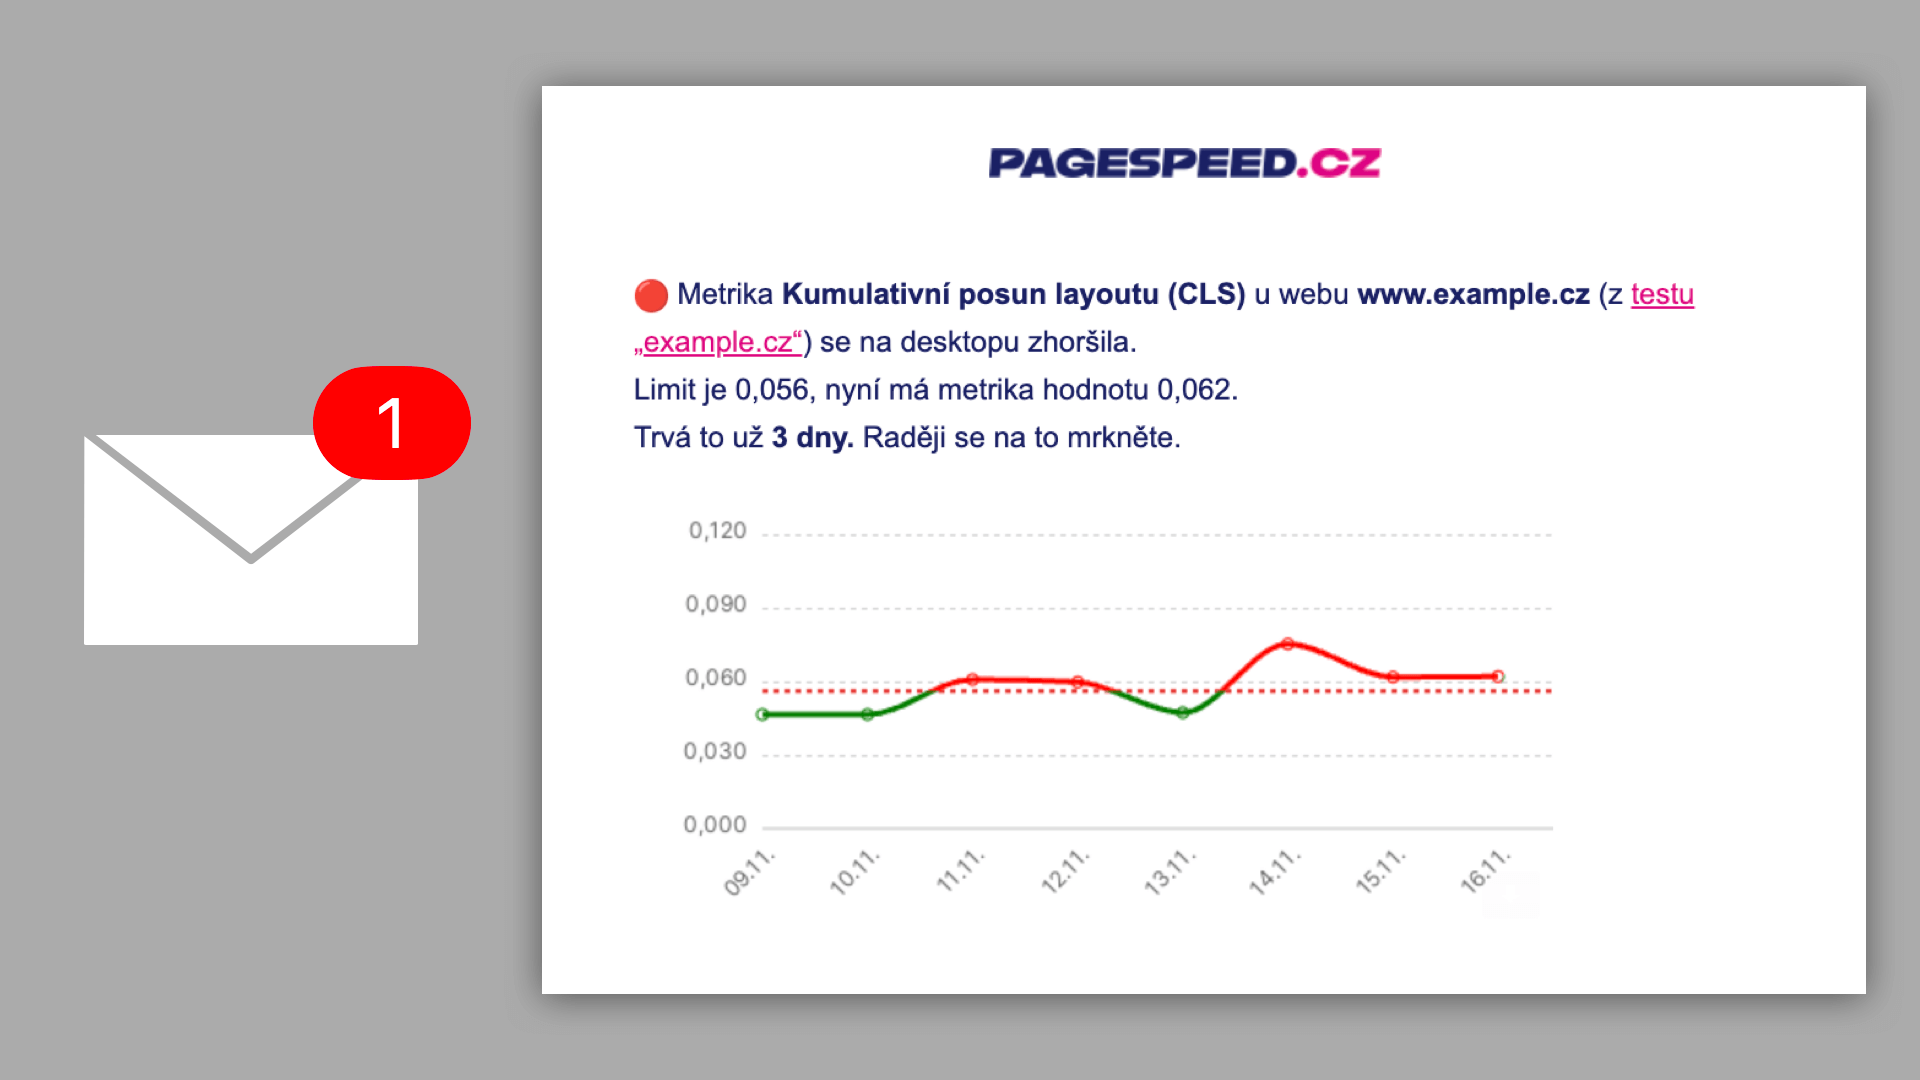 Watch out, something's gone wrong. You might want to take a look.
Speed Monitor email notifications are sent to every Team member. Of course, they can be turned off, which can be done with a single click from the incoming
e–mail.
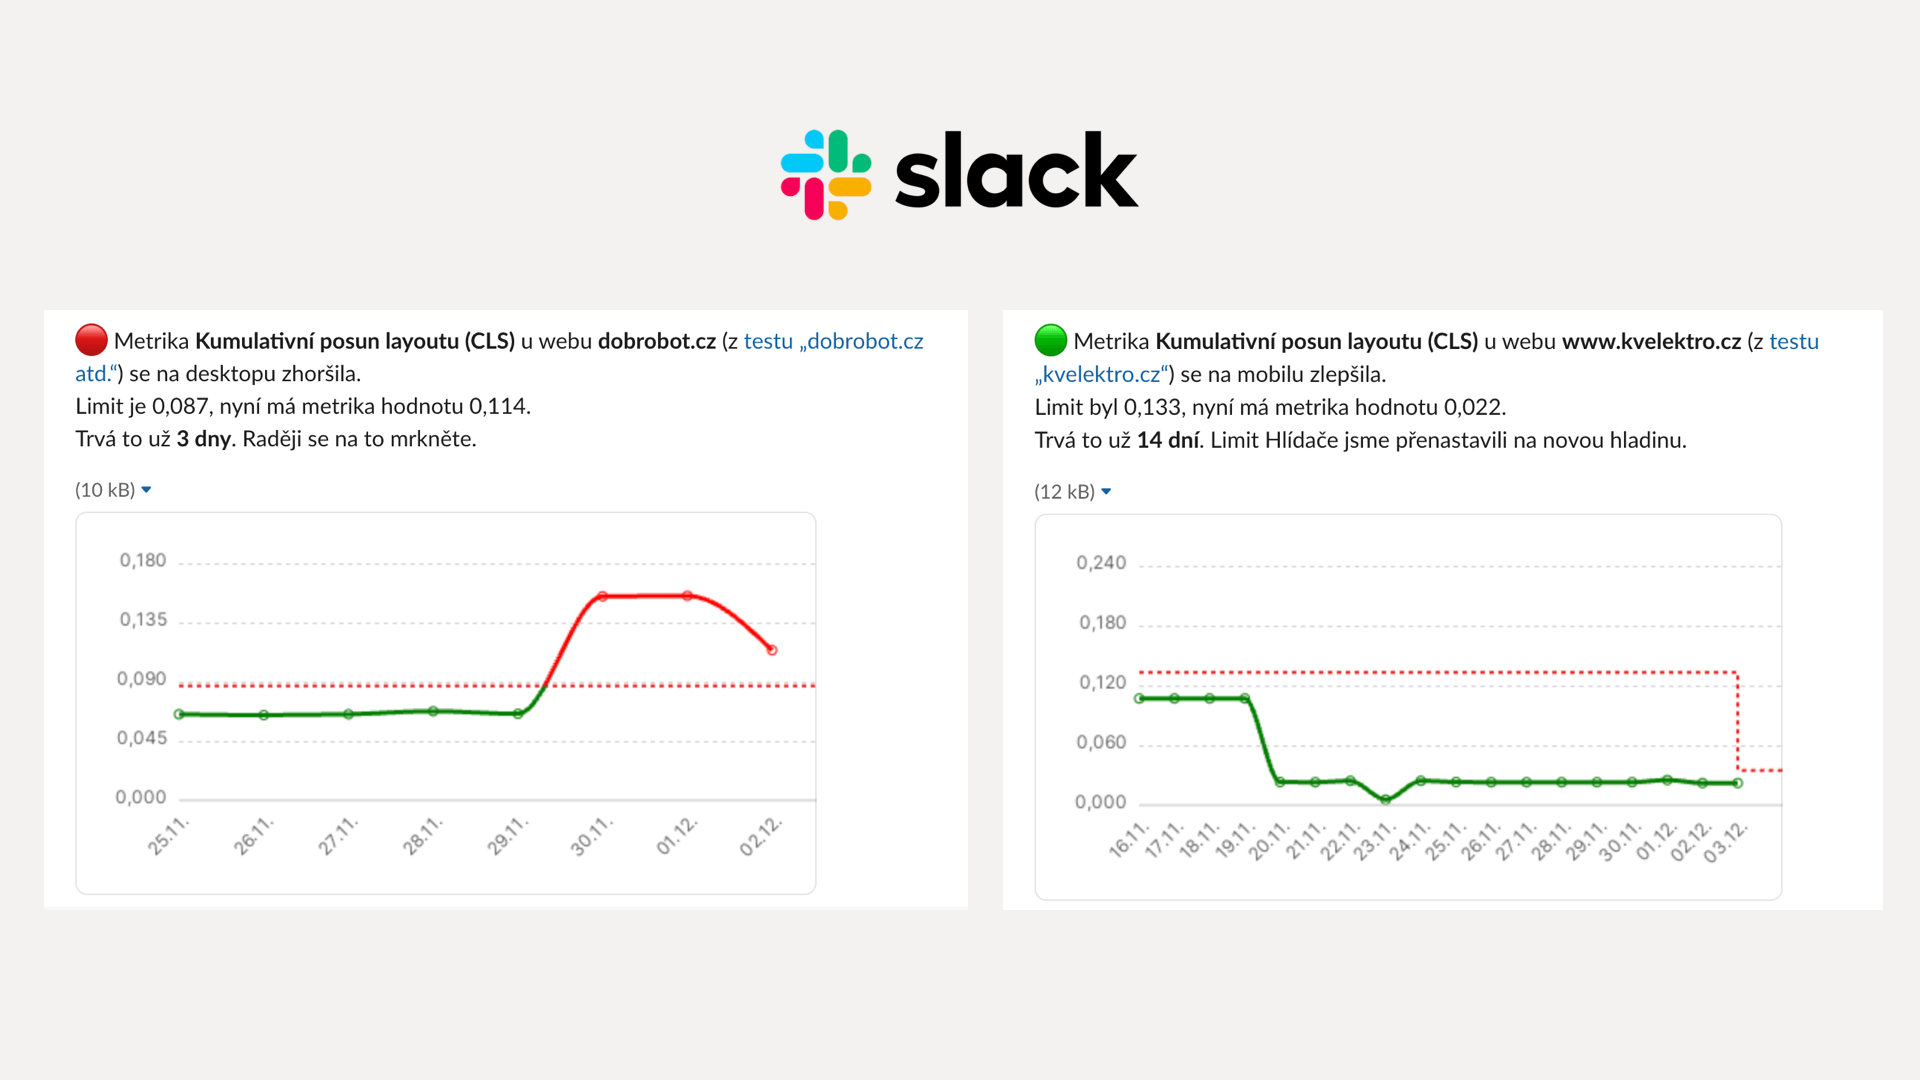 Get important but also good news sent to Slack.
Notifications to Slack and Teams are very useful if you already use these tools for internal communication.
For proper Slack and Teams setup, a few steps are needed, which we will write about later, and a brief guide is available in the settings of each test.
How to debug, i.e., find the causes of deterioration?
Let’s take a specific case of problem detection following a Monitor alert.
A notification arrives that the CLS metric on the site has worsened. In the graph, it looks roughly like this:
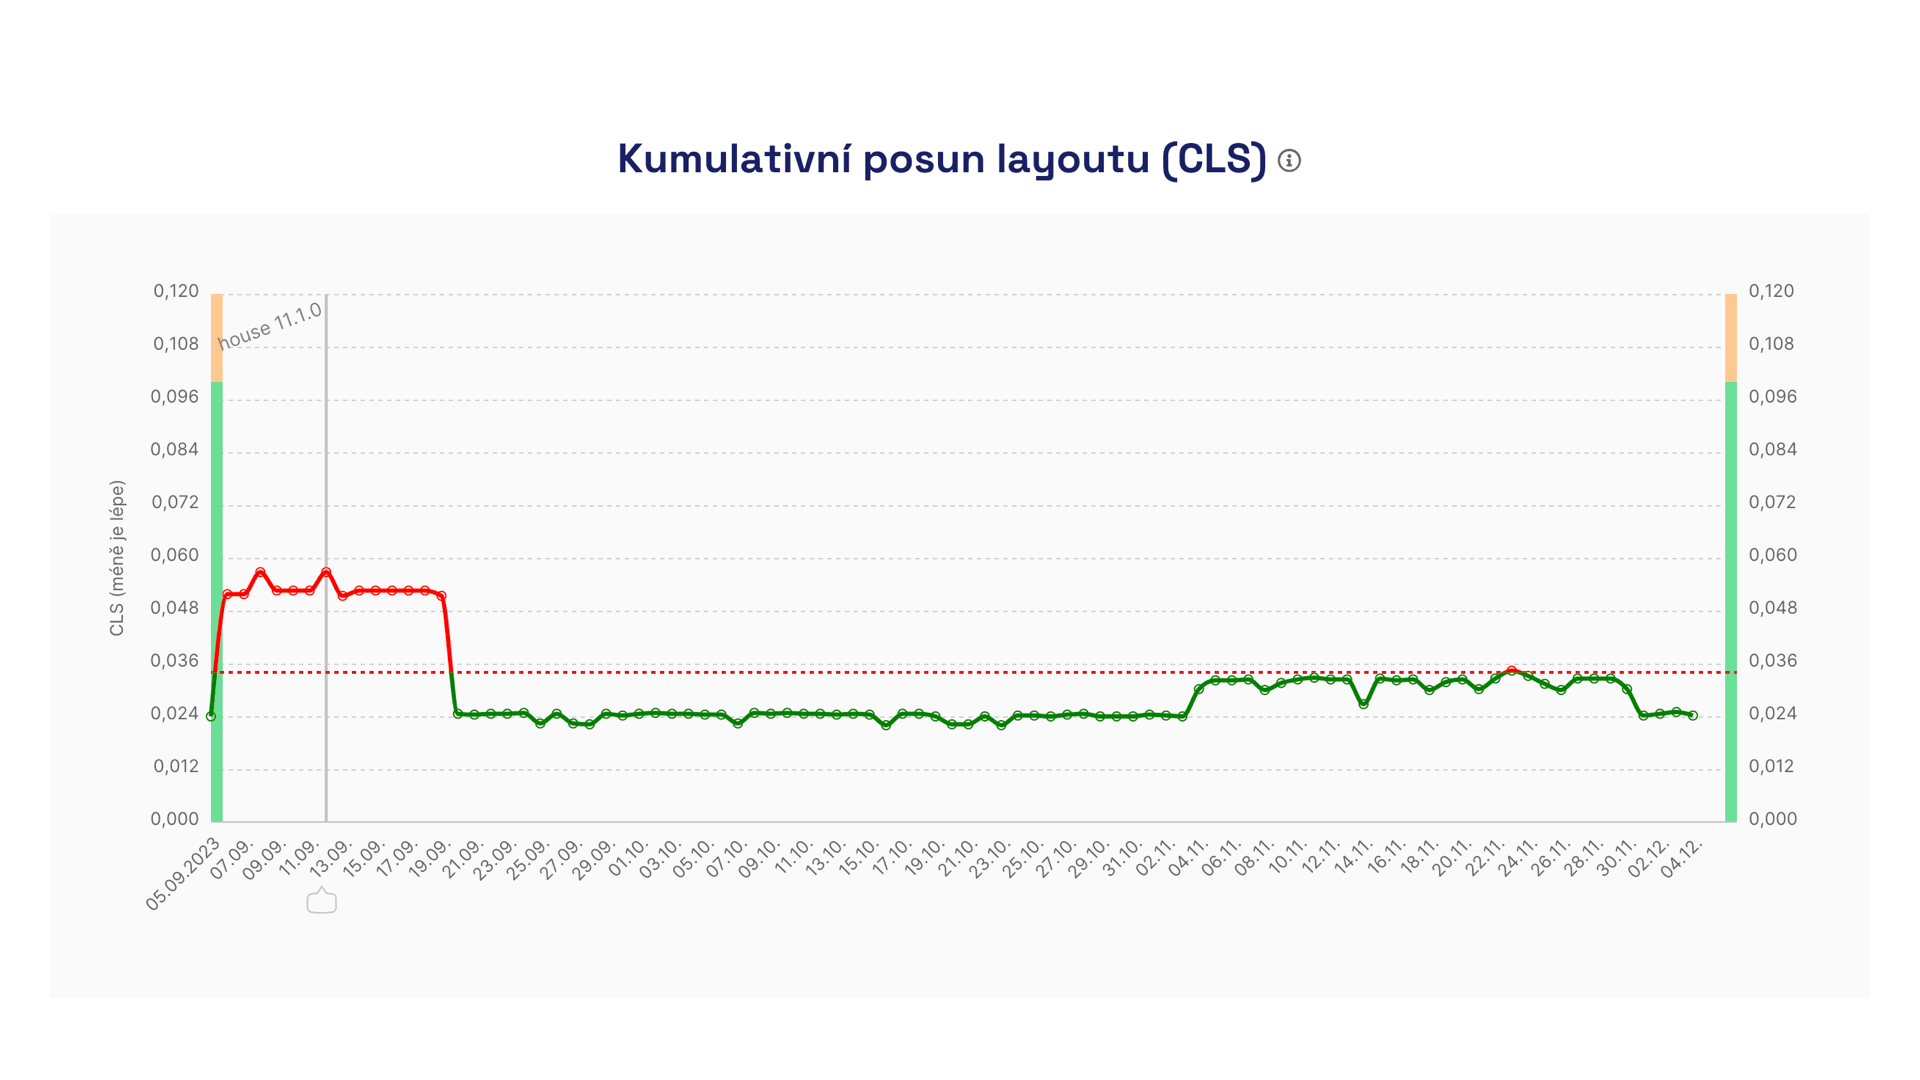 CLS metric measurement progress in the Speed Monitor.
Indeed, around September 5th, the Cumulative Layout Shift metric significantly worsened.
We see the breakdown of metric development by specific URLs after clicking into the graph:
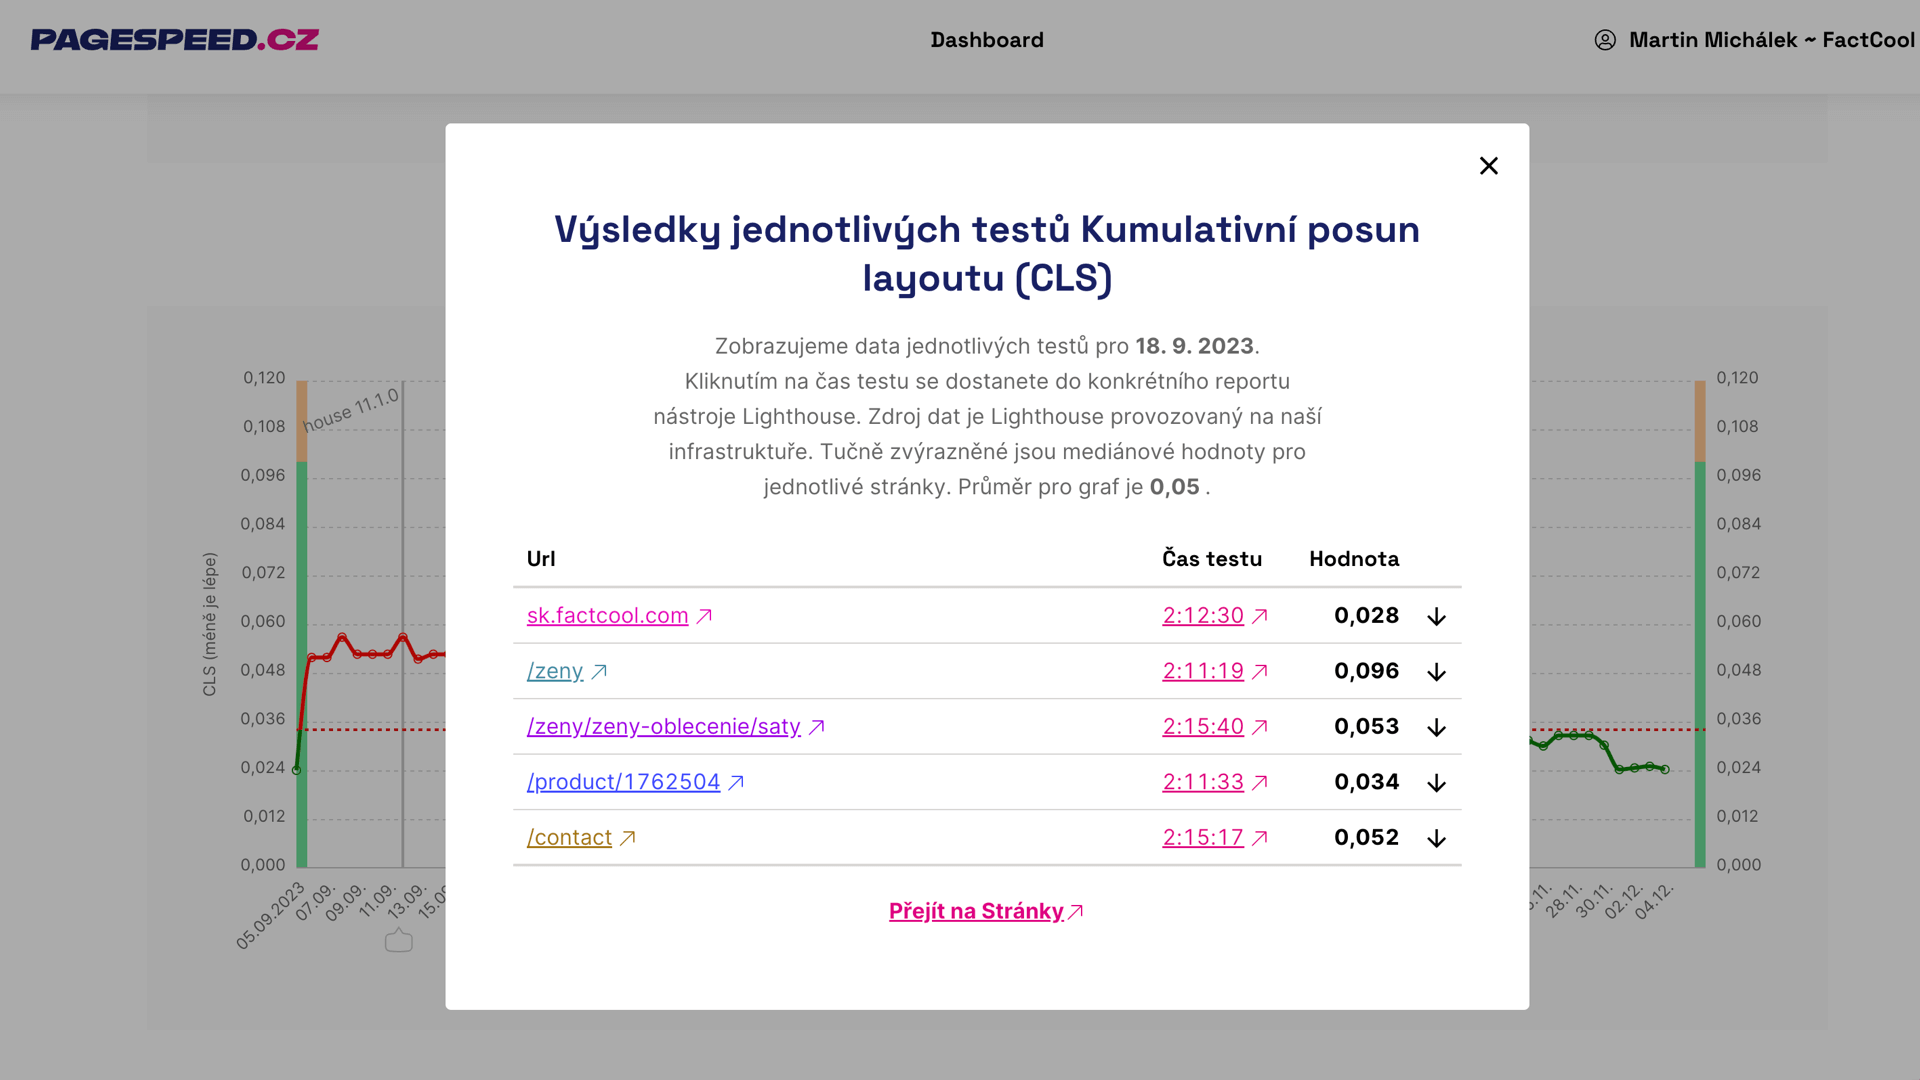 In the test results, we can see which pages are most affected.
Here, it is noticeable that all measured URLs have worsened. It is therefore clear that the cause is likely a design change across the entire site.
Clicking on a specific test time takes us to the Lighthouse report details:
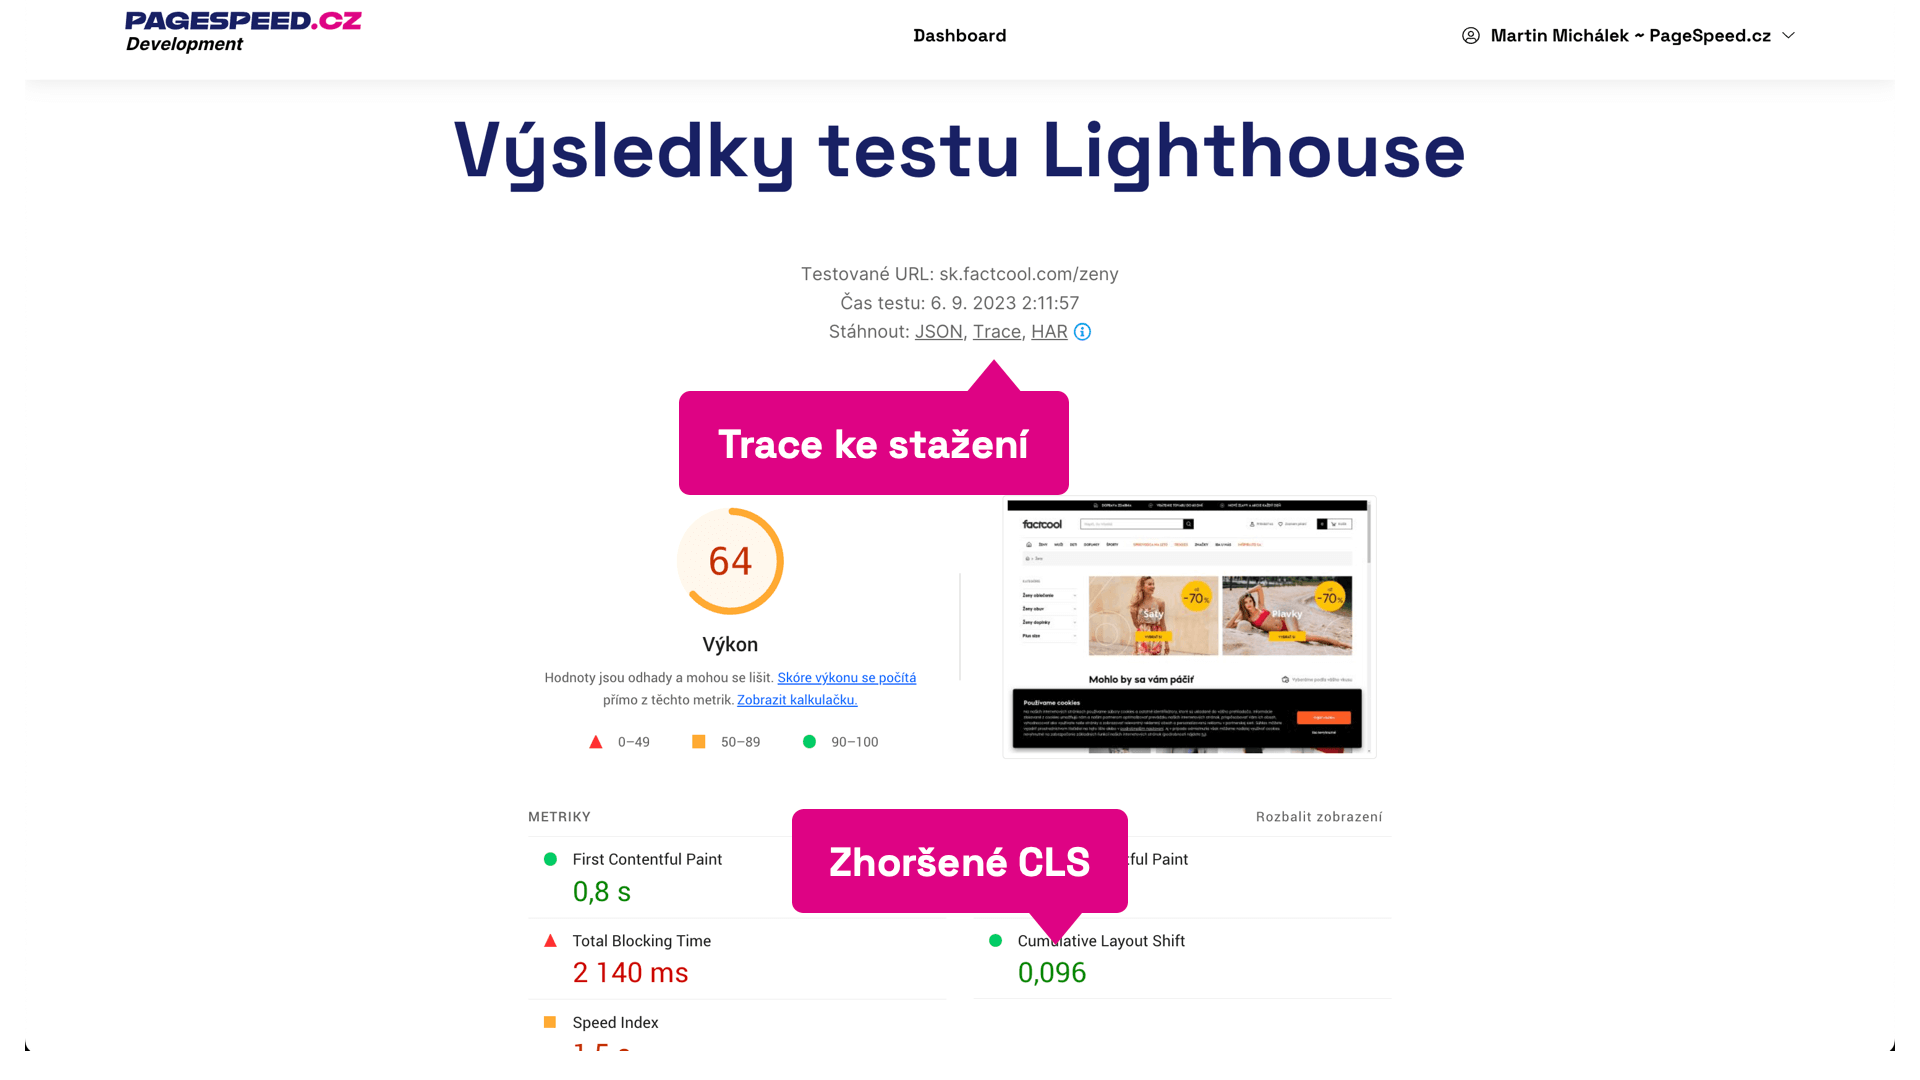 Lighthouse test results for one URL.
Here, besides the worsened CLS value, we also see the option to download detailed reports. For debugging CLS, Trace is most useful, which can be opened in tools like the Performance tab in Chrome DevTools.
Here we focus on layout shifts and see that the last one is caused by an asynchronously rendered top bar. This is also a difference from previous measurements and a problem that we can report to the development team.
The Monitor is the most important feature of tests PLUS. We’ve seen that with the help of the Monitor, no problem escapes us, notifications can be delivered through various channels, and there won’t be too many of them. In the tester itself, we can then find the problem.