Additional Updates in PLUS Testing (Stable Infrastructure, “Technical” Report, and Notes in Graphs)
Beyond the Speed Watchdog and notifications, monitoring PLUS introduces a myriad of new features that simplify monitoring and evaluating your website’s speed.
In this document, we focus on three standout features:
- Proprietary stable testing infrastructure.
- New “Technical” report.
- Notes in graphs.
Stable Numbers (Proprietary Lighthouse and Testing Infrastructure)
In the PLUS version, you have access to our own testing infrastructure, where the open-source tool Lighthouse runs daily tests on your website.
Why is proprietary infrastructure so crucial for professional speed testing? There are two main reasons:
- Stability of results, which minimizes the influence of external factors on your tests.
- Ability to leverage additional features, such as storing the Trace report.
Let’s delve into why this is so important.
Stability of Results
In the free tester version, we've been providing results from the PageSpeed Insights API, which Google freely offers, since development began.
However, there’s a catch: results from the PageSpeed Insights API are unstable.
Google collects PageSpeed Insights results at various times, from various locations, and from different parts of its infrastructure. Therefore, the data gathered is more suitable for one-off tests or long-term trend monitoring, not day-to-day changes.
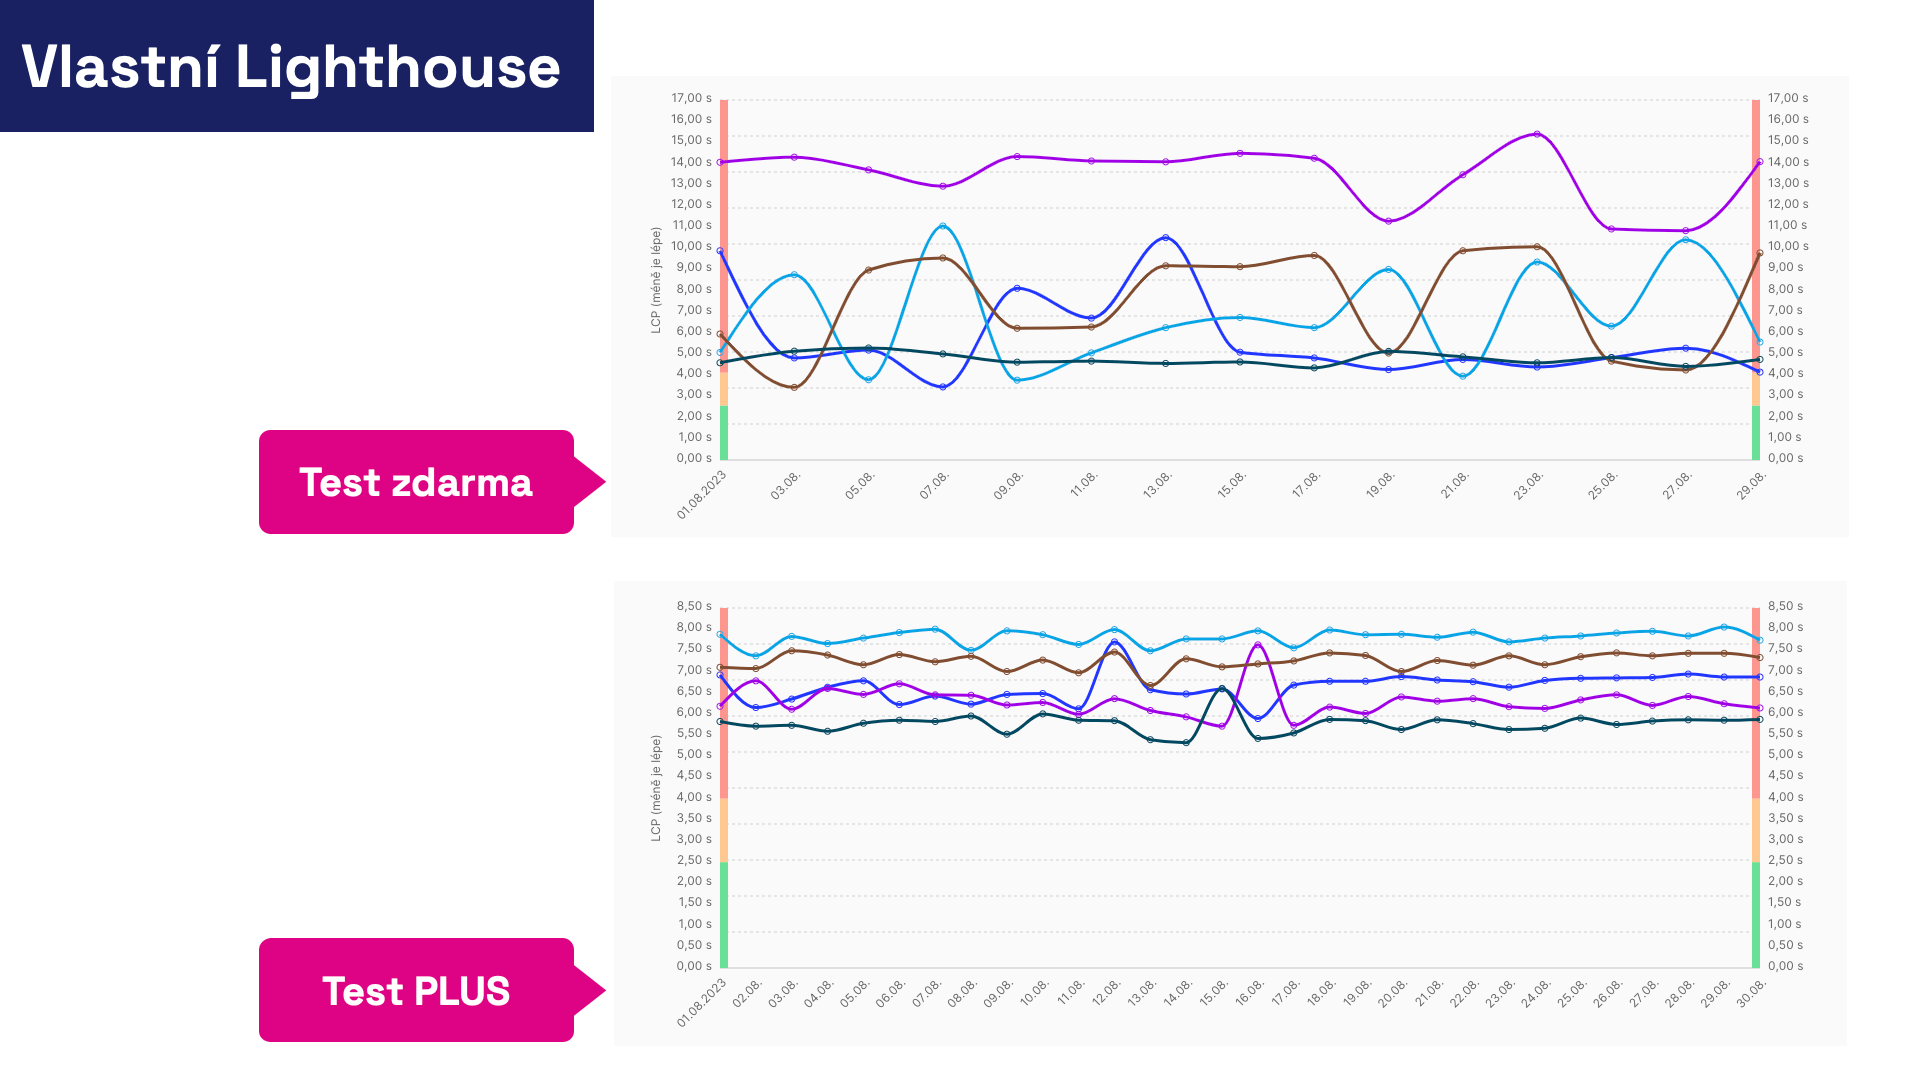
The Lighthouse test results from our infrastructure are shown in the image below. The data is significantly more stable, allowing you to better distinguish between trivial fluctuations and lasting metric changes.
Test Results and JSON, Trace, HAR
In the PLUS version, you can trust even specific results of individual Lighthouse tests more. Plus, we've enriched them with the ability to download source files, which you can use to find more opportunities for speeding up your website.
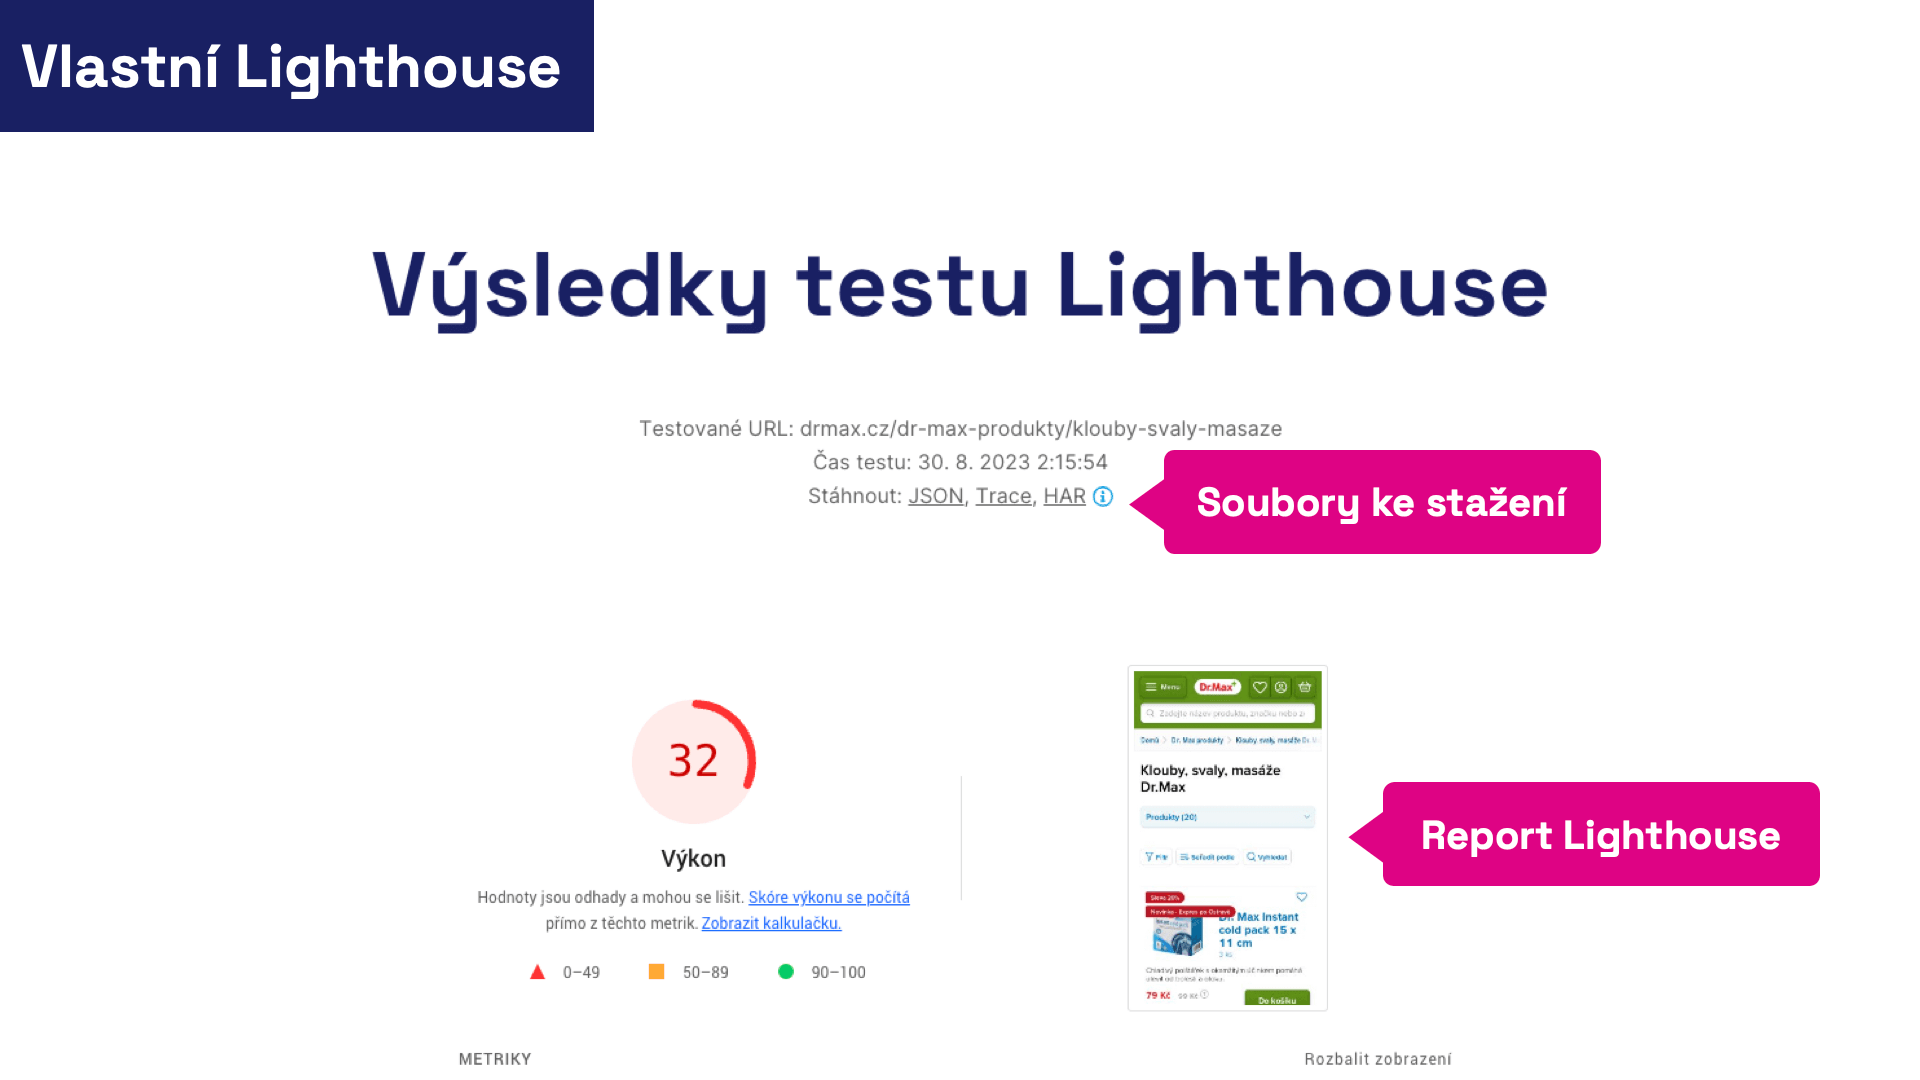 Lighthouse test results are richer with several features in the new version.
What do the mysterious acronyms JSON, Trace, and HAR on the image mean?
All three files are essential aides for any speed optimizer seeking to identify causes of changes or opportunities for improvement.
- JSON: A portable output of the Lighthouse report. Open it in the Lighthouse Report Viewer or compare it with another test in Lighthouse Diff. This is useful for comparing two speed tests in case of changes or for saving a test that shows unexpectedly positive or negative results for future reference.
- Trace: A detailed report of page performance. It can be opened in the Performance tab within Chrome DevTools or in a tool like Trace.Café. In our web speed consultancy, we consider Trace the most crucial depiction of the real loading speed and subsequent page performance.
- HAR: A report of page downloads. Open it in the Network tab inside Chrome DevTools. It’s a supplementary report that shows potential issues in page loading, including element prioritization, resource sources, protocol use, or compression.
We are thrilled to offer these beloved tools in the PLUS version.
How Exactly Do We Test Using Lighthouse?
Based on our experiences with other tools during web speed consultancy and numerous experiments conducted during the new tester’s development, we have settled on the following method for testing each URL:
- Night Hours For short-term (days) and longer-term (months) monitoring, we consider nighttime to be best practice. At night, your servers aren’t under as much strain, allowing us to test more calmly and observe long-term speed trends or deterioration. Server response speed affects user Metrics we observe, such as LCP or FCP. Our experience shows that night results are much more stable and provide better insights into metric trends over time. If night hours are unsuitable for you, for example, because tests coincide with ongoing site maintenance, you can change the test start time in the settings.
- Five Times in Quick Succession We know that one-off tests, like PageSpeed Insights in our free tests, can show very inaccurate results. Through experimentation, we found the need to perform five tests, which removes most inaccuracies and achieves maximum number stability. Tests occur several minutes apart, with precise times always visible in the Lighthouse test details.
- Once Daily Each URL is tested daily within a few minutes, with these tests running mostly at night. It's important to note that our goal is not to monitor availability, which requires much more frequent testing, but to track the development of user metrics such as LCP, CLS, or INP.
Testing is done on Amazon Web Services (AWS) infrastructure in Europe, but in the future, tests can be conducted from virtually anywhere.
“Technical” Report
The modern field of website speed tuning no longer primarily tracks technical indicators like the data volume of page elements or the number of files coming from the server.
From our web speed consultancy, we know that even websites downloading large amounts of data can be fast for users thanks to good optimization of the initial display.
Nonetheless, we are pleased to introduce the “Technical” report, which monitors these secondary indicators. Data volume, number of requests, and other metrics are worth tracking for different reasons:
- Technical metrics are useful for finding correlations between changes in user metric values (e.g., LCP, CLS, INP) and changes during web development (e.g., image data volume or blocking JavaScript size).
- Saving on data volume is considered courteous to users who may have limited data resources on mobile.
- Generally, the less data transferred, the more the website operator saves on infrastructure.
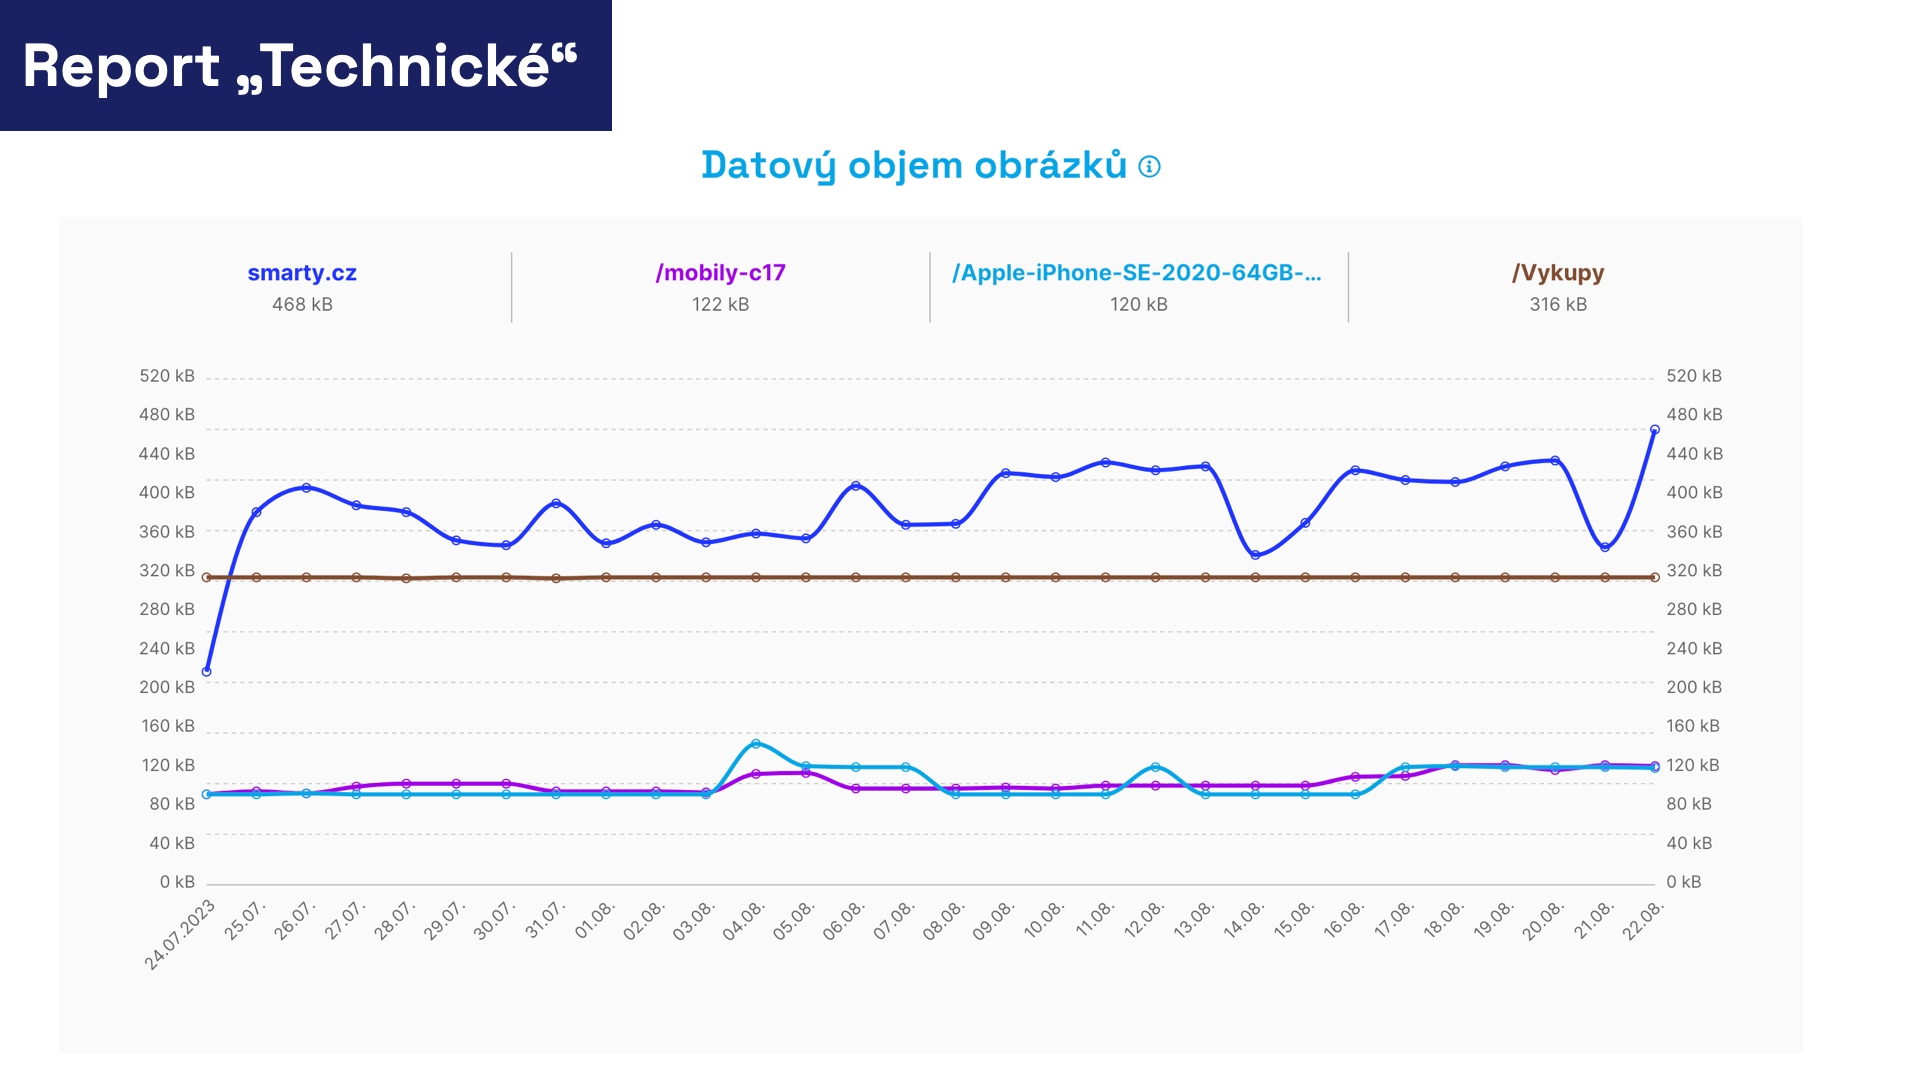
In monitoring PLUS, you'll see the “Technical” report for all page types you add to the test settings.
As shown in the graph below, we display both the current state of the Metric and its development over time, separately for mobile and desktop.
 It’s a bit heavy, but at least it’s stably heavy. They’re images.
Based on our consultancy experience, we've included the following information in the “Technical” report:
- HTML Data Volume Development of HTML data volume for individual pages. It reflects the state in which HTML arrived at the test browser, even after Gzip or Brotli compression. The smaller the HTML data, the better. We recommend a size under 20 kB. This affects loading metrics such as FCP or LCP.
- Number of DOM Nodes Development of the number of DOM nodes for individual pages over time. A complex DOM tree complicates JavaScript processing, potentially affecting metrics like TBT or INP. Google recommends a maximum of 1,400 DOM nodes.
- CSS Data Volume Development of CSS file data volume for individual pages over time. This is the state after potential Gzip or Brotli compression on your server. CSS is typically a resource that blocks the first render, so its size affects metrics like FCP or LCP. Ideally, keep CSS data volume under 50 kB.
- Number of Blocking JS Development of the number of JS files blocking the first render. JavaScript doesn't have to be blocking, unlike CSS. The fewer blocking JS you have, the better for metrics like FCP or LCP.
- JS Data Volume Development of JS file data volume for individual pages over time. Both files blocking the first render and non-blocking ones are listed. The graph shows the state after potential Gzip or Brotli compression on your server. The smaller the JS, the less code to process and execute by the browser. This affects interaction metrics like TBT or INP. Blocking JS also affects FCP and LCP, thus the first render.
- Third-Party JS Data Volume Development of third-party JS file data volume for individual pages over time. This category includes JS run outside your main domain, so you might see your own files located outside the main domain. Typically, you'll find data volume for foreign code for components like analytics tools, chats, A/B testing, advertising, etc. This code also affects interaction metrics like TBT or INP. It's crucial to keep it as minimal as possible.
- Font Data Volume Development of font data volume for individual pages over time. Fonts are typically a resource needed for rendering content and thus affect LCP. We recommend keeping the font data volume under 50 kB.
- Image Data Volume Development of image data volume for individual pages over time. Images are often a resource needed for rendering content and thus can affect LCP. We recommend keeping the image data volume under 100 kB per page.
- Total Data Volume Development of the total data volume of all downloaded files for individual pages over time. The total data volume may not affect metrics and user experience, but we still recommend keeping it under 0.5 MB per page.
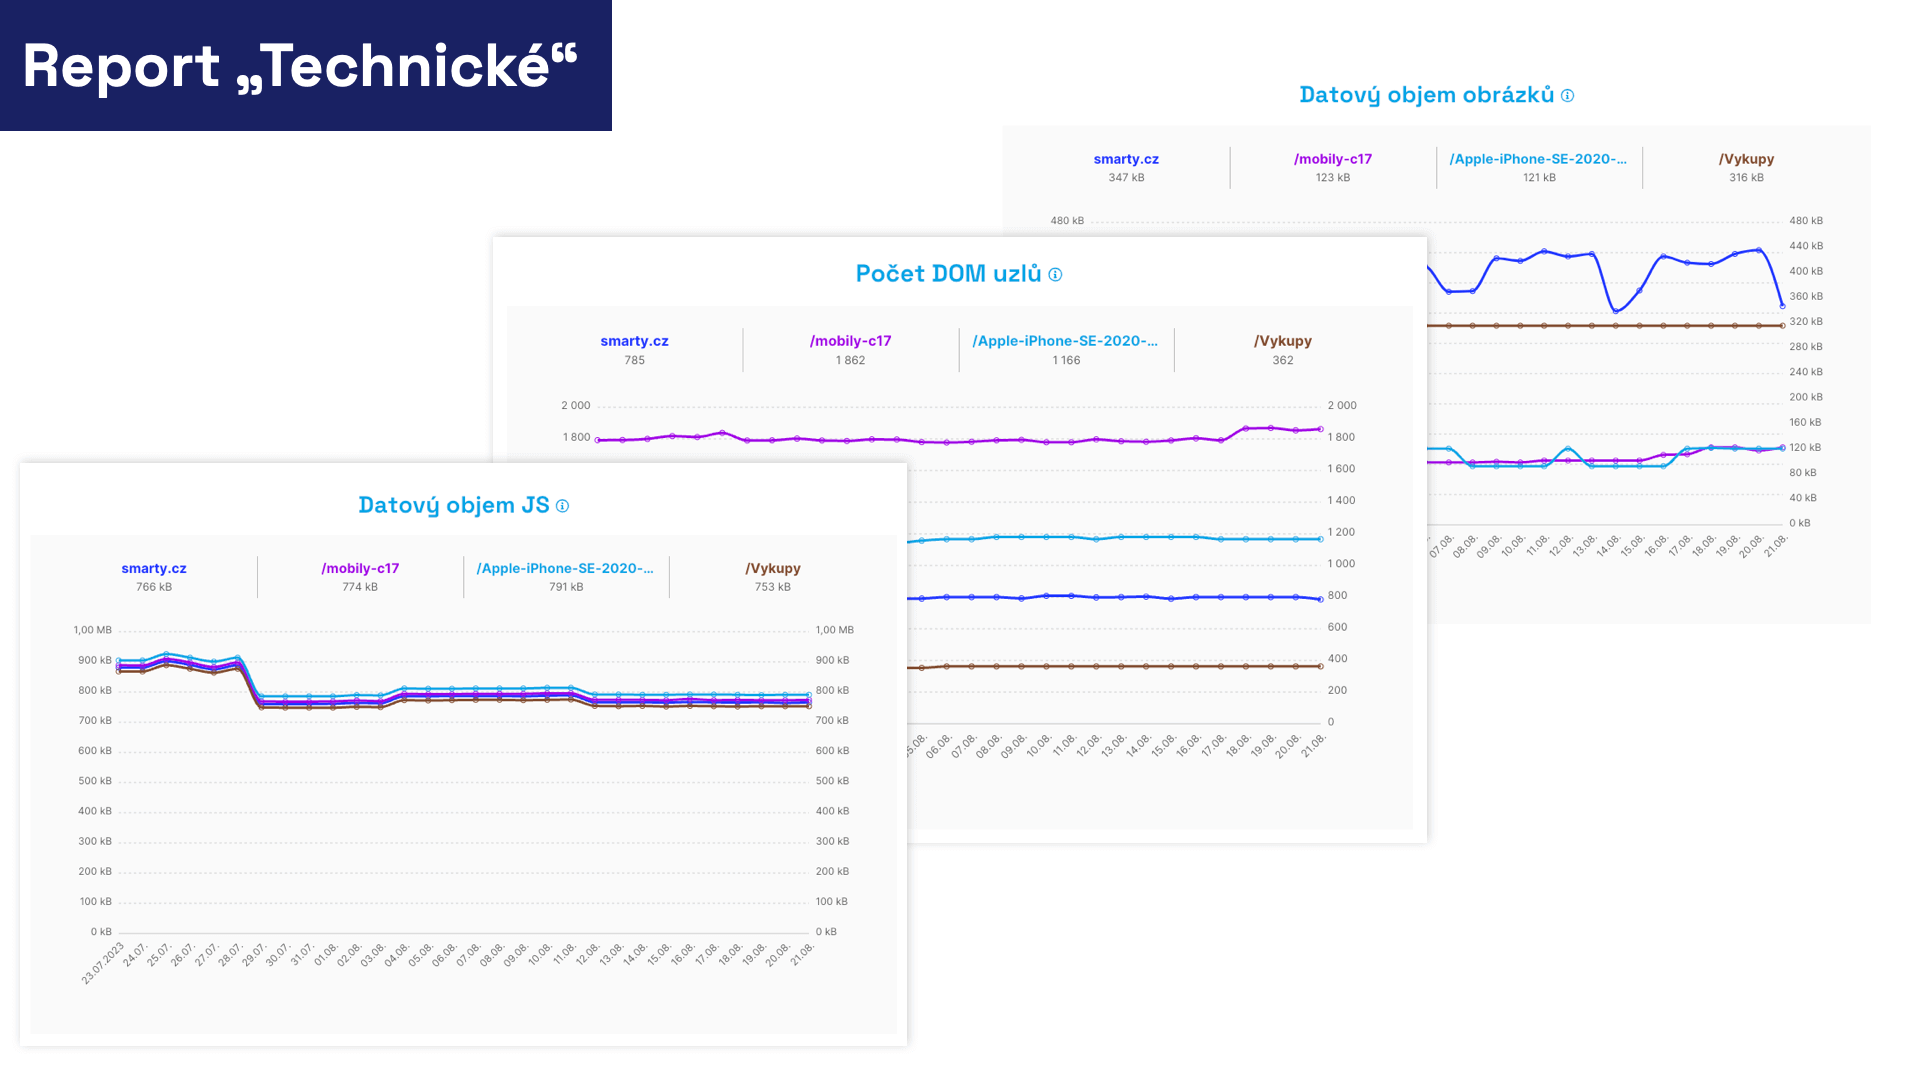 Some of the technical indicators we monitor. There are far more in the actual report.
Monitoring technical indicators can be immensely helpful when you decide to focus on one of the above metrics and specific page types.
Notes in Graphs
During web development, numerous changes occur that impact speed and metrics.
Notes in graphs of our speed tester allow you to record key moments in your site’s development history, making it easier to trace improvements or declines in metrics. These might include events such as:
- Launching a redesigned version of the site.
- Making significant backend changes.
- Implementing specific speed optimizations.
- Adding a new third-party component to the site.
- Changing measurements by modifying tracked URLs.
In the PLUS version, you can add a note to any day in any graph:
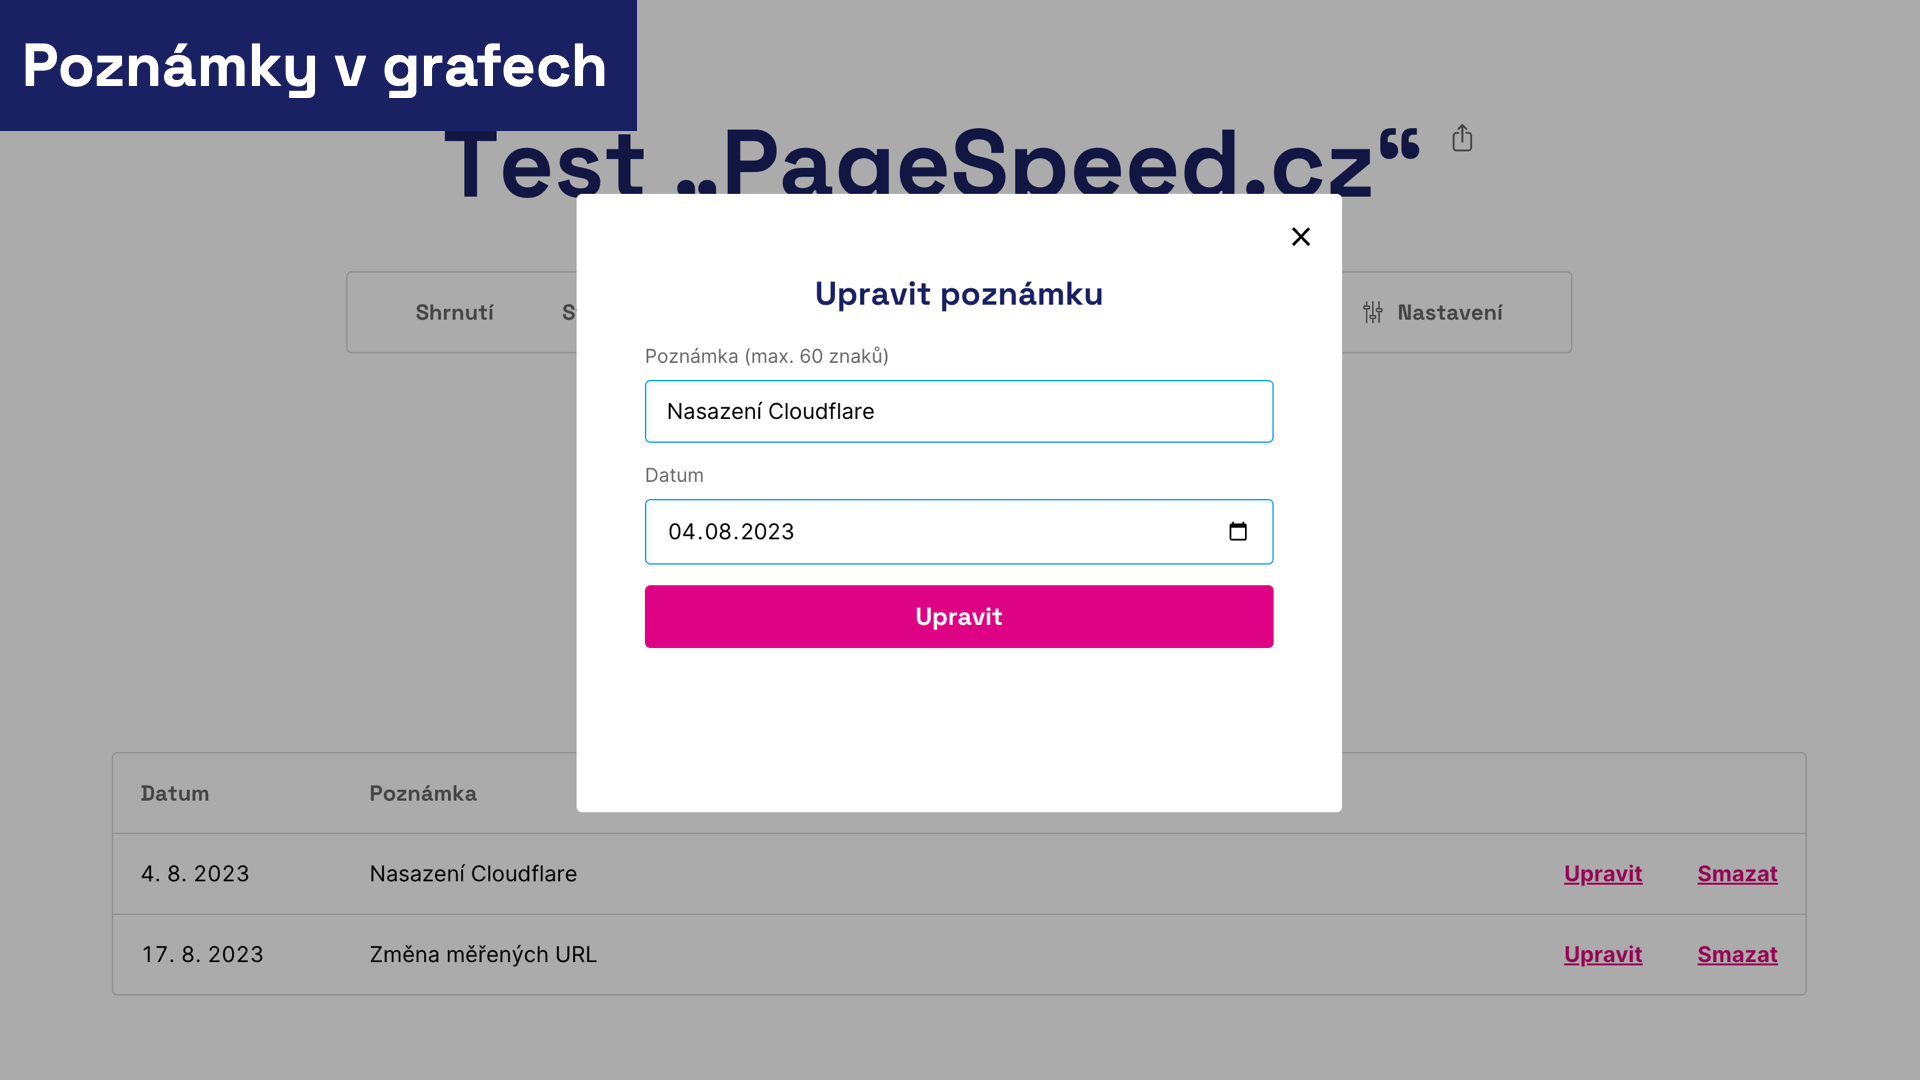 Did you deploy Cloudflare? A significant change must be recorded in the site’s history.
These crucial changes will then be visible in the graphs, providing essential context for your further work and evaluation of adjustments.
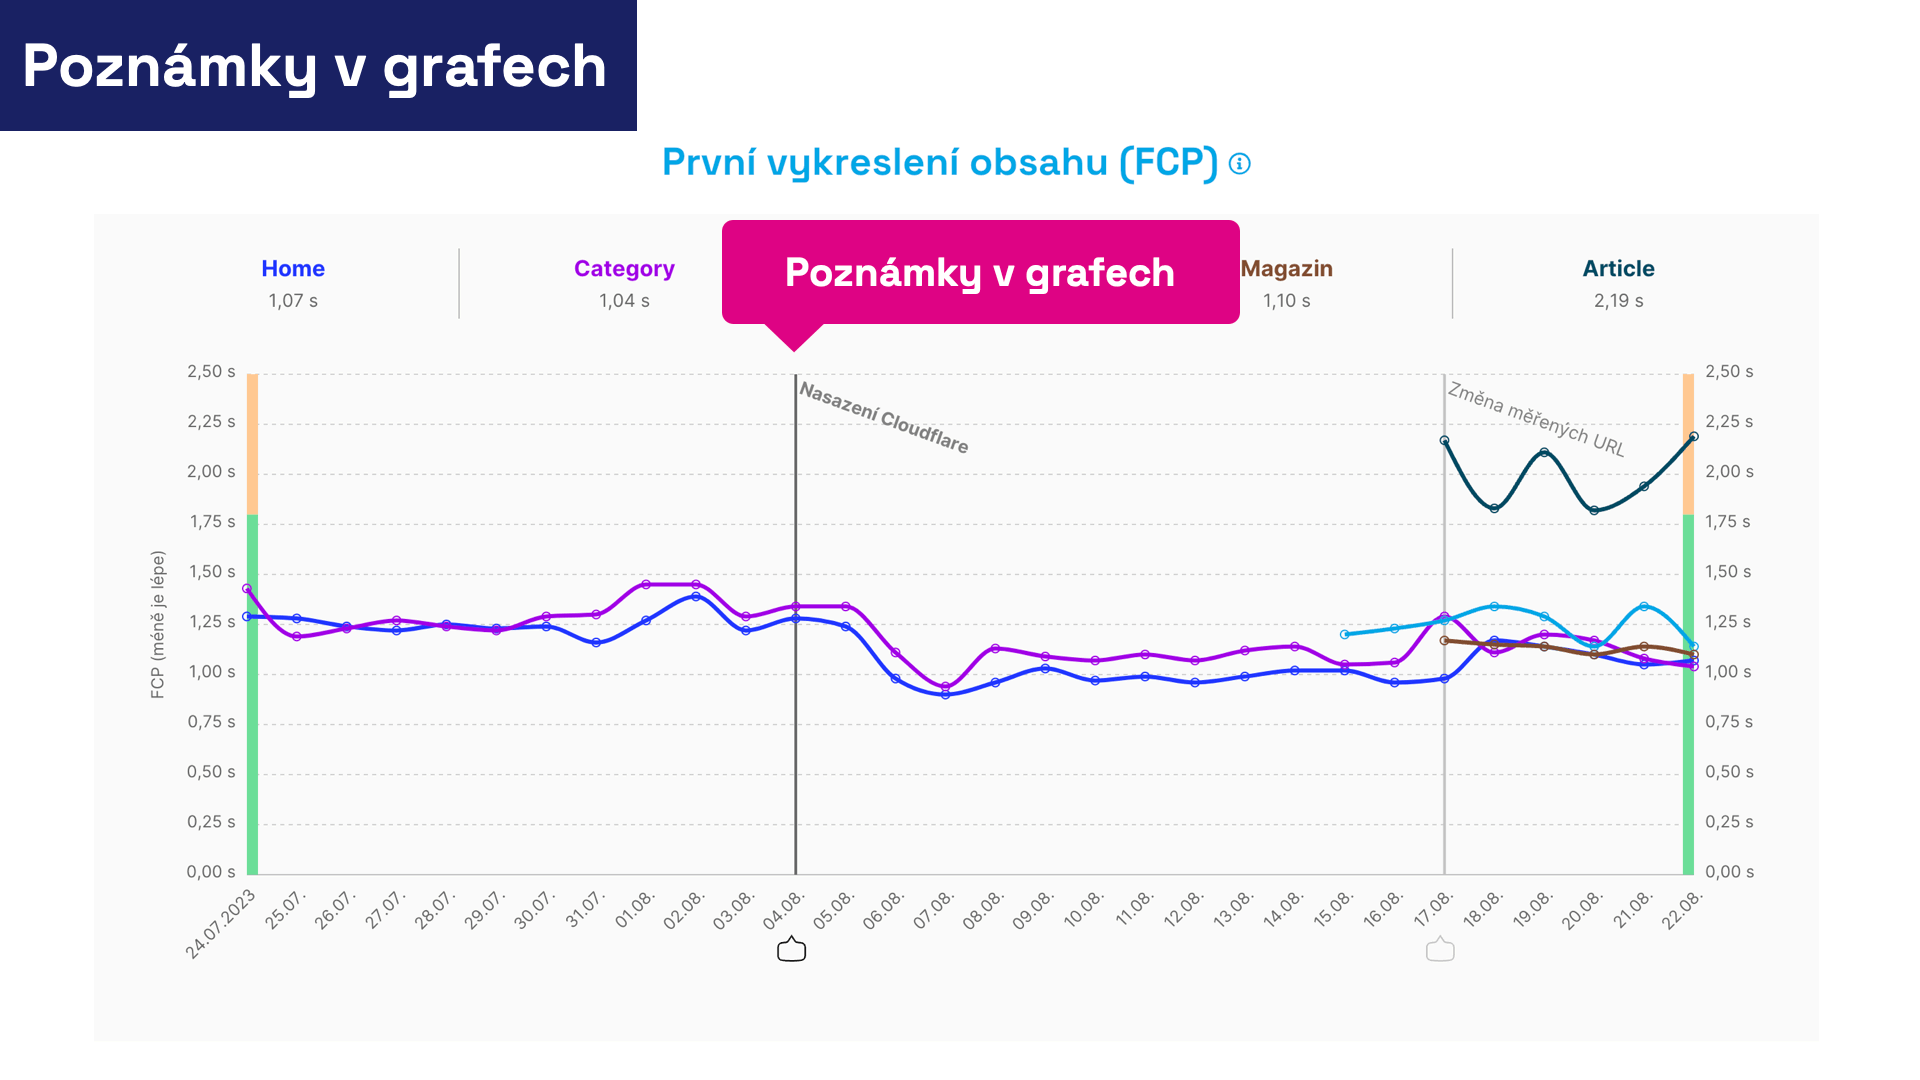 Something changed. Did it impact speed metrics?
Finally, here are some recommendations for working with notes:
- Only insert significant changes that affect speed. If you publish a new version of the site several times a week, it’s not necessary to add a note every time. Soon, you might lose track amidst the graph data.
- Don’t forget changes outside of technical web development: design modifications, third-party component deployments, A/B testing, and so on.
- Feel free to add notes retrospectively if you notice significant changes in metric graphs. These notes best explain the impact of each change and teach you to evaluate the impact of future adjustments.
- Remember to add a note if you change the test settings. Each addition or change of URL will affect, for example, the graphs and alerts from the Speed Watchdog.
Notes are a relatively unobtrusive yet highly useful tool for anyone who cares about the speed development of their websites.
Additional Features in PLUS Version
5 Thoroughly Tested URLs
We recommend conducting detailed testing of one site within a single PLUS test. If your site has multiple language versions, we suggest URLs of all key pages of the most important site.
Each URL is tested thoroughly every day. Data is collected using Lighthouse tests running on proprietary infrastructure, as well as public Chrome UX Report data.
Tested addresses also count as a source for regular speed checks using the Watchdog.
5 Tested Domains
In addition to detailed tests, we allow you to monitor user data from the Chrome UX Report for additional domains.
This is useful if your site has multiple language versions in the form of second-level domains or subdomains, like third-level domains. It’s also possible to track your competitor’s results here.
If you need to monitor more domains, we recommend adding free tests to your team’s dashboard, which also allows this.
Ability to Change Testing Time
Our free tests don’t allow changing test times, which is inconvenient if you don’t want tests to coincide with ongoing night maintenance.
In the PLUS test, you can choose an approximate test start time, avoiding maintenance.
Yearly Data History
While free tests track and display only three months of data history, monitoring PLUS allows you to display up to a year’s data history, with data archived for a little longer.
Non-Public Addresses
Data in free tests isn’t hidden from people or machines like Googlebot. In paid tests, we protect your privacy, and the URLs of your reports aren’t accessible.
However, the report data can be shared with unregistered colleagues via a special sharing URL.
Take a look at other features of monitoring PLUS.