“Pages” Report
The “Pages” report shows the status and evolution of the speed of measured URLs.
It answers questions such as:
- How are we currently doing with the speed of measured URLs, and what is the trend?
- Have optimizations for specific URLs been successful?
- Which pages have the most significant impact on the speed changes of the entire domain?
The “Pages” report is among our more advanced tools. It appeals to those keen on delving deeper into web speed, typically developers and other speed optimizers.
For website owners and other managers, it might be more fitting to follow the “Domains” report.
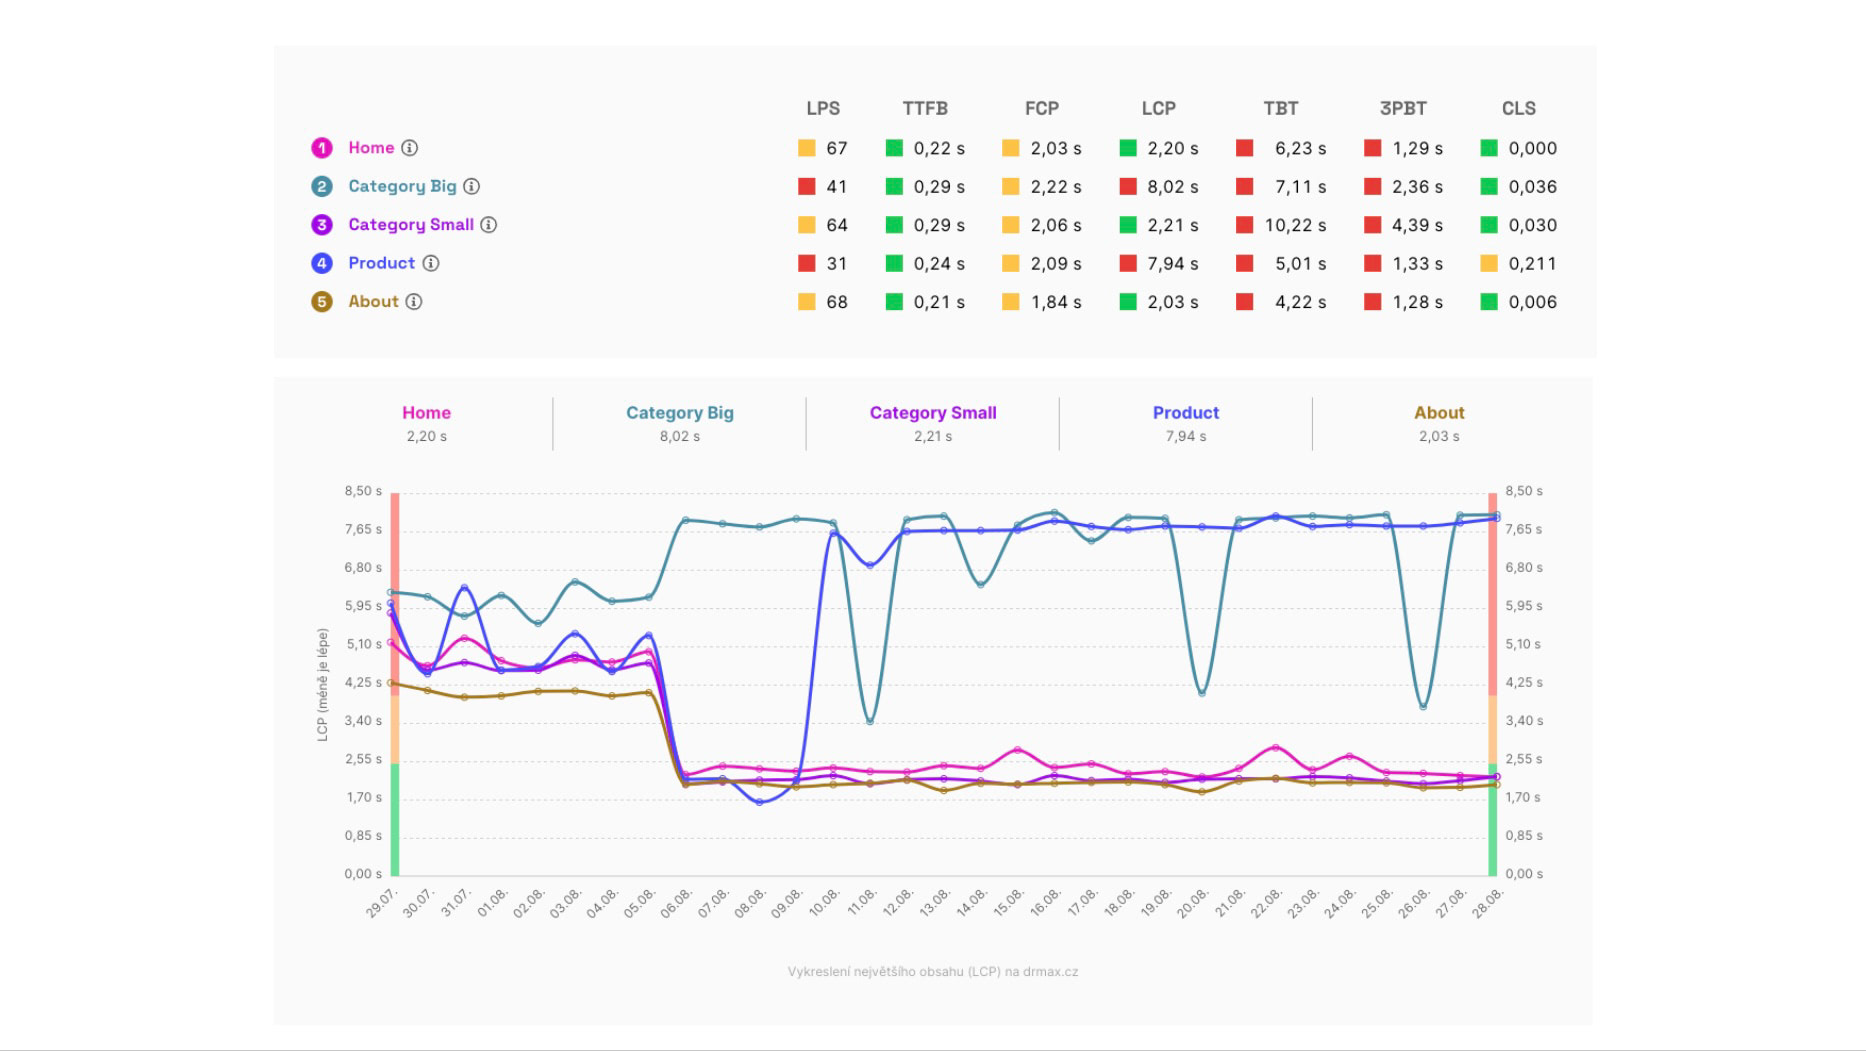 The state of synthetic metrics (top) and the evolution of the LPS metric for one of the measured sites.
Before proceeding, ensure you have the following points in mind:
- It's crucial to understand the differences between various types of speed measurements. The “Pages” report uses data from synthetic measurements and Google users (CrUX).
- You should also be familiar with how we measure web speed in our monitoring.
- It's highly recommended to properly set up the measured pages.
- It's also useful to know how the Domains report or the Speed Watchdog works.
Ready? Let’s continue.
Watchdog vs. Domains vs. Pages
Let's first clarify the relationship between these three major reports in our speed monitoring.
The Watchdog monitors the speed of URLs you've set, notifying you of any positive or negative changes. The Watchdog uses synthetic data, offering very current figures, though it may not always be entirely accurate.
The Domains report cannot report day-to-day changes since it uses data from the Chrome UX Report (CrUX). These data, however, are very precise, making them ideal for verifying any Watchdog alerts. However, data from Google users don't reveal which specific parts of the website are changing.
The Pages report doesn't announce changes but allows you to see which specific URLs caused changes after each Watchdog notification.
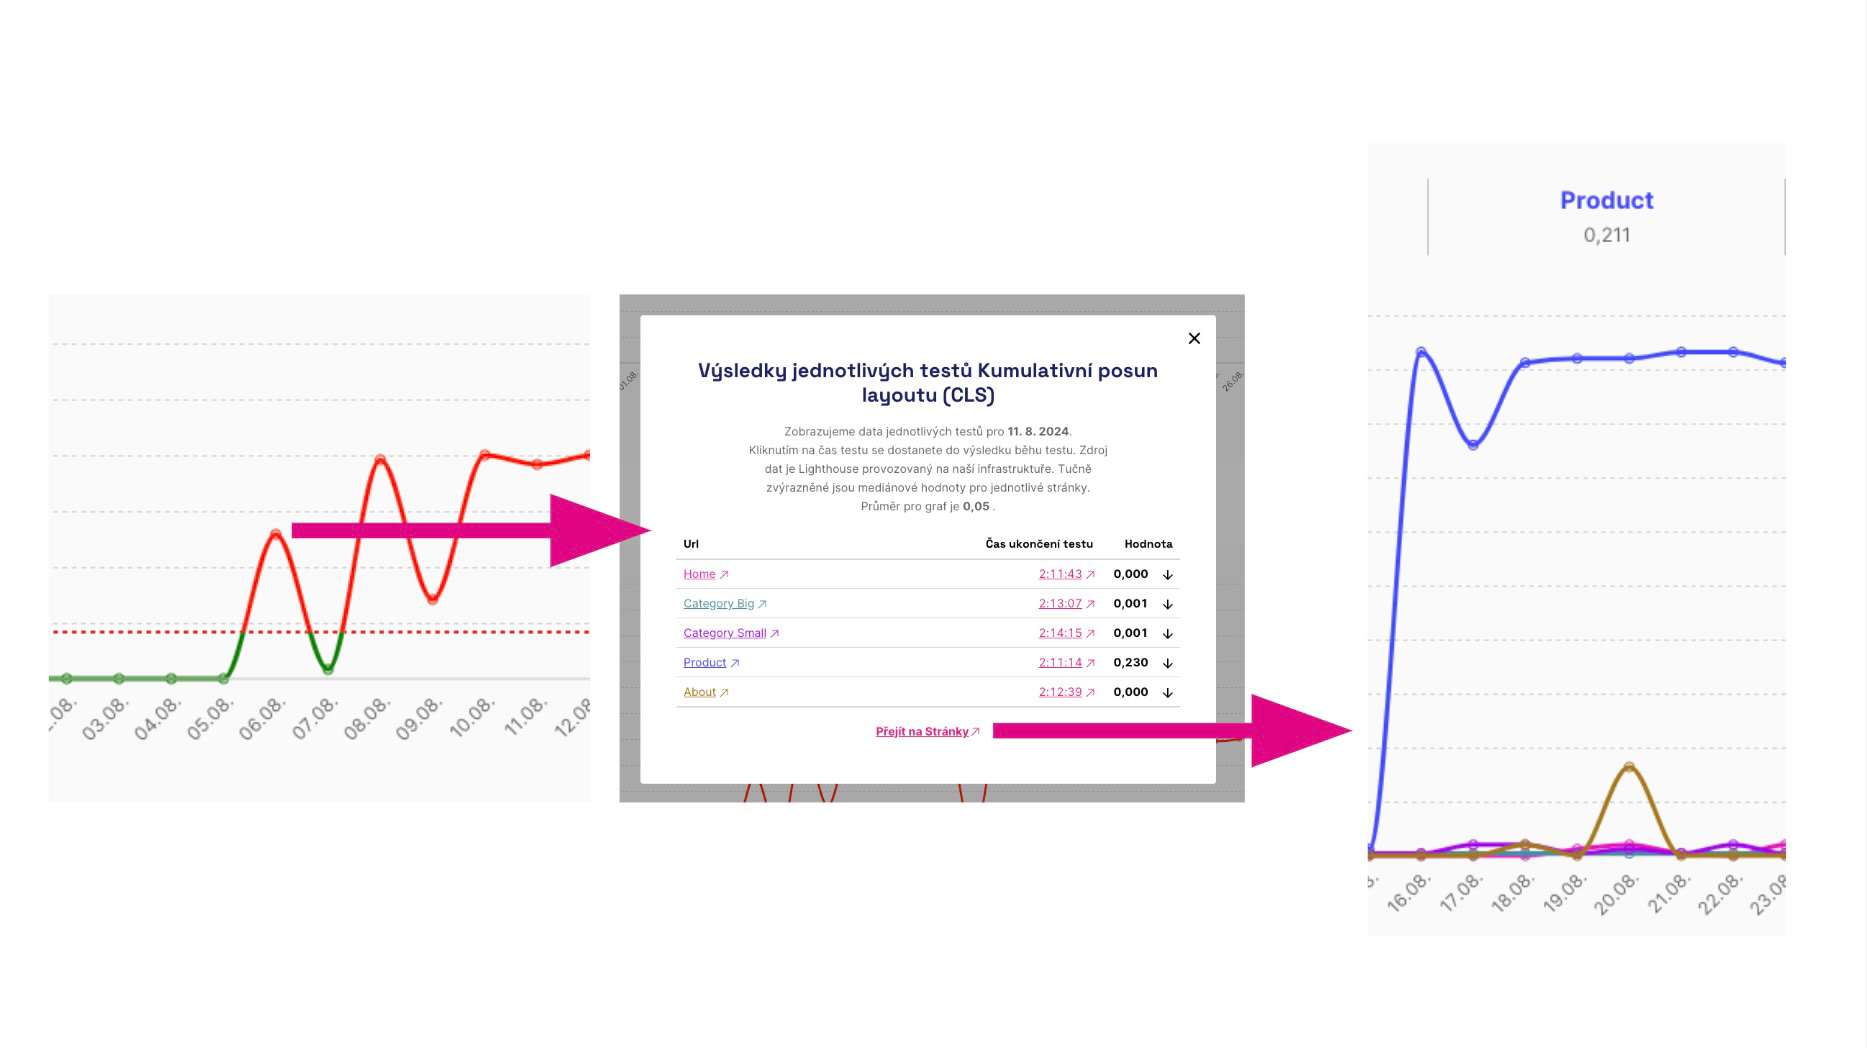 How to navigate to the problematic page affecting your speed? Click on the graph in the Watchdog, then the link to the Pages report in the modal window.
The Pages report displays the status and evolution of metrics for all measured URLs, both synthetic and Google user data (CrUX).
🔐 User data from Google (CrUX) for pages is available only in PLUS speed monitoring.
What If Some URLs Lack User Data?
It's quite common for data for certain URLs to be unavailable or only available for specific periods.
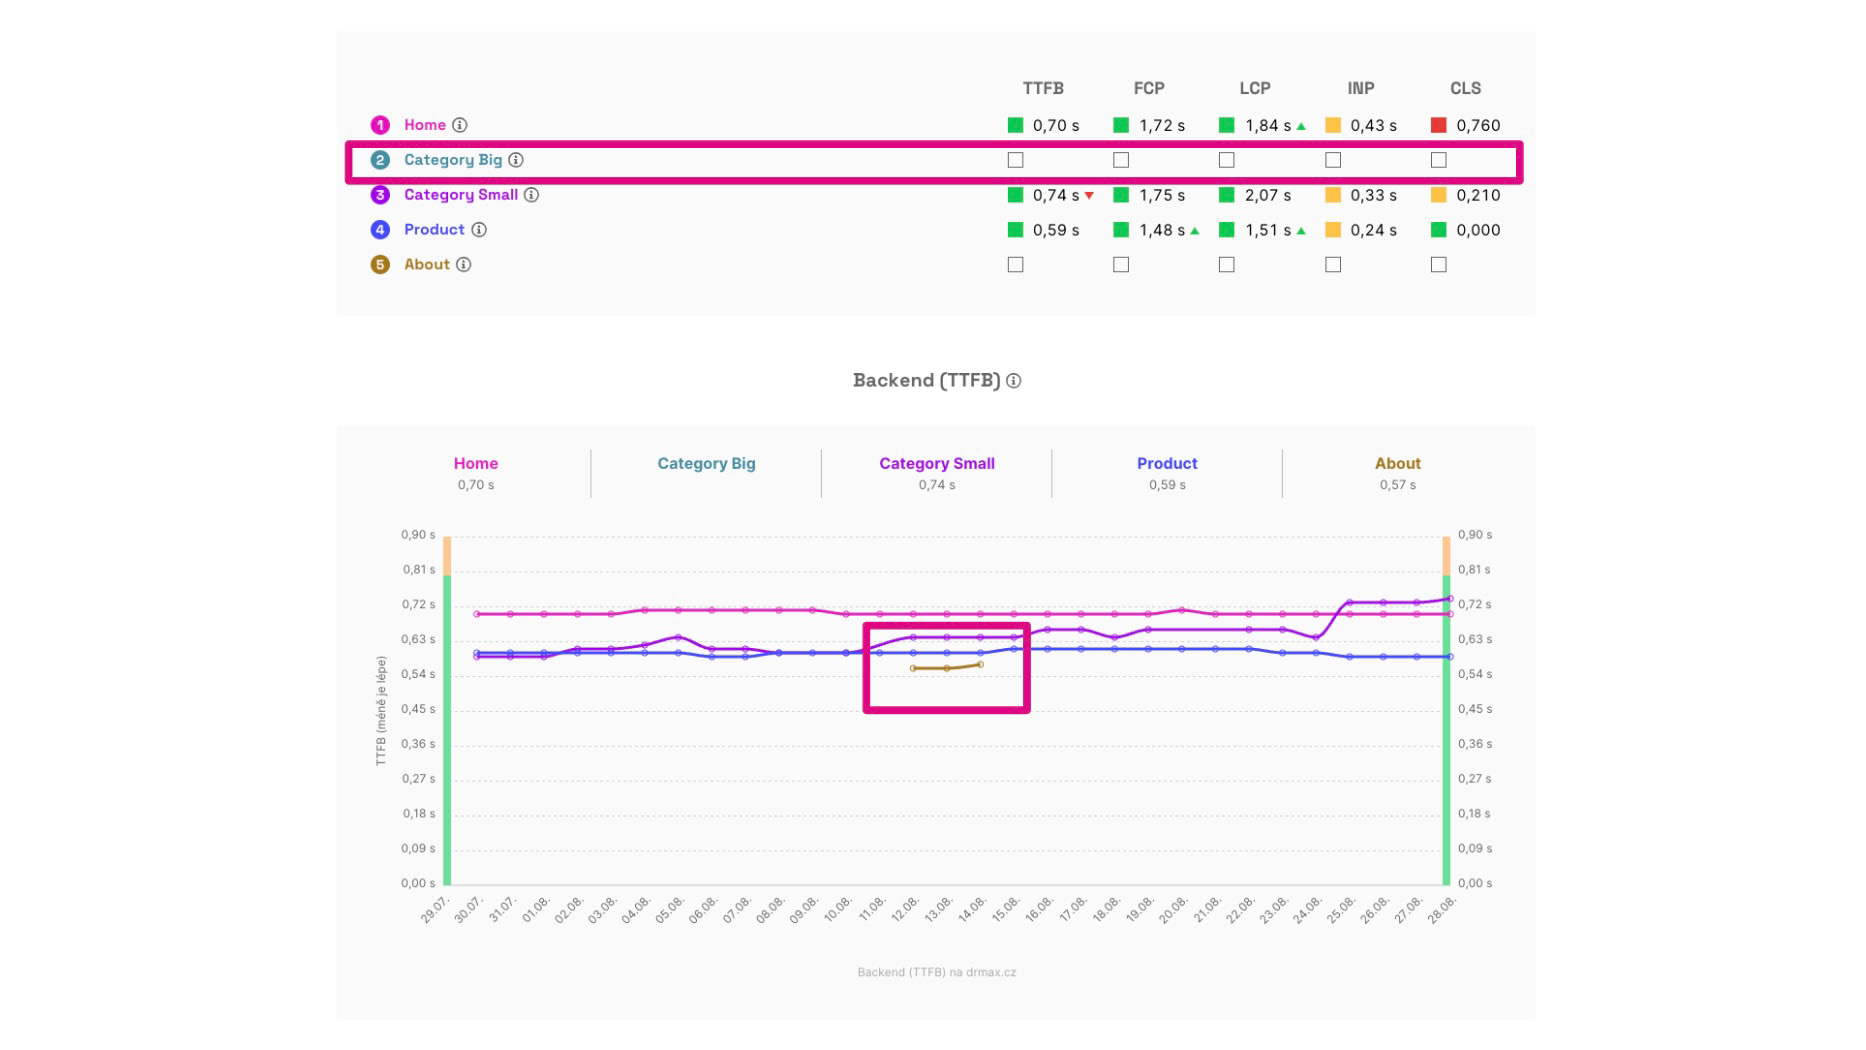 Above, you can see that some pages may not have CrUX data at all. Below, data is available only for certain specific days.
For displaying data from the Chrome UX Report, pages must meet certain traffic thresholds. It's common for smaller sites to have CrUX data for only a few typical pages.
In our Monitoring Settings documentation, we provide tips on finding better pages that have Google user data.
However, it's important to note that many websites simply won't have this data. That's why we also display synthetic data here.
Individual Graphs and Their Significance
We have two main sections here – user and synthetic measurements.
User Measurements for Pages
Data from the Chrome UX Report are available only for pages with a certain volume of traffic. They accurately reflect the speed for all Chrome users but are available only cumulatively for the last 28 days. Google does not provide data for all pages.
Here you see the status and evolution of these metrics among users:
- Backend (TTFB) – time for the backend, meaning server code and infrastructure.
- First Contentful Paint (FCP) – the first rendering of anything on the user's screen.
- Largest Contentful Paint (LCP) – the first largest content element.
- Interaction to Next Paint (INP) – response speed during interactions like clicking.
- Cumulative Layout Shift (CLS) – the sum of unwanted page layout shifts.
Synthetic Measurements for Pages
The status of metrics and their evolution for URLs specified in the test. The data here come from tests using the Lighthouse tool (see how we test). They are available for a specific day of measurement and each URL measurement, but may not be accurate since they don't come from users.
Here, you can see the status and evolution of the following synthetic measurement metrics:
- Lighthouse Performance Score (LPS) – overall speed score.
- Backend (TTFB) – time for the backend, meaning server code and infrastructure.
- First Contentful Paint (FCP) – the first rendering of anything on the user's screen.
- Largest Contentful Paint (LCP) – the first largest content element.
- Total Blocking Time (TBT) – the time during which the browser is blocked by executing frontend code.
- Third-Party Blocking Time (3PBT) – the time during which the browser is blocked by executing third-party frontend code.
- Cumulative Layout Shift (CLS) – the sum of unwanted page layout shifts.
Notes on Metrics and Differences Between Them
You might have a few questions looking at the metrics above, so let's answer the most common ones:
- Why do different types of measurements contain different metrics?
The metrics in the user and synthetic sections differ because some can only be obtained from real users (INP) and some only synthetically (LPS, TBT). - Why do different types of measurements return different values for the same metrics?
Metric values obtained from users can vary. For example, CLS is calculated synthetically only during the initial screen load but over the entire session for users. - There are many metrics; what should we focus on?
Focus primarily on user values (i.e., CrUX) of the Core Web Vitals metrics (LCP, CLS, INP).
Summary
What should you remember about the “Pages” report?
- The report is for detailed tracking of metric evolution for measured URLs.
- It's crucial to select URLs wisely in the settings.
- The “Pages” report is primarily for developers and other tech enthusiasts keen on diving into speed issues.
- Even though metrics share names, values may differ based on their sources.
- Focus mainly on Core Web Vitals from CrUX data.
Want to grasp measurement as a whole? There's a complete tutorial on tuning speed using PageSpeed.ONE on Vzhůru dolů.